Profitable MAMA & FAMA CrossoverIntroduction
The MESA Adaptive Moving Average (MAMA) was originally presented by John F. Ehlers. By design, it is a special kind of Exponential Moving Average with self-adjusting alpha. Its adaptation is based on the rate change of phase as measured by the Homodyne Discriminator and the alpha parameter is allowed to range between a maximum and minimum value (Fast Limit and Slow Limit).
Key Point: Ehlers suggested the maximum value to be 0.5 and the minimum to be 0.05 .
The variable alpha is computed as the Fast Limit divided by the phase rate of change. If the phase rate of change is large, the variable alpha is bounded at the SlowLimit. Then, this alpha is used to compute MAMA and FAMA (Following Adaptive Moving Average).
Should we rely on Ehlers' suggestions if we want to achieve the best result with MAMA & FAMA crossover system?
Well, he is a good specialist and widely recognized author, I respect him, but the answer is no and you can see results on the chart.
What is our goal?
We want to find the best configuration for MAMA & FAMA Crossover. To achieve that we need to analyze the MAMA's alpha parameter or, more specific, the bounds for this parameter, Fast and Slow Limits.
What is this tool?
This tool is a performance optimizer that uses decision tree-based algorithm under the hood to find the most profitable settings for the MAMA & FAMA Crossover. It analyzes a bunch of different Fast Limits (between 0.01 to 0.8 with step of 0.1 ) and Slow Limits (between 0.01 to 0.6 with step of 0.1 ) and backtests each combination across the entire history of an instrument. If the more profitable parameters were found, the indicator will switch its values to the found ones immediately.
So, instead of manually selecting and testing parameters just apply this indicator to your chart and
relax - the algorithm will find the best parameters for you
Alerts
It has a special alert that notifies when the more profitable settings were detected.
NOTE: It does not change what has already been plotted.
NOTE 2: This is not a strategy, but an algorithmic optimizer.
Reference: www.mesasoftware.com
MAMA & FAMA Crossover can be found here:
Algorithm

Dual Thrust Trading Algorithm (ps4)This is an PS4 update to the popular Dual Thrust trading algorithm posted by me some time ago (). It has been commonly used in futures, Forex and equity markets. The idea of Dual Thrust is similar to a typical breakout system, however dual thrust uses the historical price to construct update the look back period - theoretically making it more stable in any given period.
See: www.quantconnect.com

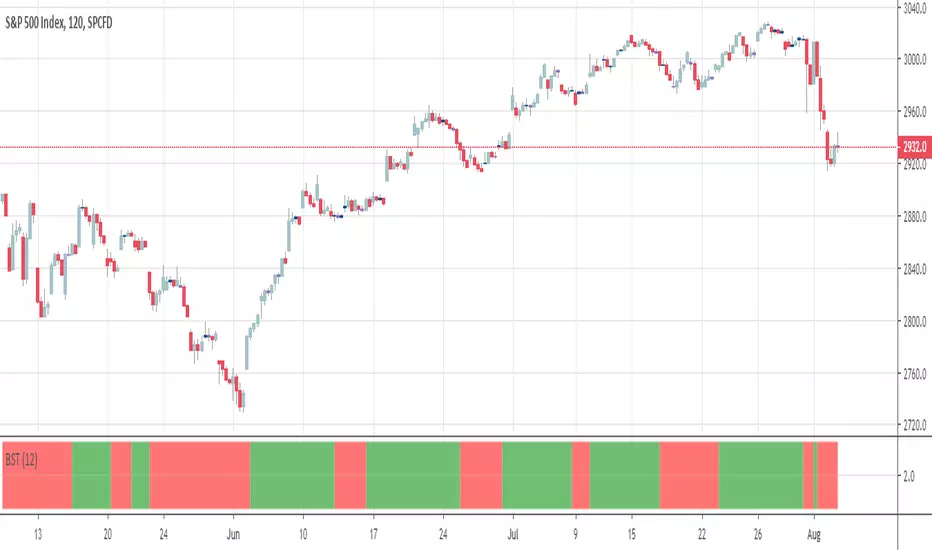
BSTtrend (and a quick note on trading psychology)Hi again :)
Script #2 for tonight, more to come :)
This one is a Pine transcription of a FXCM/LUA script called BSTrend
I used it years ago to trade index on very low timeframes with it. I'm always looking for oscillators that are more reactive than the traditional MACD. And even more reactive than the MACD Zero Lag
This is a proof of concept that Pinescript is my favorite trading programming language vs MT4/LUA/PRT. I just find it easier and the Pinescript community is helping a lot
With the BSTrend you can win but also lose. I see a lot of scripts out there but there is not a better or worst indicator. The key is HOW to use it.
In other words the key is your PSYCHOLOGY, without a rock-solid psychology, you'll end up committing a mistake even with G. himself whispering "BUY NOW", "SELL NOW" to your ears. (wait..... Do you mean this is happening only to me ????)
However, indicators help immensely in reducing the psychology pressure that we have to endure ... sometimes for days..... But better not to overcharge with dozens of indicators per chart and have a tool to detect whenever there is a confluence/convergence of your favorite indicators :) #algorithm #builder
I'll publish an educational post about next week
Those are the exact words that my mentor traders told me 6 years ago when I started trading
PS
____________________________________________________________
Be sure to hit the thumbs up as it shows me that I'm not doing this for nothing and will motivate to deliver more quality content in the future.
- I'm an officially approved PineEditor/LUA/MT4 approved mentor on codementor. You can request a coaching with me if you want and I'll teach you how to build kick-ass indicators and strategies
Jump on a 1 to 1 coaching with me
- You can also hire for a custom dev of your indicator/strategy/bot/chrome extension/python

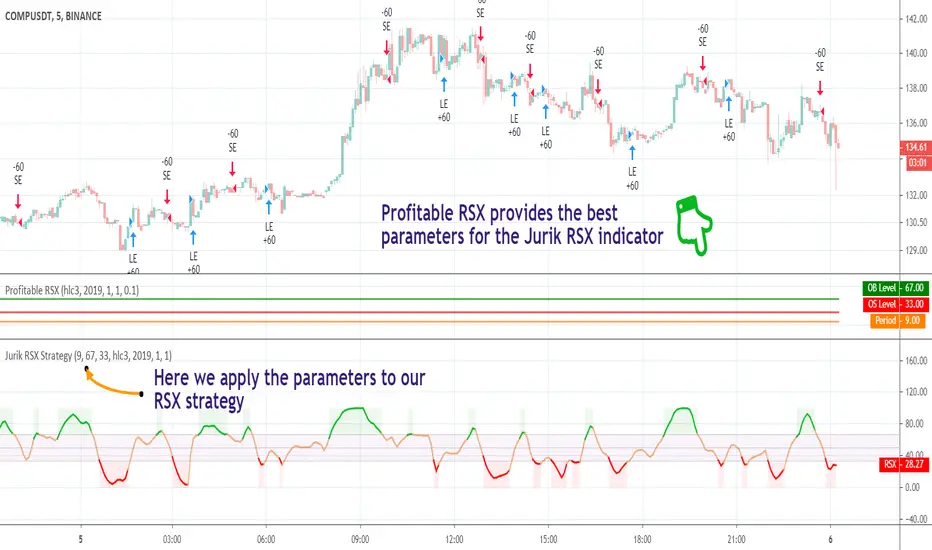
Profitable Jurik RSXIntroduction
As you know the Jurik RSX is a "noise free" smoothed version of RSI (Relative Strength Index), with no added lag.
It was originally developed by Mark Jurik and is used the same way as RSI. To learn more about this indicator see www.jurikres.com
The most basic and common strategy is to use the crossovers between Jurik RSX and its overbought/oversold levels as trade signals:
when RSX crosses above 30, go Long
when RSX crosses below 70, go Short
exit when a crossover occurs in the opposite direction
What is this tool?
This tool is a performance scanner that uses a decision tree-based algorithm under the hood to find the most profitable settings for Jurik RSX. It analyzes the range of periods between 2 to 100 and backtests the Jurik RSX for each period (using the strategy mentioned above) across the entire history of an instrument. If the more profitable parameter was found, the indicator will switch its value to the found one immediately.
So, instead of manually selecting parameters just apply it to your chart and relax - the algorithm will do it for you, everywhere you want.
The algorithm can work in two modes: Basic and Early Switch. The Early Switch algorithm makes some assumptions and activates a set of optimizations to find a better setting DURING the trades, not after they were actually closed.
The difference is illustrated on the screenshot below
But two modes can show identical values depending on timeframe
Additionally you can set up a backtest window through indicator's settings (the optimizers which were published before will get this feature soon).
Alerts
It has a special alert that notifies when a more profitable period was detected.
NOTE: It does not change what has already been plotted.
NOTE 2: This is not a strategy, but an algorithmic optimizer.
Profitable RSI (Relative Strength Index)Introduction
As you know the Relative Strength Index (RSI) was originally developed by J. Welles Wilder and was described in his book "New Concepts in Technical Trading Systems" (1978). It is intended to measure the strength or weakness of an instrument for the specified period.
The most basic strategy is to use the crossovers as trade signals:
when RSI crosses above 30, go Long
when RSI crosses below 70, go Short
Exit when a crossover occurs in the opposite direction
What is this tool?
This tool is a performance scanner that uses a decision tree-based algorithm under the hood to find the most profitable settings for RSI. It analyzes the range of periods between 2 to 100 and backtests the RSI for each period using the strategy mentioned above across the entire history of an instrument. If the more profitable parameter was found, the indicator will switch its value to the found one immediately.
So, instead of manually selecting parameters just apply it to your chart and relax - the algorithm will do it for you.
The algorithm can work in two modes: Basic and Advanced "Early Switch" . The Early Switch algorithm makes some assumptions and activates a set of optimizations to find the better setting DURING the trades, not after they were closed.
The difference is illustrated on the screenshot below:
Additionally you can set up a backtest window through indicator's settings (the optimizers which were published before will get this feature soon).
Alerts
It has a special alert that notifies when a more profitable period was detected.
NOTE: It does not change what has already been plotted.
NOTE 2: This is not a strategy, but an algorithmic optimizer.
Day after day. Night after night.
I've been waiting to program again.
Day after day. Night by to night.
Trading is waiting inside your heart.

Strategy Builder Crypto (Single Trend/Plots)Hi everyone
Big program for the daily indicator
This one will be free on trial only for a week because it has an immense value and required quite a lot of work. For more info to use it long-term, please DM me
That out of the way, let's dive right in...
This is a huge upgrade from that script Ultimate-Algorithm-Builder-Single-Trend
The Tradingview non-pro users will appreciate it because it allows to add the selected subsequent indicators as well. The Pro users too will likely like this feature equally, what the H*** I'm saying :)
This indicator will transform you into what I was in the past... into a quant trader. You'll build your own trading algorithm in a few clicks only
Which timeframe and which assets ?
Short answer : ALL and ALL
You'll have to define the configuration of the tool based on your capital, psychology. For custom configuration of the tool, please DM me directly so that we can discuss further
But a few words of advices anyway :
the bigger the timeframe, the lower the inputs (and vice-versa)
Think about how much $$ you want to make per trade and define your entries from there
Think about how much $$ you can afford to lose per trade and define the supertrend from there
...
Your golden configuration might not work for all assets.
You might have to create some tweaks - for instance you found a great config for BTCUSD but it's not working for ETHUSD, then you can create a copy of your BTCUSD chart and set a new config for ETHUSD
What are the indicators inside :
This fantastic tool that I personally use for my trading detects convergence between the following indicators :
Overlay - meaning if the price close above/below a moving average
Trend Signal - to detect if the the DOW law is broken and predict a possible reversal - en.wikipedia.org/wiki/Dow_theory
In other words, it detects if the higher highs or lower lows sequence is broken
MACD or MACD Zero Lag
MA Cross - Cross of moving averages
Ichimoku - if the price closes below/above the cloud
Supertrend - used to detect polarity zones
TSI Shadow -
Pullback
You'll also have the possibility to define a pullback on a given MA. That means basically that you'll get a convergence and it will only display a signal when it will pullback first
This will reduce your losses in case of invalidation and maximize your gains as it will enter the trade in a better position.
You can define your pullback either based an absolute value or based on a percent distance from the MA
+Example:
Pullback value = 100 means I want a 100 pip/USD distance between the MA pullback and the candle
Pullback percent = 2 means I want a 2% distance between the MA pullback and the candle
The percent option is more generic in my opinion but I let the other available for those who might like it
That's it ?
Almost....You can also setup alerts on the indicator signals so that you won't have to stay days in front of the chart to wait for a signal.
You receive the alert, you check real quick if we're not in front of a support/resistance, if no then take the trade. if yes, I advice waiting for a big pullback - better to be safe than sorry in trading
What If you want a custom version ?
Here are a few custom ideas I could add just for you :
re-enter everytime there is a convergence. So far the indicator is only taking the first convergence. This would give more entries
add the resistances/supports (fibo, pivot)
add the take profit targets and trailing stop loss
..
Please hit me up directly so we can discuss further. Any custom dev will require quite some time so it won't be free
Enjoy that one as I really think it will improve your analyst skills and trading and hopefully make you a few gains (which will make me very happy as I want to help most of you to at least not losing your capital)
Dave

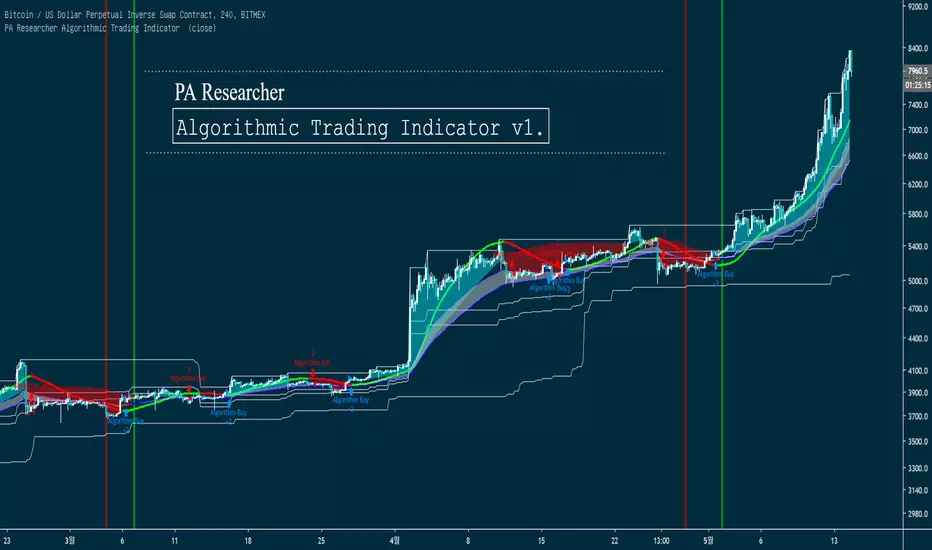
PA Researcher Algorithmic Trading Indicator PA Researcher Algorithmic Trading Indicator v1.
This Indicator is Algorithmic Trading Indicator.
Provide Best Buy/Sell Time & Good to check Long/Short term Trend For Swing/Scalping
Easy Trend Analysis for Beginner
Ability to Turn ON/OFF each Indicators
Ability to Change Colors
#This is not a Auto-Bot, This indicator Provide the Best Enter Time
-----------------------------------------------------------------------------------------------------------
PA Researcher Algorithmic Trading Indicator v1. 입니다.
자동화된 추세 분석을 통해 단/중/장기적인 추세 분석을 나타내주며,
알고리즘 값에 충족할 시 매수/매도 시그널이 나타납니다.
추세분석을 매우 쉽게 나타내며, 원웨이를 잡기에 매우 좋은 진입 시그널이 발생됩니다.
무엇보다, 추세변곡을 엄청나게 잘 잡아냅니다.
그 어떤것보다 시각적인 요소를 중요시 했기 때문에, 사용법을 잘 모르시는 분들도 쉽게 사용하실 수 있습니다.
Ex_)
Hit ratio example
적중률은 이 사진 한장으로 설명됩니다.

DabYourSelfDab Your Self
Trading Script -
this script is an algo for determining certain values per candle
-- request by Dab Your Self

Profitable SuperTrendHello friends,
This script is a powerful, non-repainting optimizer for the classic SuperTrend indicator — one of the most popular tools for trend-following and volatility-based trading. It automatically finds and applies the most profitable SuperTrend settings for each instrument and timeframe, removing the need for manual parameter tuning or guesswork.
🛠 How It Works
The indicator evaluates over 1,400 combinations of ATR Periods and Multipliers using a decision tree–based optimization algorithm .
Each configuration is backtested across the instrument's full history, and when a more profitable setup is identified, the indicator automatically switches to those values in real time — while preserving the standard SuperTrend logic.
It also supports commission customization for more realistic backtesting and includes an alert system that notifies you whenever a better parameter set is found.
This adaptive approach keeps the SuperTrend continuously tuned to evolving market conditions without repainting or distorting past data.
💡 Integrated Versions Explained
This all-in-one tool merges 3 complementary indicators:
• Profitable SuperTrend — A dedicated optimizer that runs in a separate window below your chart. It doesn’t produce buy/sell signals directly but analyzes your asset and timeframe to find optimal ATR settings. Results are visualized as two lines (purple and orange), with optional labels displaying the best parameter values. You can then manually apply these values to your standard SuperTrend.
• Self-Adjusting SuperTrend — A real-time overlay version that behaves like the standard SuperTrend but dynamically adjusts its parameters on the fly. It requires no manual setup and can be paired with the Profitable SuperTrend for full transparency over which values are currently active.
• Compact Self-Adjusting SuperTrend — A minimalist oscillator version that uses simple binary outputs: -1 for Sell and 1 for Buy. This format is ideal for filtering or integrating the adaptive logic into other trading systems.
Together, they form a complete adaptive suite that combines automation, flexibility, and precision — suitable for both discretionary and systematic traders.
🔥 Key Features
Adaptive optimization powered by a decision tree–based algorithm
Real-time switching to the most profitable SuperTrend parameters
Commission customization for realistic backtesting
Direction filter (Longs | Shorts | Longs & Shorts)
Optional analysis start date for focused historical testing
Smart alert when better settings are detected
Optional buy/sell labels and compact trend output
Clean and organized UI with improved workflow
If you'd like access or have any questions, feel free to reach out to me directly via DM.
👋 Good luck and happy trading!
Paid script

Double Top Pattern IdentifierHello friends,
This script is a powerful, non-repainting detector for the classic Double Top pattern — one of the most widely recognized bearish reversal setups. The indicator automatically identifies and tracks developing 'M'-shaped formations in real-time, confirming valid entries once the neckline is broken and providing complete trade management features. No manual configuration for detection is needed — it works out of the box.
🛠 How It Works
It uses advanced techniques that involve pivot points analysis and do not rely on other indicators, ensuring robustness and adaptability across different market conditions. When a potential Double Top is detected, the indicator marks the pattern points, draws the neckline, and waits for confirmation.
Once confirmed, it generates a 'Short' signal with calculated Take Profit (TP) and Stop Loss (SL) levels.
The script includes a statistics table summarizing performance metrics — such as number of patterns, trade results, bar distances, and top differences — all dynamically updated on your chart.
🔥 Key Features
Pine Script V6 — optimized logic and performance
Works out of the box — no manual configuration required
Non-repainting detection
Fully visualized structure — points, neckline, TP, and SL plotted automatically
Multiple TP/SL modes: R/R ratio, ATR-based, percent, points, pips, ticks, or top-to-neckline distance
Trailing Stop Loss support
Interactive statistics table with pattern count, trade outcomes, profit ratio, and structural measurements
Smart alert system
Customizable alert messages with placeholders (price, ticker, timeframe, etc.)
Clean, updated UI with improved layout and organization
If you'd like access or have any questions, feel free to reach out to me directly via DM.
👋 Good luck and happy trading!
Paid script

Double Bottom Pattern IdentifierHello friends,
This script is a powerful, non-repainting detector for the classic Double Bottom pattern — one of the most widely recognized bullish reversal setups. The indicator automatically identifies and tracks developing 'W'-shaped formations in real time, confirming valid entries once the neckline is broken and providing complete trade management features. No manual configuration is needed — it works right out of the box.
🛠 How It Works
It uses advanced techniques involving pivot point analysis and does not rely on other indicators, ensuring robustness and adaptability across different market conditions. When a potential Double Bottom is detected, the indicator marks the pattern points, draws the neckline, and waits for confirmation.
Once confirmed, it generates a 'Long' signal with calculated Take Profit (TP) and Stop Loss (SL) levels.
The script also includes a statistics table summarizing performance metrics — such as the number of patterns, trade results, bar distances, and bottom differences — all dynamically updated on your chart.
🔥 Key Features
Pine Script V6 — optimized logic and performance
Works right out of the box — no setup required
Non-repainting detection
Fully visualized structure — points, neckline, TP, and SL plotted automatically
Multiple TP/SL modes: R/R ratio, ATR-based, percent, points, pips, ticks, or bottom-to-neckline distance
Trailing Stop Loss support
Interactive statistics table with pattern count, trade outcomes, profit ratio, and structural measurements
Smart alert system
Customizable alert messages with placeholders (price, ticker, timeframe, etc.)
Clean, updated UI with improved layout and organization
If you'd like access or have any questions, feel free to reach out to me directly via DM.
👋 Good luck and happy trading!
Paid script

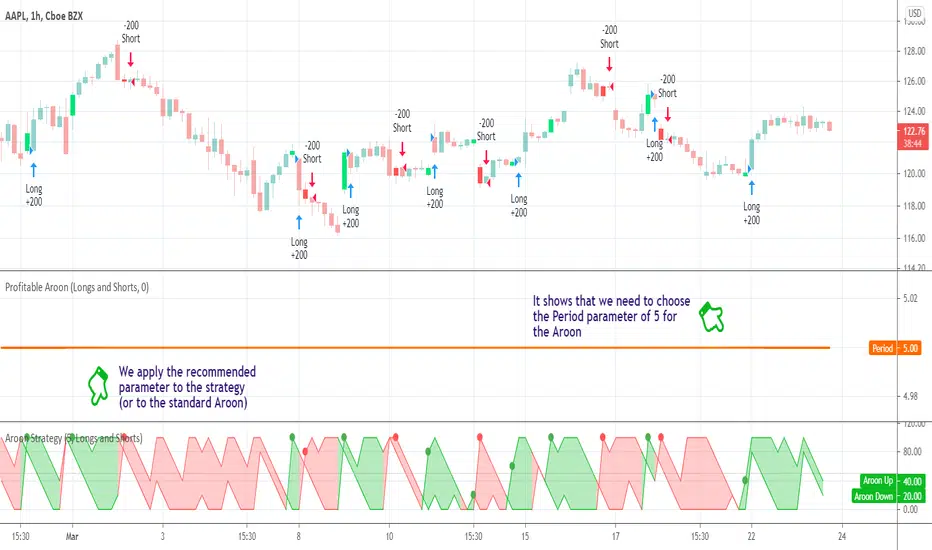
Profitable AroonIntroduction
The Aroon indicator was developed by well-known technical analyst Tushar Chande in 1995 and is used to identify trend changes in the price of an asset, as well as the strength of that trend. The fact that he named the indicator "Aroon" which is Sanskrit for "Dawn’s Early Light" demonstrates his belief in his indicator's trend discovery capabilities.
It is composed of two lines, Aroon Up and Aroon Down .
The most basic strategy is to use the crossovers as trade signals:
when Aroon Up crosses above Aroon Down , go Long
when Aroon Down crosses above Aroon Up , go Short
Exit when a crossover occurs in the opposite direction
What is this tool?
This tool is a performance scanner that uses a decision tree-based algorithm under the hood to find the most profitable period setting for the Aroon. It analyzes the range of periods between 2 to 100 and backtests the Aroon indicator for each period using the strategy mentioned above across the entire history of an instrument. If a more profitable parameter was found, the indicator will switch its value to the found one immediately.
Alerts
It has an alert that notifies when a more profitable period was found.
NOTE : It does not change what has already been plotted.
Good luck and Happy Trading!
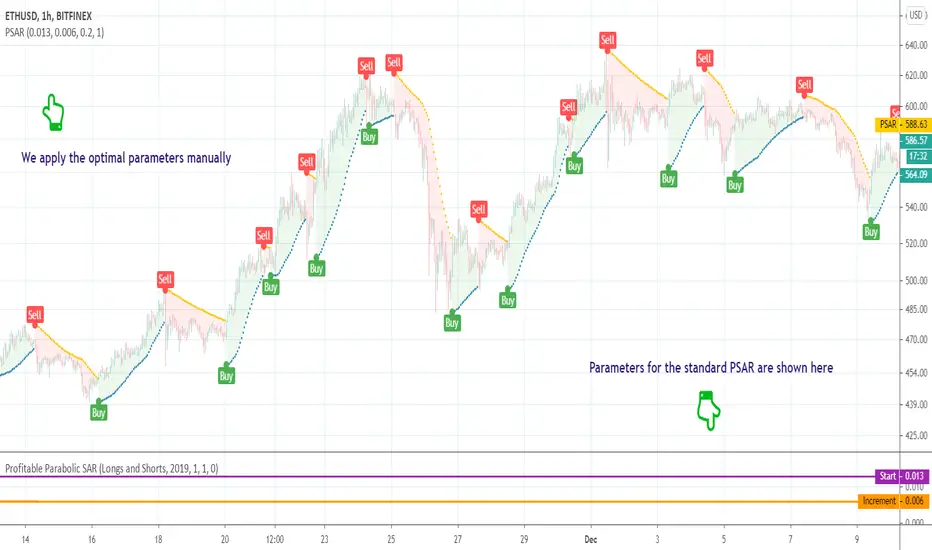
Profitable Parabolic SARHello friends,
This script is a powerful, non-repainting optimizer for the classic Parabolic Stop and Reverse (PSAR) — one of J. Welles Wilder's most respected trend-following systems. It automatically finds and applies the most profitable PSAR settings for each instrument and timeframe, eliminating the need for manual parameter tuning.
🛠 How It Works
The indicator evaluates over 500 combinations of PSAR parameters using a decision tree–based algorithm under the hood .
Each configuration is backtested across the instrument's full price history, and when a more profitable setup is identified, the indicator seamlessly switches to those values in real time — while maintaining the original PSAR logic.
The Maximum parameter remains fixed since its impact on overall profitability is minimal compared to Start and Increment.
This self-adjusting approach removes the guesswork of parameter optimization and keeps the PSAR dynamically tuned to changing market regimes.
💡 Integrated Versions Explained
This all-in-one tool merges 3 complementary indicators:
• Profitable PSAR — A parameter optimizer that runs in a separate window below your main chart. It doesn't generate buy/sell signals directly but analyzes your specific asset and timeframe to find optimal settings. These are displayed as two lines (purple and orange), with optional labels showing the actual parameter values. Once identified, you can apply these optimal values manually to the standard PSAR.
• Self-Adjusting PSAR — A real-time overlay version that looks and behaves like the standard PSAR but automatically adjusts its parameters on the fly. It requires no manual configuration and can be paired with the Profitable PSAR to monitor which settings are currently active.
• Compact Self-Adjusting PSAR — A minimalist oscillator version that reflects the same adaptive logic through simple binary outputs: -1 for Sell and 1 for Buy. This variant is ideal for filtering or signal integration into other systems.
Together, they form a unified adaptive system that gives users both automation and interpretability — the best of both worlds.
🔥 Key Features
Adaptive optimization powered by a decision tree–based algorithm
Real-time switching to more profitable parameter configurations
Direction filter (Longs | Shorts | Longs & Shorts)
Optional analysis start date for focused historical testing
Commission customization for realistic performance modeling
Visual highlighting of parameter changes
Optional buy/sell labels and compact trend signal display
If you'd like access or have any questions, feel free to reach out to me directly via DM.
👋 Good luck and happy trading!
Paid script
Dual Thrust Trading AlgorithmThe Dual Thrust trading algorithm is a famous strategy developed by Michael Chalek. It has been commonly used in futures, forex and equity markets. The idea of Dual Thrust is similar to a typical breakout system, however dual thrust uses the historical price to construct update the look back period - theoretically making it more stable in any given period.
Profitable Vortex Indicator ScannerIntroduction
The Vortex Indicator is a technical indicator invented by Etienne Botes and Douglas Siepman (Technical Analysis of Stocks & Commodities, V.28:1 (January, 2010): "The Vortex Indicator") to identify the start of a new trend or the continuation of an existing trend within financial markets.
It is composed of two lines, +VI and -VI . +VI represents up trending momentum and -VI represents down trending momentum.
The most basic strategy is to use the crossovers as trade signals:
when +VI crosses above -VI , go Long
when -VI crosses above +VI , go Short
Exit when a crossover occurs in the opposite direction
What is this tool?
This tool is a performance scanner that uses a decision tree-based algorithm under the hood to find the most profitable period's setting for the indicator. It analyzes the range of periods between 2 to 100 and backtests the Vortex Indicator for each period using the strategy mentioned above across the entire history of an instrument.
Settings
Net Profit line is optional and can be hidden through settings.
Alerts
It has an alert that notifies when a more profitable period was detected.
NOTE : It does not change what has already been plotted.
Good luck!

BITCOIN DOMINATOR-- BOT-- Bitmex Ready!ladies and gentlemen,
We cracked the XBT code.
For more information, visit the website in my bio.
Moon Bound! god speed!
Vix spread Betting/CFD strategy. Highest profit factor ever?Recently I have noticed that many CFD and spread betting providers (I wont mention which ones but they are easy to find with a quick google search) are letting users "trade" the CBOE Volatility Index ( VIX ). I thought this was unusual as the VIX is not a purchasable asset; it is a measure of implied volatility (both long and short) on the S&P500 calculated through a formula using the price of S&P options. As far as I know the VIX has never been directly tradeable until now, VIX related products like ETFs which attempt to follow the VIX has been available for nearly two decades however they suffer greatly from slippage which makes them difficult to trade.
I am astonished that we are now, for the first time, able to bet on the result of a formula. I think that CFD and spread betting providers have made a mistake, they were probably just looking to add more tradable products and didn't think through fully that the VIX is not like any of their other products, and is much easier to profit from when using a quantitative strategy.
This strategy works live on 4H and daily charts and achieves absolutely ridiculous results. I set it to start with $100 initial capital, and over the course of 465 trades it made $73154339495899.86 profit due to compounding profits. This is a profit factor of 695603.753. I don't expect to earn this much profit myself as I am sure that CFD and spread betting providers will eventually realize that it was a mistake to let traders have positions betting on the outcome of a formula, and eventually stop allowing VIX trades to be placed. I am currently trading using this algorithm, and will maybe let others use this script eventually after I've had my fun. So follow me :)

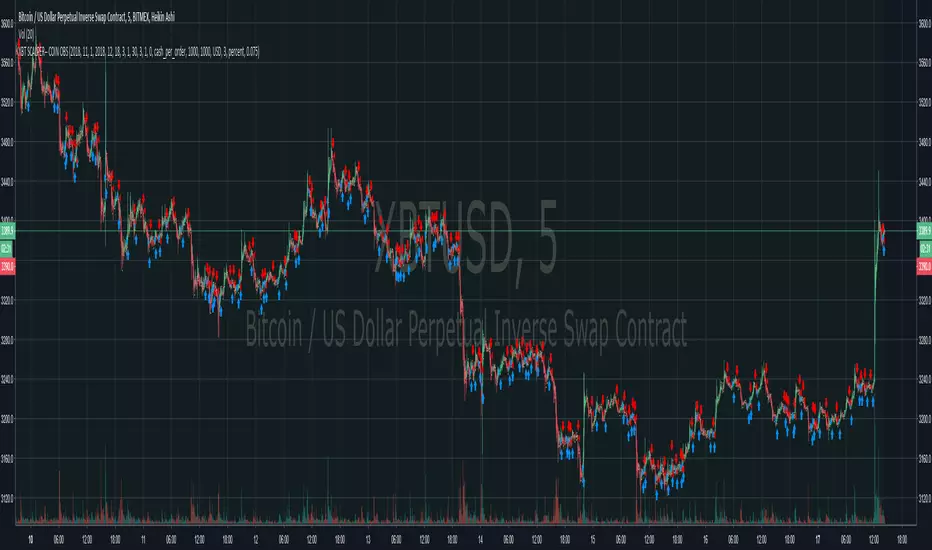
Bitcoin Trading Algo, 30,500% profit long + short. Beats HODLingREAD DISCRIPTION FIRST
Trading view have taken off the Invite Only options for scripts from free accounts and since I usually only like people I know using my scripts I have programmed my own password and Keycode system within pine script, the Keycode changes every month and is determined by a random number algorithm so you will need to know both the password and the keycode for the script to wok for you.
The objective for this strategy was to reduce the standard divination of bitcoin returns through risk management, this is done with both long and short trades. It looks to get on board when a trend is detected and adds to the position to average out all entry points. When the momentum begins to decelerate all trades are closed. 50% of these trades will usually be in profit and 50% will usually be a loss, however profits are 3x larger than losses.
To demonstrate that the deviation of retuns of the strategy is lower than hodling, I leaveraged the strategy to a similar drawdown level to hodling so that you can compare the two.
When risk adjusted, my strategy beats buy and hold returns by about 600%, although I am personally trading the strategy unleaveraged.
MTF Deviation - Mtrl_ScientistHi everyone,
There are a lot of possible ways to look at markets and find valid patterns.
This time, I've looked at how shorter time frames deviate from the overall price consensus.
What you're seeing here is a range-bound difference of the lowest time frame from the overall price consensus (baseline), represented as blue line.
When lower time frames agree with the baseline, the difference becomes 0.
Logically, this difference cannot deviate too much from the baseline, and to quantify that, I've added fib-levels based on a deviation percentage that depends on price volatility and can be adjusted in the settings.
How it works:
First of all, you need to switch to the 1min time frame to get access to the lowest time frame data.
Look at how the blue line follows the support/resistance fib levels.
Oversold conditions are usually given by entering the lowest red band, whereas overbought conditions are given by entering the upper red band.
However, there are also extreme cases, where the blue line exceeds the set fib levels. In that case, price will reverse with very high likelihood.
Alternatively you can also ping-pong between two fib levels for frequent small trades.
Note that this indicator doesn't use any security functions to access time frame data. Instead, I found a different way to avoid repainting.
At the moment I'm just playing around with this to see how I can improve it. Feedback is very welcome!

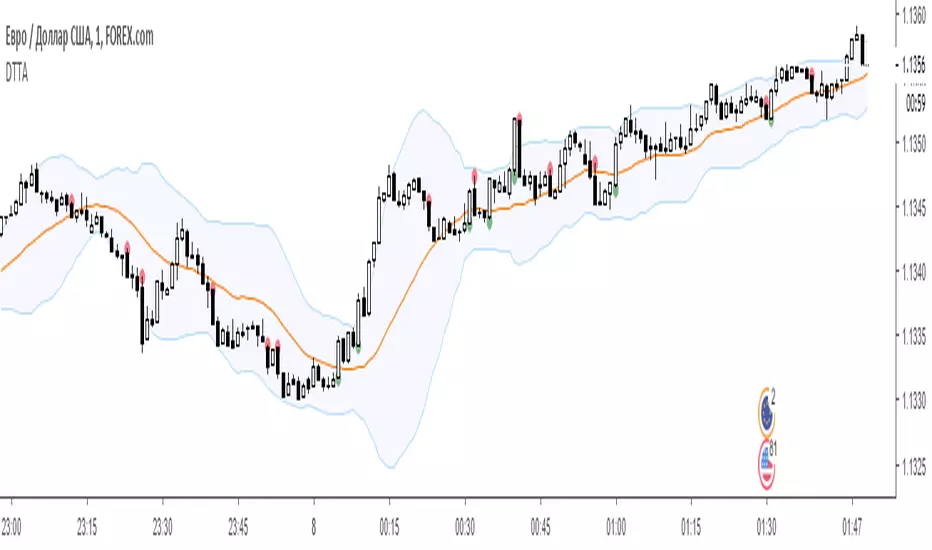
CryptoMedics Algorithmic Trading BandsCryptoMedics are happy to announce the release of our new Algorithmic trading bands!
The Bands can be used as dynamic support and resistance levels. Anything from scalping on the 1m chart to swing trading on the daily. The opportunities are endless.
Developed using tried and tested methods that hedge funds from wallstreet to smart individual traders have used for years now. Now all available to you.
Here is an example of scalping with it on the 3m chart on BCHZ18. If you would've used 10x leverage you would've made a total of 760%!
Examples:
Another example on XBTUSD using the bands to catch a swing trade
These results are undeniably good and I bet you can't find similar ones with any other indicator!

CryptoMedics Algorithmic Trading Bands CryptoMedics are happy to announce the release of our new Algorithmic trading bands!
The Bands are used as dynamic moving support and resistance levels and can be used for anything from scalping on low timeframes to swing trading larger moves.
An example of this would be if a coin pumped 20% and you're expecting it to go up more you wait for it to return to either the upper middle or one of the core bands and long it there.
The amount of usecases for this indicator is endless.
Developed using tried and proven methods that everyone from private individuals to wallstreet hedge funds have used. Now available to CryptoMedics subscribers.
The indicator works across any assets since it isn't based on any pair-specific data but rather more broad data that exists on all trading pairs.
