V-CORE Engine Free v1V-CORE Engine Free v1 — Public Release
This is a simplified trend-state visualiser from the V-CORE suite, designed for clean directional bias on crypto markets using 1H+ timeframes.
The engine runs fixed, non-editable internal logic with multi-stage trend confirmation.
No optimisation, no signals, no settings — just locked-in regime detection for educational and research use.
This free edition is a lightweight derivative of our internal V-CORE Engine architecture.
It includes only the essential background-state display while keeping all proprietary components sealed.
For additional V-CORE tools, future releases, or extended versions, please visit our TradingView profile.
ALTS

CDVI – First Crypto Dominance Volatility Index by Armi GoldmanThe Crypto Dominance Volatility Index (CDVI) is the first volatility-based indicator designed specifically to analyze the stability and instability of dominance flows in the crypto market.
Instead of measuring price volatility, CDVI focuses on the volatility of market dominance itself — a structural driver behind capital rotation cycles such as Bitcoin Season, Altseason, accumulation zones, and macro cycle transitions.
CDVI transforms dominance changes into a clear volatility index that highlights compression, expansion, and regime shifts.
How it works
CDVI calculates the absolute or percentage-based realized volatility of your chosen dominance benchmark (BTC.D, TOTAL.D, or any dominance index available on TradingView).
The indicator then:
1. Smooths the volatility curve using adjustable parameters
2. Builds a long-term mean to identify regime structure
3. Computes percentile zones over a rolling lookback window
4. Highlights high-risk and low-risk dominance conditions using color-coded backgrounds
This creates a clean, noise-reduced volatility representation of the dominance market.
Why it looks like this
The CDVI curve is intentionally smooth and cyclical because dominance volatility behaves differently from price volatility:
• Dominance tends to trend slowly, then spike violently during rotation phases
• Periods of prolonged compression often occur before large macro moves
• Volatility bursts cluster during transitions (e.g. BTC → Alts, cycle tops, market-wide repricing)
The percentile zones (90% / 10%) give structural thresholds for extreme conditions.
Background color reveals when dominance volatility enters these extremes, creating visually clear “regime blocks.”
How to interpret CDVI
High CDVI (above the 90th percentile):
• Dominance instability
• Capital rotation phases are active
• Market is repricing sector allocations
• Often appears near Altseason tops or bottoms
• Signals caution for trend traders and opportunity for rotation traders
Low CDVI (below the 10th percentile):
• Compression and calm dominance
• Accumulation and structural balance
• Often precedes major expansions in Bitcoin or Alt markets
• Useful for anticipating cycle transitions before they break out
Long-term mean:
• Helps identify when the market is in a high-vol or low-vol regime
• Crossings around the mean often coincide with early cycle shifts
How to use CDVI in practice
1. Cycle Timing
Use CDVI to detect when the market moves from calm → expansion or expansion → exhaustion.
Low CDVI usually precedes major moves. High CDVI often marks transition turbulence.
2. BTC vs Altcoins Rotation
Combine CDVI with BTC.D / TOTAL2 / TOTAL3 to detect rotation windows.
High CDVI = dominance is unstable → rotations happen.
Low CDVI = dominance is stable → trending environment.
3. Risk Management
High CDVI suggests elevated structural risk (dominance shifting).
Low CDVI supports directional conviction.
4. Confluence with Price
When both price volatility and dominance volatility expand together → macro transition.
When price is volatile but CDVI is flat → noise, not structural change.
Who this indicator is for
• Cycle analysts
• Macro crypto traders
• BTC vs Alts rotation traders
• Portfolio allocators
• Long-term investors looking at structural market phases
CDVI is designed as a clean, structural tool for understanding volatility not of price — but of market power distribution.

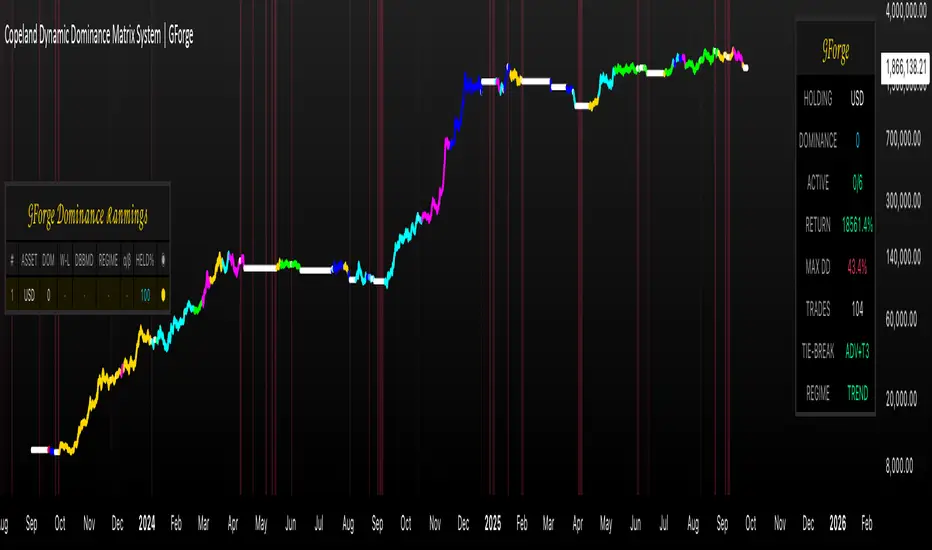
Copeland Dynamic Dominance Matrix System | GForgeCopeland Dynamic Dominance Matrix System | GForge - v1
---
📊 COMPREHENSIVE SYSTEM OVERVIEW
The GForge Dynamic BB% TrendSync System represents a revolutionary approach to algorithmic portfolio management, combining cutting-edge statistical analysis, momentum detection, and regime identification into a unified framework. This system processes up to 39 different cryptocurrency assets simultaneously, using advanced mathematical models to determine optimal capital allocation across dynamic market conditions.
Core Innovation: Multi-Dimensional Analysis
Unlike traditional single-asset indicators, this system operates on multiple analytical dimensions:
Momentum Analysis: Dual Bollinger Band Modified Deviation (DBBMD) calculations
Relative Strength: Comprehensive dominance matrix with head-to-head comparisons
Fundamental Screening: Alpha and Beta statistical filtering
Market Regime Detection: Five-component statistical testing framework
Portfolio Optimization: Dynamic weighting and allocation algorithms
Risk Management: Multi-layered protection and regime-based positioning
---
🔧 DETAILED COMPONENT BREAKDOWN
1. Dynamic Bollinger Band % Modified Deviation Engine (DBBMD)
The foundation of this system is an advanced oscillator that combines two independent Bollinger Band systems with asymmetric parameters to create unique momentum readings.
Technical Implementation:
[
// BB System 1: Fast-reacting with extended standard deviation
primary_bb1_ma_len = 40 // Shorter MA for responsiveness
primary_bb1_sd_len = 65 // Longer SD for stability
primary_bb1_mult = 1.0 // Standard deviation multiplier
// BB System 2: Complementary asymmetric design
primary_bb2_ma_len = 8 // Longer MA for trend following
primary_bb2_sd_len = 66 // Shorter SD for volatility sensitivity
primary_bb2_mult = 1.7 // Wider bands for reduced noise
Key Features:
Asymmetric Design: The intentional mismatch between MA and Standard Deviation periods creates unique oscillation characteristics that traditional Bollinger Bands cannot achieve
Percentage Scale: All readings are normalized to 0-100% scale for consistent interpretation across assets
Multiple Combination Modes:
BB1 Only: Fast/reactive system
BB2 Only: Smooth/stable system
Average: Balanced blend (recommended)
Both Required: Conservative (both must agree)
Either One: Aggressive (either can trigger)
Mean Deviation Filter: Additional volatility-based layer that measures the standard deviation of the DBBMD% itself, creating dynamic trigger bands
Signal Generation Logic:
// Primary thresholds
primary_long_threshold = 71 // DBBMD% level for bullish signals
primary_short_threshold = 33 // DBBMD% level for bearish signals
// Mean Deviation creates dynamic bands around these thresholds
upper_md_band = combined_bb + (md_mult * bb_std)
lower_md_band = combined_bb - (md_mult * bb_std)
// Signal triggers when DBBMD crosses these dynamic bands
long_signal = lower_md_band > long_threshold
short_signal = upper_md_band < short_threshold
For more information on this BB% indicator, find it here:
2. Revolutionary Dominance Matrix System
This is the system's most sophisticated innovation - a comprehensive framework that compares every asset against every other asset to determine relative strength hierarchies.
Mathematical Foundation:
The system constructs a mathematical matrix where each cell represents whether asset i dominates asset j:
// Core dominance matrix (39x39 for maximum assets)
var matrix dominance_matrix = matrix.new(39, 39, 0)
// For each qualifying asset pair (i,j):
for i = 0 to active_count - 1
for j = 0 to active_count - 1
if i != j
// Calculate price ratio BB% TrendSync for asset_i/asset_j
ratio_array = calculate_price_ratios(asset_i, asset_j)
ratio_dbbmd = calculate_dbbmd(ratio_array)
// Asset i dominates j if ratio is in uptrend
if ratio_dbbmd_state == 1
matrix.set(dominance_matrix, i, j, 1)
Copeland Scoring Algorithm:
Each asset receives a dominance score calculated as:
Dominance Score = Total Wins - Total Losses
// Calculate net dominance for each asset
for i = 0 to active_count - 1
wins = 0
losses = 0
for j = 0 to active_count - 1
if i != j
if matrix.get(dominance_matrix, i, j) == 1
wins += 1
else
losses += 1
copeland_score = wins - losses
array.set(dominance_scores, i, copeland_score)
Head-to-Head Analysis Process:
Ratio Construction: For each asset pair, calculate price_asset_A / price_asset_B
DBBMD Application: Apply the same DBBMD analysis to these ratios
Trend Determination: If ratio DBBMD shows uptrend, Asset A dominates Asset B
Matrix Population: Store dominance relationships in mathematical matrix
Score Calculation: Sum wins minus losses for final ranking
This creates a tournament-style ranking where each asset's strength is measured against all others, not just against a benchmark.
3. Advanced Alpha & Beta Filtering System
The system incorporates fundamental analysis through Capital Asset Pricing Model (CAPM) calculations to filter assets based on risk-adjusted performance.
Alpha Calculation (Excess Return Analysis):
// CAPM Alpha calculation
f_calc_alpha(asset_prices, benchmark_prices, alpha_length, beta_length, risk_free_rate) =>
// Calculate asset and benchmark returns
asset_returns = calculate_returns(asset_prices, alpha_length)
benchmark_returns = calculate_returns(benchmark_prices, alpha_length)
// Get beta for expected return calculation
beta = f_calc_beta(asset_prices, benchmark_prices, beta_length)
// Average returns over period
avg_asset_return = array_average(asset_returns) * 100
avg_benchmark_return = array_average(benchmark_returns) * 100
// Expected return using CAPM: E(R) = Beta * Market_Return + Risk_Free_Rate
expected_return = beta * avg_benchmark_return + risk_free_rate
// Alpha = Actual Return - Expected Return
alpha = avg_asset_return - expected_return
Beta Calculation (Volatility Relationship):
// Beta measures how much an asset moves relative to benchmark
f_calc_beta(asset_prices, benchmark_prices, length) =>
// Calculate return series for both assets
asset_returns =
benchmark_returns =
// Populate return arrays
for i = 0 to length - 1
asset_return = (current_price - previous_price) / previous_price
benchmark_return = (current_bench - previous_bench) / previous_bench
// Calculate covariance and variance
covariance = calculate_covariance(asset_returns, benchmark_returns)
benchmark_variance = calculate_variance(benchmark_returns)
// Beta = Covariance(Asset, Market) / Variance(Market)
beta = covariance / benchmark_variance
Filtering Applications:
Alpha Filter: Only includes assets with alpha above specified threshold (e.g., >0.5% monthly excess return)
Beta Filter: Screens for desired volatility characteristics (e.g., beta >1.0 for aggressive assets)
Combined Screening: Both filters must pass for asset qualification
Dynamic Thresholds: User-configurable parameters for different market conditions
4. Intelligent Tie-Breaking Resolution System
When multiple assets have identical dominance scores, the system employs sophisticated methods to determine final rankings.
Standard Tie-Breaking Hierarchy:
// Primary tie-breaking logic
if score_i == score_j // Tied dominance scores
// Level 1: Compare Beta values (higher beta wins)
beta_i = array.get(beta_values, i)
beta_j = array.get(beta_values, j)
if beta_j > beta_i
swap_positions(i, j)
else if beta_j == beta_i
// Level 2: Compare Alpha values (higher alpha wins)
alpha_i = array.get(alpha_values, i)
alpha_j = array.get(alpha_values, j)
if alpha_j > alpha_i
swap_positions(i, j)
Advanced Tie-Breaking (Head-to-Head Analysis):
For the top 3 performers, an enhanced tie-breaking mechanism analyzes direct head-to-head price ratio performance:
// Advanced tie-breaker for top performers
f_advanced_tiebreaker(asset1_idx, asset2_idx, lookback_period) =>
// Calculate price ratio over lookback period
ratio_history =
for k = 0 to lookback_period - 1
price_ratio = price_asset1 / price_asset2
array.push(ratio_history, price_ratio)
// Apply simplified trend analysis to ratio
current_ratio = array.get(ratio_history, 0)
average_ratio = calculate_average(ratio_history)
// Asset 1 wins if current ratio > average (trending up)
if current_ratio > average_ratio
return 1 // Asset 1 dominates
else
return -1 // Asset 2 dominates
5. Five-Component Aggregate Market Regime Filter
This sophisticated framework combines multiple statistical tests to determine whether market conditions favor trending strategies or require defensive positioning.
Component 1: Augmented Dickey-Fuller (ADF) Test
Tests for unit root presence to distinguish between trending and mean-reverting price series.
// Simplified ADF implementation
calculate_adf_statistic(price_series, lookback) =>
// Calculate first differences
differences =
for i = 0 to lookback - 2
diff = price_series - price_series
array.push(differences, diff)
// Statistical analysis of differences
mean_diff = calculate_mean(differences)
std_diff = calculate_standard_deviation(differences)
// ADF statistic approximation
adf_stat = mean_diff / std_diff
// Compare against threshold for trend determination
is_trending = adf_stat <= adf_threshold
Component 2: Directional Movement Index (DMI)
Classic Wilder indicator measuring trend strength through directional movement analysis.
// DMI calculation for trend strength
calculate_dmi_signal(high_data, low_data, close_data, period) =>
// Calculate directional movements
plus_dm_sum = 0.0
minus_dm_sum = 0.0
true_range_sum = 0.0
for i = 1 to period
// Directional movements
up_move = high_data - high_data
down_move = low_data - low_data
// Accumulate positive/negative movements
if up_move > down_move and up_move > 0
plus_dm_sum += up_move
if down_move > up_move and down_move > 0
minus_dm_sum += down_move
// True range calculation
true_range_sum += calculate_true_range(i)
// Calculate directional indicators
di_plus = 100 * plus_dm_sum / true_range_sum
di_minus = 100 * minus_dm_sum / true_range_sum
// ADX calculation
dx = 100 * math.abs(di_plus - di_minus) / (di_plus + di_minus)
adx = dx // Simplified for demonstration
// Trending if ADX above threshold
is_trending = adx > dmi_threshold
Component 3: KPSS Stationarity Test
Complementary test to ADF that examines stationarity around trend components.
// KPSS test implementation
calculate_kpss_statistic(price_series, lookback, significance_level) =>
// Calculate mean and variance
series_mean = calculate_mean(price_series, lookback)
series_variance = calculate_variance(price_series, lookback)
// Cumulative sum of deviations
cumulative_sum = 0.0
cumsum_squared_sum = 0.0
for i = 0 to lookback - 1
deviation = price_series - series_mean
cumulative_sum += deviation
cumsum_squared_sum += math.pow(cumulative_sum, 2)
// KPSS statistic
kpss_stat = cumsum_squared_sum / (lookback * lookback * series_variance)
// Compare against critical values
critical_value = significance_level == 0.01 ? 0.739 :
significance_level == 0.05 ? 0.463 : 0.347
is_trending = kpss_stat >= critical_value
Component 4: Choppiness Index
Measures market directionality using fractal dimension analysis of price movement.
// Choppiness Index calculation
calculate_choppiness(price_data, period) =>
// Find highest and lowest over period
highest = price_data
lowest = price_data
true_range_sum = 0.0
for i = 0 to period - 1
if price_data > highest
highest := price_data
if price_data < lowest
lowest := price_data
// Accumulate true range
if i > 0
true_range = calculate_true_range(price_data, i)
true_range_sum += true_range
// Choppiness calculation
range_high_low = highest - lowest
choppiness = 100 * math.log10(true_range_sum / range_high_low) / math.log10(period)
// Trending if choppiness below threshold (typically 61.8)
is_trending = choppiness < 61.8
Component 5: Hilbert Transform Analysis
Phase-based cycle detection and trend identification using mathematical signal processing.
// Hilbert Transform trend detection
calculate_hilbert_signal(price_data, smoothing_period, filter_period) =>
// Smooth the price data
smoothed_price = calculate_moving_average(price_data, smoothing_period)
// Calculate instantaneous phase components
// Simplified implementation for demonstration
instant_phase = smoothed_price
delayed_phase = calculate_moving_average(price_data, filter_period)
// Compare instantaneous vs delayed signals
phase_difference = instant_phase - delayed_phase
// Trending if instantaneous leads delayed
is_trending = phase_difference > 0
Aggregate Regime Determination:
// Combine all five components
regime_calculation() =>
trending_count = 0
total_components = 0
// Test each enabled component
if enable_adf and adf_signal == 1
trending_count += 1
if enable_adf
total_components += 1
// Repeat for all five components...
// Calculate trending proportion
trending_proportion = trending_count / total_components
// Market is trending if proportion above threshold
regime_allows_trading = trending_proportion >= regime_threshold
The system only allows asset positions when the specified percentage of components indicate trending conditions. During choppy or mean-reverting periods, the system automatically positions in USD to preserve capital.
6. Dynamic Portfolio Weighting Framework
Six sophisticated allocation methodologies provide flexibility for different market conditions and risk preferences.
Weighting Method Implementations:
1. Equal Weight Distribution:
// Simple equal allocation
if weighting_mode == "Equal Weight"
weight_per_asset = 1.0 / selection_count
for i = 0 to selection_count - 1
array.push(weights, weight_per_asset)
2. Linear Dominance Scaling:
// Linear scaling based on dominance scores
if weighting_mode == "Linear Dominance"
// Normalize scores to 0-1 range
min_score = array.min(dominance_scores)
max_score = array.max(dominance_scores)
score_range = max_score - min_score
total_weight = 0.0
for i = 0 to selection_count - 1
score = array.get(dominance_scores, i)
normalized = (score - min_score) / score_range
weight = 1.0 + normalized * concentration_factor
array.push(weights, weight)
total_weight += weight
// Normalize to sum to 1.0
for i = 0 to selection_count - 1
current_weight = array.get(weights, i)
array.set(weights, i, current_weight / total_weight)
3. Conviction Score (Exponential):
// Exponential scaling for high conviction
if weighting_mode == "Conviction Score"
// Combine dominance score with DBBMD strength
conviction_scores =
for i = 0 to selection_count - 1
dominance = array.get(dominance_scores, i)
dbbmd_strength = array.get(dbbmd_values, i)
conviction = dominance + (dbbmd_strength - 50) / 25
array.push(conviction_scores, conviction)
// Exponential weighting
total_weight = 0.0
for i = 0 to selection_count - 1
conviction = array.get(conviction_scores, i)
normalized = normalize_score(conviction)
weight = math.pow(1 + normalized, concentration_factor)
array.push(weights, weight)
total_weight += weight
// Final normalization
normalize_weights(weights, total_weight)
Advanced Features:
Minimum Position Constraint: Prevents dust allocations below specified threshold
Concentration Factor: Adjustable parameter controlling weight distribution aggressiveness
Dominance Boost: Extra weight for assets exceeding specified dominance thresholds
Dynamic Rebalancing: Automatic weight recalculation on portfolio changes
7. Intelligent USD Management System
The system treats USD as a competing asset with its own dominance score, enabling sophisticated cash management.
USD Scoring Methodologies:
Smart Competition Mode (Recommended):
f_calculate_smart_usd_dominance() =>
usd_wins = 0
// USD beats assets in downtrends or weak uptrends
for i = 0 to active_count - 1
asset_state = get_asset_state(i)
asset_dbbmd = get_asset_dbbmd(i)
// USD dominates shorts and weak longs
if asset_state == -1 or (asset_state == 1 and asset_dbbmd < long_threshold)
usd_wins += 1
// Calculate Copeland-style score
base_score = usd_wins - (active_count - usd_wins)
// Boost during weak market conditions
qualified_assets = count_qualified_long_assets()
if qualified_assets <= active_count * 0.2
base_score := math.round(base_score * usd_boost_factor)
base_score
Auto Short Count Mode:
// USD dominance based on number of bearish assets
usd_dominance = count_assets_in_short_state()
// Apply boost during low activity
if qualified_long_count <= active_count * 0.2
usd_dominance := usd_dominance * usd_boost_factor
Regime-Based USD Positioning:
When the five-component regime filter indicates unfavorable conditions, the system automatically overrides all asset signals and positions 100% in USD, protecting capital during choppy markets.
8. Multi-Asset Infrastructure & Data Management
The system maintains comprehensive data structures for up to 39 assets simultaneously.
Data Collection Framework:
// Full OHLC data matrices (200 bars depth for performance)
var matrix open_data = matrix.new(39, 200, na)
var matrix high_data = matrix.new(39, 200, na)
var matrix low_data = matrix.new(39, 200, na)
var matrix close_data = matrix.new(39, 200, na)
// Real-time data collection
if barstate.isconfirmed
for i = 0 to active_count - 1
ticker = array.get(assets, i)
= request.security(ticker, timeframe.period,
[open , high , low , close ],
lookahead=barmerge.lookahead_off)
// Store in matrices with proper shifting
matrix.set(open_data, i, 0, nz(o, 0))
matrix.set(high_data, i, 0, nz(h, 0))
matrix.set(low_data, i, 0, nz(l, 0))
matrix.set(close_data, i, 0, nz(c, 0))
Asset Configuration:
The system comes pre-configured with 39 major cryptocurrency pairs across multiple exchanges:
Major Pairs: BTC, ETH, XRP, SOL, DOGE, ADA, etc.
Exchange Coverage: Binance, KuCoin, MEXC for optimal liquidity
Configurable Count: Users can activate 2-39 assets based on preferences
Custom Tickers: All asset selections are user-modifiable
---
⚙️ COMPREHENSIVE CONFIGURATION GUIDE
Portfolio Management Settings
Maximum Portfolio Size (1-10):
Conservative (1-2): High concentration, captures strong trends
Balanced (3-5): Moderate diversification with trend focus
Diversified (6-10): Lower concentration, broader market exposure
Dominance Clarity Threshold (0.1-1.0):
Low (0.1-0.4): Prefers diversification, holds multiple assets frequently
Medium (0.5-0.7): Balanced approach, context-dependent allocation
High (0.8-1.0): Concentration-focused, single asset preference
Signal Generation Parameters
DBBMD Thresholds:
// Standard configuration
primary_long_threshold = 71 // Conservative: 75+, Aggressive: 65-70
primary_short_threshold = 33 // Conservative: 25-30, Aggressive: 35-40
// BB System parameters
bb1_ma_len = 40 // Fast system: 20-50
bb1_sd_len = 65 // Stability: 50-80
bb2_ma_len = 8 // Trend: 60-100
bb2_sd_len = 66 // Sensitivity: 10-20
Risk Management Configuration
Alpha/Beta Filters:
Alpha Threshold: 0.0-2.0% (higher = more selective)
Beta Threshold: 0.5-2.0 (1.0+ for aggressive assets)
Calculation Periods: 20-50 bars (longer = more stable)
Regime Filter Settings:
Trending Threshold: 0.3-0.8 (higher = stricter trend requirements)
Component Lookbacks: 30-100 bars (balance responsiveness vs stability)
Enable/Disable: Individual component control for customization
---
📊 PERFORMANCE TRACKING & VISUALIZATION
Real-Time Dashboard Features
The compact dashboard provides essential information:
Current Holdings: Asset names and allocation percentages
Dominance Score: Current position's relative strength ranking
Active Assets: Qualified long signals vs total asset count
Returns: Total portfolio performance percentage
Maximum Drawdown: Peak-to-trough decline measurement
Trade Count: Total portfolio transitions executed
Regime Status: Current market condition assessment
Comprehensive Ranking Table
The left-side table displays detailed asset analysis:
Ranking Position: Numerical order by dominance score
Asset Symbol: Clean ticker identification with color coding
Dominance Score: Net wins minus losses in head-to-head comparisons
Win-Loss Record: Detailed breakdown of dominance relationships
DBBMD Reading: Current momentum percentage with threshold highlighting
Alpha/Beta Values: Fundamental analysis metrics when filters enabled
Portfolio Weight: Current allocation percentage in signal portfolio
Execution Status: Visual indicator of actual holdings vs signals
Visual Enhancement Features
Color-Coded Assets: 39 distinct colors for easy identification
Regime Background: Red tinting during unfavorable market conditions
Dynamic Equity Curve: Portfolio value plotted with position-based coloring
Status Indicators: Symbols showing execution vs signal states
---
🔍 ADVANCED TECHNICAL FEATURES
State Persistence System
The system maintains asset states across bars to prevent excessive switching:
// State tracking for each asset and ratio combination
var array asset_states = array.new(1560, 0) // 39 * 40 ratios
// State changes only occur on confirmed threshold breaks
if long_crossover and current_state != 1
current_state := 1
array.set(asset_states, asset_index, 1)
else if short_crossover and current_state != -1
current_state := -1
array.set(asset_states, asset_index, -1)
Transaction Cost Integration
Realistic modeling of trading expenses:
// Transaction cost calculation
transaction_fee = 0.4 // Default 0.4% (fees + slippage)
// Applied on portfolio transitions
if should_execute_transition
was_holding_assets = check_current_holdings()
will_hold_assets = check_new_signals()
// Charge fees for meaningful transitions
if transaction_fee > 0 and (was_holding_assets or will_hold_assets)
fee_amount = equity * (transaction_fee / 100)
equity -= fee_amount
total_fees += fee_amount
Dynamic Memory Management
Optimized data structures for performance:
200-Bar History: Sufficient for calculations while maintaining speed
Matrix Operations: Efficient storage and retrieval of multi-asset data
Array Recycling: Memory-conscious data handling for long-running backtests
Conditional Calculations: Skip unnecessary computations during initialization
12H 30 assets portfolio
---
🚨 SYSTEM LIMITATIONS & TESTING STATUS
CURRENT DEVELOPMENT PHASE: ACTIVE TESTING & OPTIMIZATION
This system represents cutting-edge algorithmic trading technology but remains in continuous development. Key considerations:
Known Limitations:
Requires significant computational resources for 39-asset analysis
Performance varies significantly across different market conditions
Complex parameter interactions may require extensive optimization
Slippage and liquidity constraints not fully modeled for all assets
No consideration for market impact in large position sizes
Areas Under Active Development:
Enhanced regime detection algorithms
Improved transaction cost modeling
Additional portfolio weighting methodologies
Machine learning integration for parameter optimization
Cross-timeframe analysis capabilities
---
🔒 ANTI-REPAINTING ARCHITECTURE & LIVE TRADING READINESS
One of the most critical aspects of any trading system is ensuring that signals and calculations are based on confirmed, historical data rather than current bar information that can change throughout the trading session. This system implements comprehensive anti-repainting measures to ensure 100% reliability for live trading .
The Repainting Problem in Trading Systems
Repainting occurs when an indicator uses current, unconfirmed bar data in its calculations, causing:
False Historical Signals: Backtests appear better than reality because calculations change as bars develop
Live Trading Failures: Signals that looked profitable in testing fail when deployed in real markets
Inconsistent Results: Different results when running the same indicator at different times during a trading session
Misleading Performance: Inflated win rates and returns that cannot be replicated in practice
GForge Anti-Repainting Implementation
This system eliminates repainting through multiple technical safeguards:
1. Historical Data Usage for All Calculations
// CRITICAL: All calculations use PREVIOUS bar data (note the offset)
= request.security(ticker, timeframe.period,
[open , high , low , close , close],
lookahead=barmerge.lookahead_off)
// Store confirmed previous bar OHLC for calculations
matrix.set(open_data, i, 0, nz(o1, 0)) // Previous bar open
matrix.set(high_data, i, 0, nz(h1, 0)) // Previous bar high
matrix.set(low_data, i, 0, nz(l1, 0)) // Previous bar low
matrix.set(close_data, i, 0, nz(c1, 0)) // Previous bar close
// Current bar close only for visualization
matrix.set(current_prices, i, 0, nz(c0, 0)) // Live price display
2. Confirmed Bar State Processing
// Only process data when bars are confirmed and closed
if barstate.isconfirmed
// All signal generation and portfolio decisions occur here
// using only historical, unchanging data
// Shift historical data arrays
for i = 0 to active_count - 1
for bar = math.min(data_bars, 199) to 1
// Move confirmed data through historical matrices
old_data = matrix.get(close_data, i, bar - 1)
matrix.set(close_data, i, bar, old_data)
// Process new confirmed bar data
calculate_all_signals_and_dominance()
3. Lookahead Prevention
// Explicit lookahead prevention in all security calls
request.security(ticker, timeframe.period, expression,
lookahead=barmerge.lookahead_off)
// This ensures no future data can influence current calculations
// Essential for maintaining signal integrity across all timeframes
4. State Persistence with Historical Validation
// Asset states only change based on confirmed threshold breaks
// using historical data that cannot change
var array asset_states = array.new(1560, 0)
// State changes use only confirmed, previous bar calculations
if barstate.isconfirmed
=
f_calculate_enhanced_dbbmd(confirmed_price_array, ...)
// Only update states after bar confirmation
if long_crossover_confirmed and current_state != 1
current_state := 1
array.set(asset_states, asset_index, 1)
Live Trading vs. Backtesting Consistency
The system's architecture ensures identical behavior in both environments:
Backtesting Mode:
Uses historical offset data for all calculations
Processes confirmed bars with `barstate.isconfirmed`
Maintains identical signal generation logic
No access to future information
Live Trading Mode:
Uses same historical offset data structure
Waits for bar confirmation before signal updates
Identical mathematical calculations and thresholds
Real-time price display without affecting signals
Technical Implementation Details
Data Collection Timing
// Example of proper data collection timing
if barstate.isconfirmed // Wait for bar to close
// Collect PREVIOUS bar's confirmed OHLC data
for i = 0 to active_count - 1
ticker = array.get(assets, i)
// Get confirmed previous bar data (note offset)
=
request.security(ticker, timeframe.period,
[open , high , low , close , close],
lookahead=barmerge.lookahead_off)
// ALL calculations use prev_* values
// current_close only for real-time display
portfolio_calculations_use_previous_bar_data()
Signal Generation Process
// Signal generation workflow (simplified)
if barstate.isconfirmed and data_bars >= minimum_required_bars
// Step 1: Calculate DBBMD using historical price arrays
for i = 0 to active_count - 1
historical_prices = get_confirmed_price_history(i) // Uses offset data
= calculate_dbbmd(historical_prices)
update_asset_state(i, state)
// Step 2: Build dominance matrix using confirmed data
calculate_dominance_relationships() // All historical data
// Step 3: Generate portfolio signals
new_portfolio = generate_target_portfolio() // Based on confirmed calculations
// Step 4: Compare with previous signals for changes
if portfolio_signals_changed()
execute_portfolio_transition()
Verification Methods for Users
Users can verify the anti-repainting behavior through several methods:
1. Historical Replay Test
Run the indicator on historical data
Note signal timing and portfolio changes
Replay the same period - signals should be identical
No retroactive changes in historical signals
2. Intraday Consistency Check
Load indicator during active trading session
Observe that previous day's signals remain unchanged
Only current day's final bar should show potential signal changes
Refresh indicator - historical signals should be identical
Live Trading Deployment Considerations
Data Quality Assurance
Exchange Connectivity: Ensure reliable data feeds for all 39 assets
Missing Data Handling: System includes safeguards for data gaps
Price Validation: Automatic filtering of obvious price errors
Timeframe Synchronization: All assets synchronized to same bar timing
Performance Impact of Anti-Repainting Measures
The robust anti-repainting implementation requires additional computational resources:
Memory Usage: 200-bar historical data storage for 39 assets
Processing Delay: Signals update only after bar confirmation
Calculation Overhead: Multiple historical data validations
Alert Timing: Slight delay compared to current-bar indicators
However, these trade-offs are essential for reliable live trading performance and accurate backtesting results.
Critical: Equity Curve Anti-Repainting Architecture
The most sophisticated aspect of this system's anti-repainting design is the temporal separation between signal generation and performance calculation . This creates a realistic trading simulation that perfectly matches live trading execution.
The Timing Sequence
// STEP 1: Store what we HELD during the current bar (for performance calc)
if barstate.isconfirmed
// Record positions that were active during this bar
array.clear(held_portfolio)
array.clear(held_weights)
for i = 0 to array.size(execution_portfolio) - 1
array.push(held_portfolio, array.get(execution_portfolio, i))
array.push(held_weights, array.get(execution_weights, i))
// STEP 2: Calculate performance based on what we HELD
portfolio_return = 0.0
for i = 0 to array.size(held_portfolio) - 1
held_asset = array.get(held_portfolio, i)
held_weight = array.get(held_weights, i)
// Performance from current_price vs reference_price
// This is what we ACTUALLY earned during this bar
if held_asset != "USD"
current_price = get_current_price(held_asset) // End of bar
reference_price = get_reference_price(held_asset) // Start of bar
asset_return = (current_price - reference_price) / reference_price
portfolio_return += asset_return * held_weight
// STEP 3: Apply return to equity (realistic timing)
equity := equity * (1 + portfolio_return)
// STEP 4: Generate NEW signals for NEXT period (using confirmed data)
= f_generate_target_portfolio()
// STEP 5: Execute transitions if signals changed
if signal_changed
// Update execution_portfolio for NEXT bar
array.clear(execution_portfolio)
array.clear(execution_weights)
for i = 0 to array.size(new_signal_portfolio) - 1
array.push(execution_portfolio, array.get(new_signal_portfolio, i))
array.push(execution_weights, array.get(new_signal_weights, i))
Why This Prevents Equity Curve Repainting
Performance Attribution: Returns are calculated based on positions that were **actually held** during each bar, not future signals
Signal Timing: New signals are generated **after** performance calculation, affecting only **future** bars
Realistic Execution: Mimics real trading where you earn returns on current positions while planning future moves
No Retroactive Changes: Once a bar closes, its performance contribution to equity is permanent and unchangeable
The One-Bar Offset Mechanism
This system implements a critical one-bar timing offset:
// Bar N: Performance Calculation
// ================================
// 1. Calculate returns on positions held during Bar N
// 2. Update equity based on actual holdings during Bar N
// 3. Plot equity point for Bar N (based on what we HELD)
// Bar N: Signal Generation
// ========================
// 4. Generate signals for Bar N+1 (using confirmed Bar N data)
// 5. Send alerts for what will be held during Bar N+1
// 6. Update execution_portfolio for Bar N+1
// Bar N+1: The Cycle Continues
// =============================
// 1. Performance calculated on positions from Bar N signals
// 2. New signals generated for Bar N+2
Alert System Timing
The alert system reflects this sophisticated timing:
Transaction Cost Realism
Even transaction costs follow realistic timing:
// Fees applied when transitioning between different portfolios
if should_execute_transition
// Charge fees BEFORE taking new positions (realistic timing)
if transaction_fee > 0
fee_amount = equity * (transaction_fee / 100)
equity -= fee_amount // Immediate cost impact
total_fees += fee_amount
// THEN update to new portfolio
update_execution_portfolio(new_signals)
transitions += 1
// Fees reduce equity immediately, affecting all future calculations
// This matches real trading where fees are deducted upon execution
LIVE TRADING CERTIFICATION:
This system has been specifically designed and tested for live trading deployment. The comprehensive anti-repainting measures ensure that:
Backtesting results accurately represent real trading potential
Signals are generated using only confirmed, historical data
No retroactive changes can occur to previously generated signals
Portfolio transitions are based on reliable, unchanging calculations
Performance metrics reflect realistic trading outcomes including proper timing
Users can deploy this system with confidence that live trading results will closely match backtesting performance, subject to normal market execution factors such as slippage and liquidity.
---
⚡ ALERT SYSTEM & AUTOMATION
The system provides comprehensive alerting for automation and monitoring:
Available Alert Conditions
Portfolio Signal Change: Triggered when new portfolio composition is generated
Regime Override Active: Alerts when market regime forces USD positioning
Individual Asset Signals: Can be configured for specific asset transitions
Performance Thresholds: Drawdown or return-based notifications
---
📈 BACKTESTING & PERFORMANCE ANALYSIS
8 Comprehensive Metrics Tracking
The system maintains detailed performance statistics:
Equity Curve: Real-time portfolio value progression
Returns Calculation: Total and annualized performance metrics
Drawdown Analysis: Peak-to-trough decline measurements
Transaction Counting: Portfolio transition frequency
Fee Tracking: Cumulative transaction cost impact
Win Rate Analysis: Success rate of position changes
Backtesting Configuration
// Backtesting parameters
initial_capital = 10000.0 // Starting capital
use_custom_start = true // Enable specific start date
custom_start = timestamp("2023-09-01") // Backtest beginning
transaction_fee = 0.4 // Combined fees and slippage %
// Performance calculation
total_return = (equity - initial_capital) / initial_capital * 100
current_drawdown = (peak_equity - equity) / peak_equity * 100
---
🔧 TROUBLESHOOTING & OPTIMIZATION
Common Configuration Issues
Insufficient Data: Ensure 100+ bars available before start date
[*} Not Compiling: Go on an asset's price chart with 2 or 3 years of data to
make the system compile or just simply reapply the indicator again
Too Many Assets: Reduce active count if experiencing timeouts
Regime Filter Too Strict: Lower trending threshold if always in USD
Excessive Switching: Increase MD multiplier or adjust thresholds
---
💡 USER FEEDBACK & ENHANCEMENT REQUESTS
The continuous evolution of this system depends heavily on user experience and community feedback. Your insights will help motivate me for new improvements and new feature developments.
---
⚖️ FINAL COMPREHENSIVE RISK DISCLAIMER
TRADING INVOLVES SUBSTANTIAL RISK OF LOSS
This indicator is a sophisticated analytical tool designed for educational and research purposes. Important warnings and considerations:
System Limitations:
No algorithmic system can guarantee profitable outcomes
Complex systems may fail in unexpected ways during extreme market events
Historical backtesting does not account for all real-world trading challenges
Slippage, liquidity constraints, and market impact can significantly affect results
System parameters require careful optimization and ongoing monitoring
The creator and distributor of this indicator assume no liability for any financial losses, system failures, or adverse outcomes resulting from its use. This tool is provided "as is" without any warranties, express or implied.
By using this indicator, you acknowledge that you have read, understood, and agreed to assume all risks associated with algorithmic trading and cryptocurrency investments.
Degen Screener – ALTs vs. BTCDegen Screener – ALTs vs. BTC
🛠️ What This Script Does:
This multi-asset screener monitors up to 10 cryptocurrencies and compares their RSI strength relative to Bitcoin (BTC) — acting like BTC is the "north star." It's perfect for catching early shifts in momentum across the crypto market.
🎨 Color Logic:
RSI Column:
RSI < 30 → Green (oversold)
RSI > 70 → Red (overbought)
In between → Gray
Relative RSI Column:
0 → Green (stronger than BTC)
< 0 → Red (weaker than BTC)
Trend Column:
🤑 → Bullish shift (green background)
🖕 → Bearish shift (red background)
🔔 Alert Conditions:
Alerts fire when all three of these are true:
RSI is below 30 (oversold)
The asset is stronger than BTC
Momentum is turning bullish (🤑)
Perfect for spotting early reversals in oversold altcoins.
✅ How to Use:
Add the script to any chart (doesn’t matter which asset)
Customize the list of up to 10 symbols
Set your timeframe
Enable the alert condition: Relative RSI Signal
💡 Notes:
Script runs on whatever chart you’re on, but it pulls data from the 10 assets you select on your indicator.
⚠️ Disclaimer:
This tool is for educational and informational purposes only. It is not financial advice. Always do your own research.

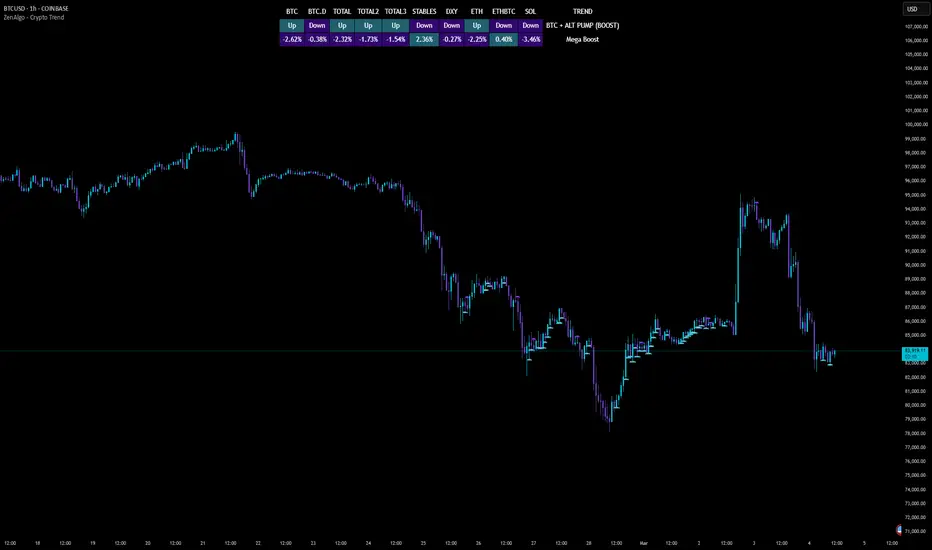
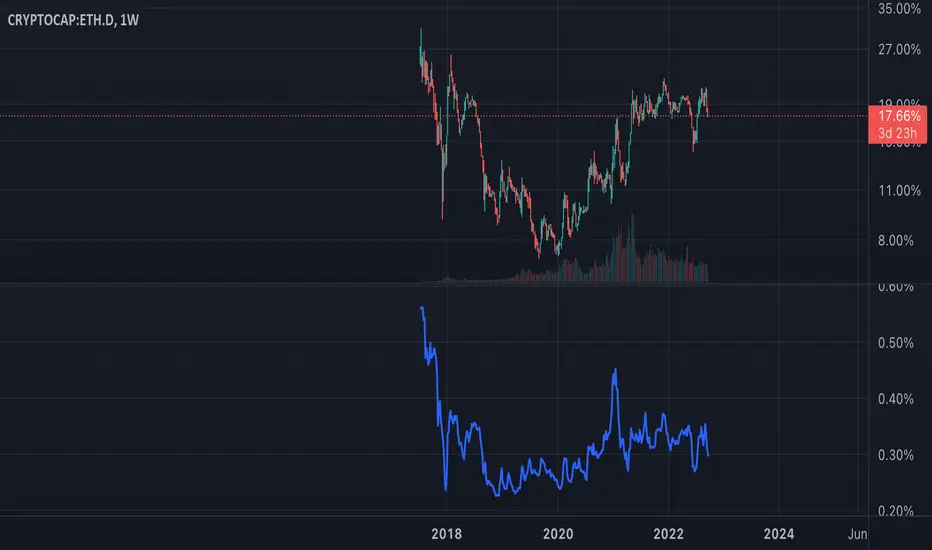
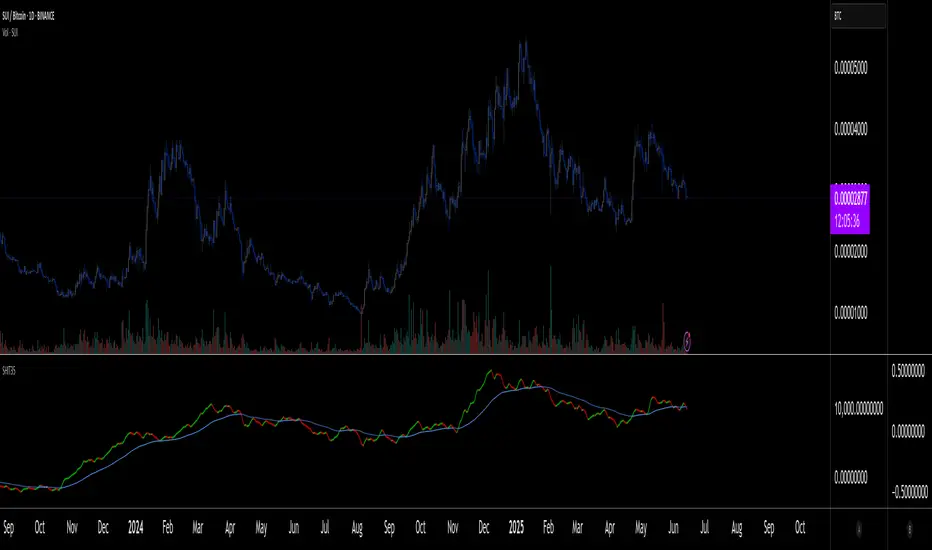
ZenAlgo - Crypto TrendThe ZenAlgo - Crypto Trend indicator is a unique tool for analyzing cryptocurrency market trends, combining data from multiple sources such as BTC , ETH , market caps, dominance metrics, and the DXY index . Unlike standalone indicators, it integrates these data points to deliver actionable insights on macro and micro market movements, helping traders better navigate complex market conditions.
Features
Multi-Asset Trend Analysis: Monitors trends across BTC , ETH , USDT dominance , DXY , SOL , ETHBTC and total market caps ( TOTAL , TOTAL2 , TOTAL3 ), providing a holistic market view.
Dynamic Labels: Real-time market conditions are summarized with labels such as "FIRE SELL," "BTC UP," or "ALT PUMP" for instant clarity.
Customizable Display: Options for dark mode, text size, and table position allow traders to personalize their experience.
Market Sentiment Table: Summarizes trends and percentage changes for multiple assets in a structured, easy-to-read table.
Composite Signals: Identifies unique states like "Mega Boost" or "Outflow" by analyzing the interplay of market trends.
Enhanced Heikin Ashi Analysis: Applies Heikin Ashi trends in a broader context, combining them with other metrics to overcome standalone limitations.
ZenAlgo Theme: A visually distinct and professional theme for enhanced usability.
Added Value: Why Is This Indicator Original/Why Shall You Pay for This Indicator?
The ZenAlgo - Crypto Trend indicator transcends the limitations of free tools in several ways:
Integrated Insights: While Heikin Ashi is freely available, this indicator applies it in tandem with market dominance, total market caps, and macroeconomic indicators like the DXY . This integration creates composite signals (e.g., "Mega Boost," "Defi Mega Boost") that standalone Heikin Ashi cannot provide.
Advanced Contextualization: Free Heikin Ashi indicators lack contextual data about dominance shifts, altcoin performance, and macroeconomic trends. Our indicator integrates these elements to give a broader market perspective.
Time-Saving: Instead of switching between multiple indicators, ZenAlgo - Crypto Trend combines them in one cohesive tool, offering a comprehensive market overview in a single glance.
Custom Features: Unlike generic Heikin Ashi indicators, this tool includes dynamic labels and a market sentiment table that summarize trends and provide immediate insights.
How It Works
1. Heikin Ashi Trend Detection
Calculates smoothed Heikin Ashi trends for BTC , ETH , USDT dominance , DXY , and total market caps ( TOTAL , TOTAL2 , TOTAL3 ).
Functionality: Heikin Ashi values are derived from the weighted average of open, high, low, and close prices. The "open" averages the previous bar's open and close, while the "close" averages the current bar's open, high, low, and close. A trend is assigned as Up (+1) or Down (-1) based on whether the close exceeds the open.
2. Market Metrics Analysis
Tracks daily percentage changes and trends for key metrics like BTC dominance and total market caps.
Outputs: Displays trends (Up/Down) and percentage changes for each asset, helping assess market strength and sentiment.
3. Composite Signal Generation
Combines individual asset trends to define broader market states such as "Mega Boost" or "Outflow."
Logic: Signals are triggered by predefined conditions, e.g., "Mega Boost" occurs when DXY trends down, market caps ( TOTAL , TOTAL2 , TOTAL3 ) trend up, and BTC dominance trends down.
4. Dynamic Labels and Sentiment Table
Displays real-time labels (e.g., "FIRE SELL," "BTC + ALT PUMP") directly on the chart for actionable insights.
A market sentiment table summarizes trends and percentage changes, with customizable display options (position, text size, theme).
Usage Examples
Spotting Bullish Momentum: Use "BTC + ALT PUMP" signals to identify synchronized bullish trends in BTC and altcoins.
Avoiding Bearish Trends: React to "CRYPTO DOWN" or "FIRE SELL" signals to minimize exposure during downturns.
Evaluating Altcoin Opportunities: Identify "ALT PUMP" or "ALTS DUMP" signals to time entries and exits in altcoin markets.
Tracking Dominance Shifts: Monitor "BTC.D UP" or "BTC.D DOWN" trends to assess shifts in market dominance between BTC and altcoins.
Macro Market Awareness: Use "Mega Boost" or "Mega Outflow" states to align with macroeconomic trends, such as dollar strength or weakness.
Seasonal Trends: Observe "ETH PUMP" or "BTC DOWN + ALT PUMP" states to understand specific altcoin or BTC-led market cycles.
Settings
ZenAlgo Theme: Enable a custom ZenAlgo visual style for improved clarity.
Table Text Size: Adjust text size (options: tiny, small, normal, large, huge) for better visibility.
Dark Mode: Toggle dark mode for improved viewing in low-light environments.
Table Position: Choose table placement (e.g., Top Left, Bottom Center) based on your preferences.
Important Notes
Synthetic and Lagging Nature of Heikin Ashi: Heikin Ashi values are synthetic and inherently lagging. They provide smoothed trends but do not represent precise entry or exit points. This indicator does not produce buy or sell signals.
Limitations in Low-Volume Markets: The indicator may underperform in low-liquidity markets or during periods of high volatility, where data discrepancies can distort trends.
Trend Reversals in Choppy Markets: In sideways or choppy markets, the composite signals may lag behind sudden reversals, potentially resulting in delayed recognition of trend changes.
False Positives During Macro News Events: Abrupt macroeconomic news or policy changes can cause the indicator to emit signals (e.g., "Mega Boost") that may not align with sustained market movements.
Dominance Metrics Sensitivity: Heavy reliance on BTC.D or TOTAL3 can sometimes result in misleading insights when these metrics are influenced by atypical events, such as large-scale liquidations or isolated token movements.
Use in Conjunction with Other Tools: While powerful, this indicator should be combined with other technical and fundamental analysis tools for a comprehensive trading strategy.
No Guaranteed Results: Trading involves risk. This tool is designed to support decision-making, not to guarantee trading success.
skX FVG Enhanced Indicator [1m,5m] skX FVG Indicator
Fair Value Gaps (FVGs) are particularly effective for scalping altcoins due to their tendency to fill price inefficiencies. These gaps occur during strong momentum moves where price leaves an 'empty' zone that often acts as a magnet for price to return to. In the volatile alt market, these gaps frequently present high-probability scalping opportunities.
Why FVGs Work in Alts:
• Quick price movements create more gaps
• Higher volatility increases gap frequency
• Institutional algorithms tend to fill these inefficiencies
• Works especially well in lower timeframes (1-5m)
Key Features:
✓ Automatic FVG detection with size filtering
✓ Smart timeframe adaptation (1m, 5m, Custom settings)
✓ Trend detection using 8/21/55 EMA system
✓ Dynamic TP/SL levels based on ATR
✓ Risk:Reward ratio automation
✓ Visual signals that stick to price levels
✓ Clear information display panel
✓ Built-in alerts system
How to Use:
1. Select your preferred timeframe (1m or 5m recommended)
2. Watch for triangle signals (▲ bullish, ▼ bearish)
3. Confirm with trend direction (shown in panel)
4. Use provided TP/SL levels for trade management
5. Set alerts for new FVG formations
Settings Explained:
• Auto Mode: Adjusts gap size to timeframe
• Custom Gap Size: Manual gap size control
• ATR Period: Volatility measurement window
• ATR Multiplier: Stop loss distance
• Risk:Reward: Take profit ratio
Best Practices:
• Use in conjunction with support/resistance
• Trade in direction of main trend
• Monitor higher timeframe structure
• Start with recommended settings
• Backtest before live trading
Note: This indicator works best in volatile market conditions and should be used as part of a complete trading strategy.
Good luck trading!
-skX

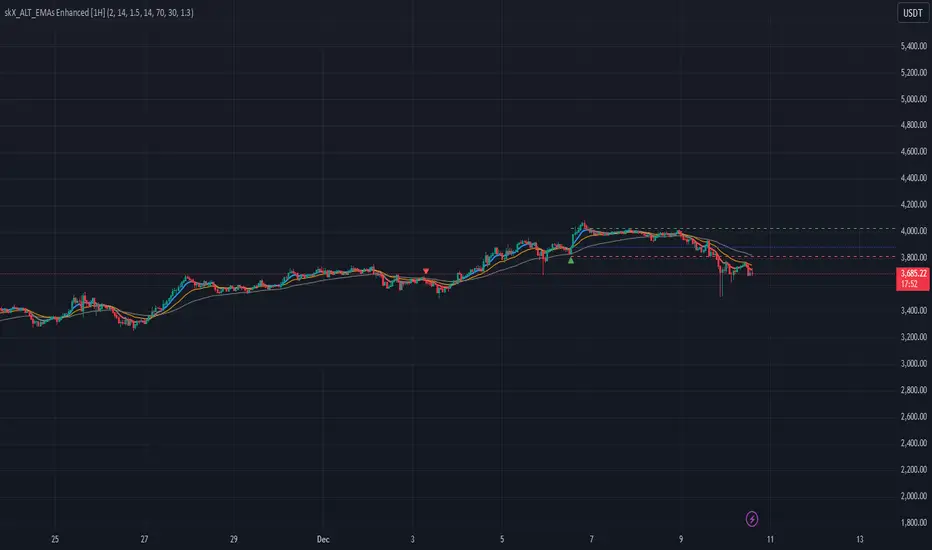
skX_ALT_EMAs Enhanced [1H]An advanced EMA crossover system with dynamic ATR-based risk management, designed
for altcoin trading on the 1H timeframe. Combines trend following with momentum
and volume filters.
CORE COMPONENTS:
1. EMA System:
- 8 EMA (Fast): Primary signal line
- 21 EMA (Medium): Crossover reference
- 55 EMA (Slow): Trend filter
2. Multiple Filters:
- RSI (14): Prevents overbought/oversold entries
- Volume: Optional volume confirmation
- Trend Strength: EMA alignment check
3. Risk Management:
- Dynamic SL: Based on ATR (Average True Range)
- Dynamic TP: Risk:Reward based calculation
- Position entry markers
ENTRY CONDITIONS:
LONG:
- 8 EMA crosses above 21 EMA
- All EMAs aligned bullish (8 > 21 > 55)
- Price above 8 EMA
- RSI below 70 (not overbought)
- Optional: Volume > 1.5x average
SHORT:
- 8 EMA crosses below 21 EMA
- All EMAs aligned bearish (8 < 21 < 55)
- Price below 8 EMA
- RSI above 30 (not oversold)
- Optional: Volume > 1.5x average
RECOMMENDED SETTINGS:
- Timeframe: 1H
- ATR Period: 14
- ATR Multiplier: 1.5
- Risk:Reward: 2.0
- RSI Filter: ON
- Volume Filter: Optional (ON for low liquidity pairs)
VISUAL SIGNALS:
- Green Triangle: Long entry
- Red Triangle: Short entry
- Blue Line: Entry price
- Red Line: Stop Loss
- Green Line: Take Profit
- EMA Colors: Blue/Red for trend direction
ETH Dominance Excluding BTCThe indicator shows when ETH is undervalued or overvalued with regard to other alts. BTC capitalization is not taken into account.
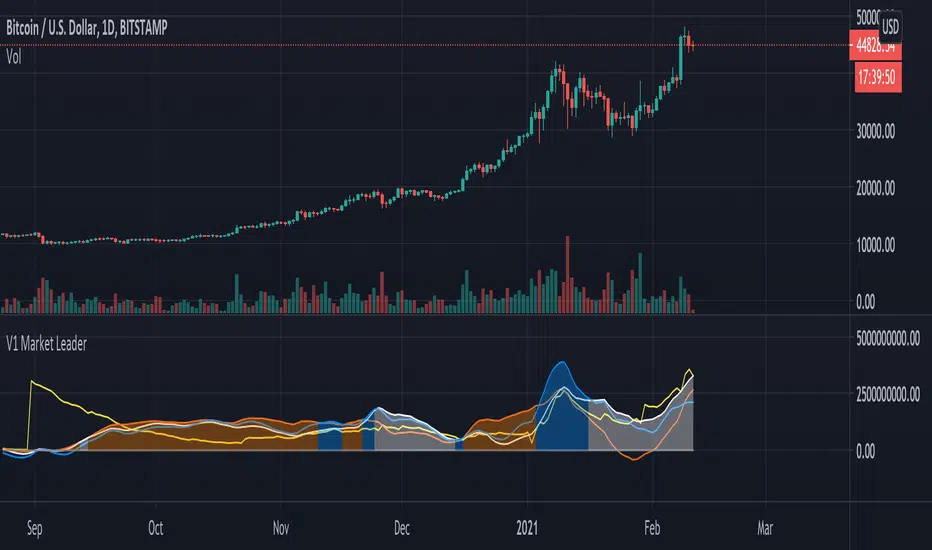
V1 Market Leader
This script aims to identify who the current market leader is between 3 participants, BTC , ETH and ALTS & ETH combined.
Colour coded so you can identify what is what in the settings - Default setting are: BTC = Orange, ETH = Blue and ALTS & ETH = White.
There is also a line to identify the market movement in relation to amount of Tether currently in circulation - Default setting is: Tether = Yellow.
This script can be used on any timeframe but I recommend 12H or greater.
Lines can be turned on and off in settings for cleaner look.
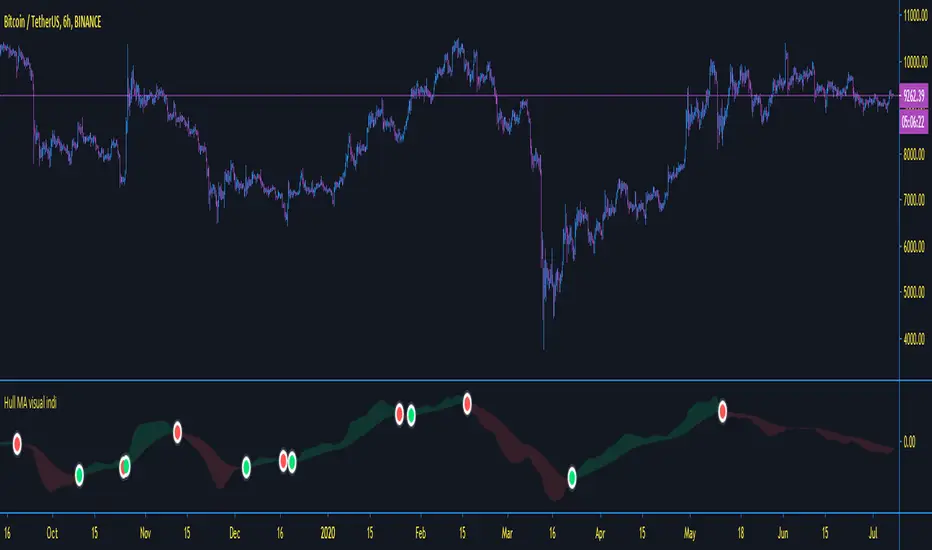
TBT ForecasterThe TBT Forecaster is a visual representation of the "weather forecast" for the crypto market, mainly Bitcoin and ALT coins.
Purpose:
The reason behind creating this indicator is to help give crypto traders a sense of what to expect in crypto currency markets. In general, crypto markets (ALT coins) are extremely dependent on the price action and sentiment of Bitcoin. By knowing what to expect for both BTC and ALT markets, crypto traders will have an edge on other traders by:
knowing when it's a good time to run BTC or stable coin pairs for bots on 3Commas
knowing when the ALT market is in a Bullish or Bearish mood
knowing if we're in a true ALT season or not
knowing if they should be focusing more on active trading on the BTC or stable coin market
Time Frame:
The TBT Forecaster can be viewed on any time frame, but it was originally designed to work off of the 6-hour time frame. Note that faster (higher) time frames can make the tool somewhat unreliable since faster (higher) time frames are subject to more sudden, volatile movements compared to the 6-hour or Daily time frames. To help users of the TBT Forecaster keep a healthy perspective, the indicator can be set to "same as symbol" (the indicator will adapt to any time frame you use) or "6 hours" (the original and intended time frame).
Metrics:
The two lines of the indicator represent Bitcoin (top) and ALT coins (below). The TBO Forecaster uses information derived from the price of Bitcoin, Bitcoin price volatility, moving averages, ATR (Average True Range), Bitcoin Dominance, and the ALT coin indexes (TOTAL2 and OTHERS). All of these metrics are combined and weighted into a system that quantifies the market sentiment for BTC and ALTs.
Sentiment:
The TBT Forecaster shows a gradient of market sentiment, from Bearish to Bullish. These market sentiment labels consist of a variety of different metrics that have to do with volume, price action, and several indices. The full gradient of sentiment is:
Bearish
Weak Bearish (ALT line only)
Neutral
Weak Bullish
Bullish
Realistic Expectations:
Note that it is impossible and unrealistic for the ALTs line to represent every single ALT coin/token/chart/symbol on every exchange. In my experience, there are always good charts to trade no matter what Bitcoin is doing. However, if we as traders know that ALTs are Bearish, then we can focus our efforts on trading Bitcoin (or just staying out of the ALT market until conditions change).
Use the link below to obtain access to this indicator

Moving Average Indicator - TradingSargentThis indicator is based on Hull Moving averages, and works best for signals on the 6 hour and above timeframe with standard settings - as always, fully adjustable from settings...
simple to use as another confirmation on your strategies -
Green = buy
red = sell
DM for access rules
Bayes Probability Index by DGTWhat is Probability?
It is a measure for calculating the chances or the possibilities of the occurrence of a random event. In simple words, it calculates the chance of the favorable outcome amongst the entire possible outcomes. Mathematically, if you want to answer what is probability, it is defined as the ratio of the number of favorable events to the total number of possible outcomes of a random events.
Is this enough? May be or may be not
Let’s consider an example,
A simple probability question may ask: "What is the probability of Amazon.com's stock price falling?"
How about if we extend our question a step further by asking: "What is the probability of AMZN stock price falling given that the Dow Jones Industrial Average (DJIA) index fell earlier?"
Now we are ready to consider conditional probability and Bayes' Theorem is where we could find answer to this question
Bayes' Theorem
Bayes' theorem, named after 18th-century British mathematician Thomas Bayes, is a mathematical formula for determining conditional probability. Conditional probability is the likelihood of an outcome occurring, based on prior knowledge of conditions or another related event occurring. Bayes' theorem provides a way to revise existing predictions or theories (update probabilities) given new or additional evidence. Bayes' theorem thus gives the probability of an event based on new information that is, or may be related, to that event
Formula For Bayes' Theorem
P(A|B) = P(B∣A) * P(A) /P(B)
= P(B∣A) * P(A) / (P(B∣A)* P(A) + P(B∣A’)* P(A’) )
where
A and B are events and P is probability
P(A|B) is the posterior probability, the probability of A after taking into account B
P(A) is the prior probability, the probability of A belief
P(A’) is the prior probability, the probability of A disbelief : P(A’)=1- P(A)
P(B) is the prior probability, the probability of B belief
P(B∣A) is the conditional probability or likelihood, the degree of belief in B given that proposition of A belief (A true)
P(B∣A’) is the conditional probability or likelihood, the degree of belief in B given that proposition of A disbelief (A false)
Bitcoin was the first-ever cryptocurrency, designed by Satoshi Nakamoto. In its likeness, all other cryptocurrencies were then created. The relationship between Bitcoin and altcoins remains something crypto analyst watch closely. This study aims to display the likelihood of bullish movement for ALTS-USDT pairs taking into consideration of bullish move probability of BTC-USDT pair
What to look for:
Percentage Value of the Conditional Probability and/or Simple Probability. When value is above %50 than bullish move is more probable, conversely when the value is below %50 bearish move is more likely
Limitations : Conditional Probability Line will be shown for daily time frame only, Simply Probability Line would be available for all time frames
Conditional Probability is calculated with the condition of BTC-USDT pair so using Conditional Probability is suggested with ALTS-USDT pairs.
Indicators aim to generate a potential signal/indication of an upcoming opportunity, but, the Indicators themselves do not guarantee the future movement of a given financial instrument, and are most useful when used in combination with other techniques.
Trading success is all about following your trading strategy and the indicators should fit within your trading strategy, and not to be traded upon solely
Disclaimer : The script is for informational and educational purposes only. Use of the script does not constitutes professional and/or financial advice. You alone the sole responsibility of evaluating the script output and risks associated with the use of the script. In exchange for using the script, you agree not to hold dgtrd TradingView user liable for any possible claim for damages arising from any decision you make based on use of the script

Coinbase ALT/USD IndexA simple ALT/USD pair index of all the altcoins currently trading on Coinbase.

Crypto Indicators #u9tusA set of low timeframe (LTF), medium timeframe (MTF), and high timeframe (HTF) indicators for use in crypto currencies / bitcoin.
Traditionally the 10, 20, 50, 100, and 200 SMAs are used in TA. With cryptos, I've found that the 8 EMA, 21, 55, and 128 SMAs backtest better, while no change in length was necessary for the 200. I wanted to combine all these into one indicator to easily add them to a chart layout, hence this script.
You can customize the length of each MA to your liking in the settings, or accept the defaults.
LTF Indicators:
8 EMA in blue hues, medium line stroke.
MTF Indicators:
21, 55 SMA in purple hues, medium line stroke.
HTF Indicators:
128, 200 SMA in yellow hues, thick line stroke.
Defaults are for daily timeframes and lower; suggest changing up the intervals for weekly and monthly to:
21 -> 30
55 -> 50
128 -> 100
$BTC, $ETH, #ALTS
twitter.com
(c) @jhaurawachsman 20190515

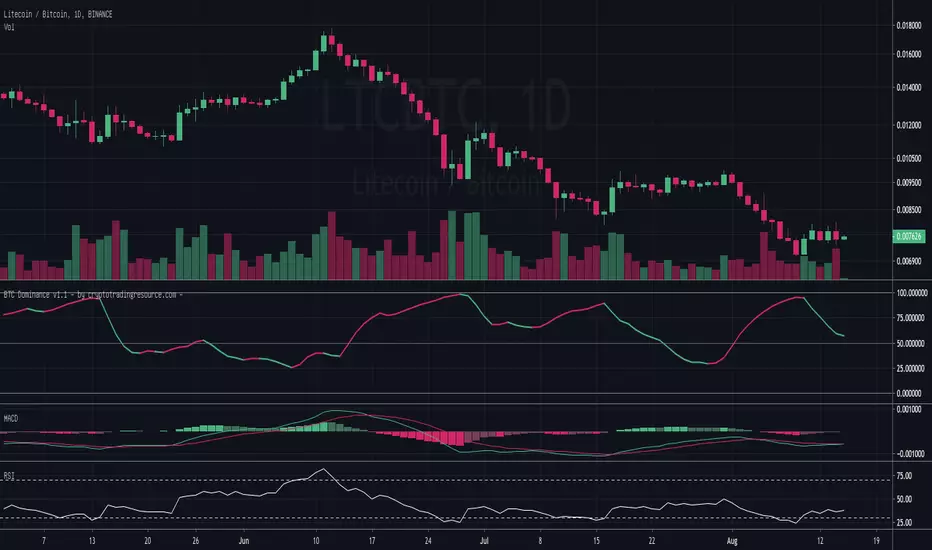
BTC Dominance - by @cryptomrdavis -Simple tool for your trading assets. Check the dominance from BTC agains other Alts and trade safe.
You can find a short description on the chart above.
Website coming soon: cryptotradingresource.com
Happy trading
+++ use this tool on your own risk. i'm not responsible for your loses. DYOR +++
____________________________________________________________________________
BTC: 1GVRDK3HHr9CKM5SF2CGpCNXFuavB3L4j9
ETH: 0x7b825fa752b9926D3E8397cDb1d9E5473D074646
XLM: GAXUQJSW55C7MAC4GI26NZUGIKSHFDVFRFKZCXPLMPY4HCADSDT55XK6
BCH: qz57n04ud6mn42u00aymqkku8tfh0lk4jv9c28mjvv
SHIT35 Alt Index (ROC or Volume) [LucF]SHIT35 is an index of 35 Binance alt/BTC pairs. It provides traders with a more reliable read of BTC pairs price movement than the often uncorrelated USD market cap standard.
Because it must read data coming from 35 markets, SHIT35 is painfully slow and should be kept hidden most of the time. Its features will hopefully seduce traders in using it nonetheless for market analysis.
Features
The Index can be calculated using 4 different modes:
1. Total of instant rate of change for all 35 markets ,
2. Cumulative total of ROCs,
3. Average of ROCs,
4. Plus/Minus volume (an aggregate OBV, if you will).
Select only one of the methods at a time to prevent confusion between modes.
An option allows showing the correlation between the Index as it is configured, and another instrument (CRYPTOCAP:TOTAL2 by default).
Markers can be used to identify abnormal movements in the Index. They are generated using Index exits from Bollinger bands.
The chart shows the Index with, from top to bottom, the default mode with BTC pairs, with USDT pairs, then mode 2 and 4 for BTC pairs.
Index Components
The Index is not weighed. The 35 instruments composing the index all have equivalents in the USDT quote currency on Binance, so you can easily change to those pairs using the Settings. Choosing another exchange or quote currency will require modifications to the list of instruments in the indicator’s code, since if one of the markets cannot be found, the indicator will not work. If the instrument exists but has no history for some bars, zero values will be used for them.
Watchlists
I have created a watchlist for the 35 markets in each of the BTC and USDT quote currencies. To import the watchlists, save the text you’ll find at these links in a file named the way you want your watchlist to be named and import them using the “Import Watchlist…” function.
BTC Watchlist: pastebin.com
USDT Watchlist: pastebin.com
Alerts
You can define alerts on any combination of markers you configure. After defining the markers you want the alert to trigger on, make sure you are on the interval you want the alert to be monitoring at, then create the alert, select the indicator, use the default alert condition and choose your triggering window (usually “Once Per Bar Close”). Once the alert is created, you can change the indicator's inputs with no effect on the alert.
[THE MECHANIC] : Buy small and continuously, profit trailThis script is entirely my own original work.
The script is intended for USDT crypto trades. It's hypothesis is that Alts usually go where BTC goes. So, this script considers indicators on a USDT paired ALT, and simultaneously considers BTC's USD movement to make a buy decision. The exact combination of indicators will not be disclosed.
It does not intend to seek the bottom AT ALL. It intends to buy early in upswings. Using profit trailing on a tool such as Gunbot, consistent profits of 2% to 5% is possible. Hourly charts or longer are recommended.
A stop loss is an absolute necessity, but can be set quite tightly because of the stated hypothesis.
Script access is controlled only because it is my terms of use that users provide feedback on their experience and make recommendations for improvement.

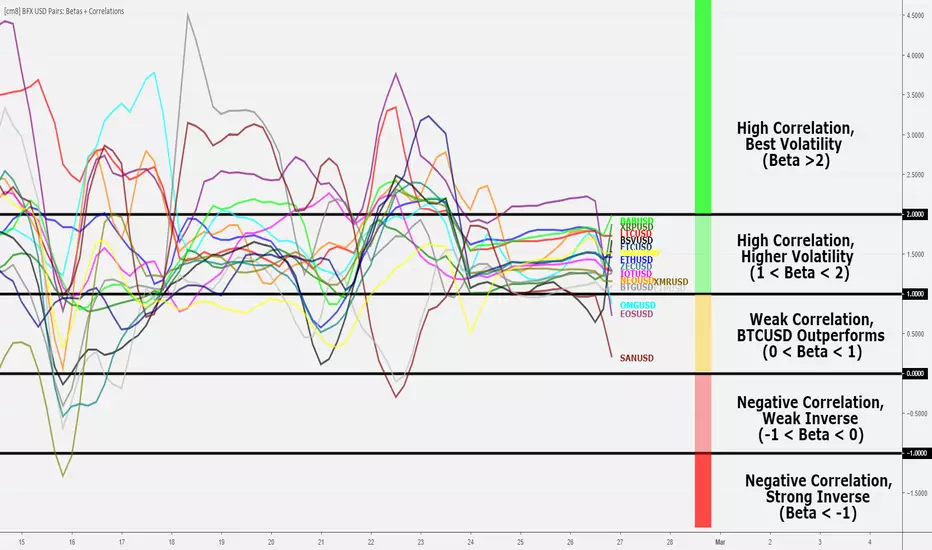
Bitfinex USD Pairs: Betas and Correlations [checkm8]Hello and welcome to my beta and correlation indicator!
This indicator is meant to be used to assess trading alternatives to BTCUSD on Bitfinex, examining alt-USD pairs that can be traded on margin. This list is as follows:
ETHUSD
LTCUSD
EOSUSD
NEOUSD
OMGUSD
XRPUSD
IOTUSD
BCHUSD
SANUSD
ETPUSD
ETCUSD
XMRUSD
ZECUSD
DSHUSD
Before dwelling further on the script, let's revisit the definitions of beta and correlation:
Beta is a statistical measure of a %-change in an asset relative to a 1% change in a benchmark. In our case - this is BTCUSD. For example, if the beta is 1.5, it means that the particular asset moves 1.5% in the same direction as the 1% change of the benchmark. If the beta is negative, the asset is moving in opposite direction of the benchmark. Note: beta is not confined to any range.
Correlation is a statistical measure of the relationship between two assets, from a range of +1 to -1, where a score of +1 implies perfect positive correlation (prices move in the same direction), -1 implies perfect negative correlation (inverse relationship), and 0 implies no relationship in price changes.
For the calculations, BITFINEX:BTCUSD is used as the benchmark.
Through the script's settings:
You can select whether to plot betas or the correlations
You can select the desired length to be used in the measure of beta and correlations
You can enable smoothing for less choppy results. This is accompanied by options to modify the smoothing length and the smoothing method, where SMA, EMA, RMA, and WMA are available.
You can enable and disable individual alt pairs from being displayed (ie. if you do not want LTCUSD plotted, you can turn it off)
Below is an example of the correlation setting.
I would recommend using a smoothing input of 3-6, on SMA, and the 4-hour timeframe for good results. I use this indicator for help in deciding what alt pairs to trade on a particular day, where you will want to trade alts with the highest correlations. Note: be weary of less liquid markets, such as ETP and SAN.
Also note: the labels shown in the snapshot are for presentation purposes only. You can enable Indicator Labels by right clicking the oscillator -> "Price Scale" -> "Indicator Labels".
Please let me know if you have any questions, suggestions, or concerns.
Happy trading!
For additional information as to why you should be using this indicator and trading alts instead of BTCUSD, please refer to my study:
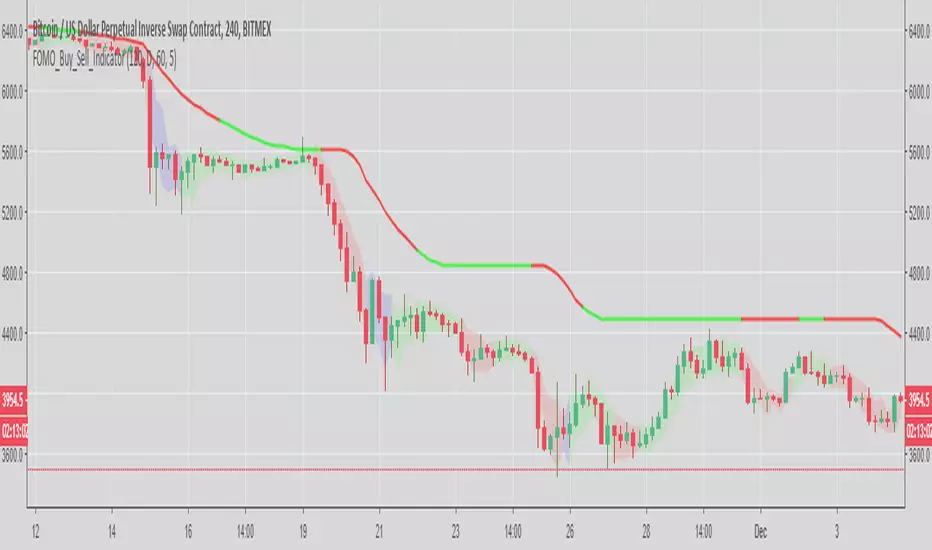
FOMO_Buy_Sell_IndicatorBuy and sell indicator that fits everyone's needs.
For noobs - You can use it even if you are not TA friendly. Green is buy and Red is sell.
For pros - It helps you second guess your ins and outs.
PM to gain access, please. Thanks
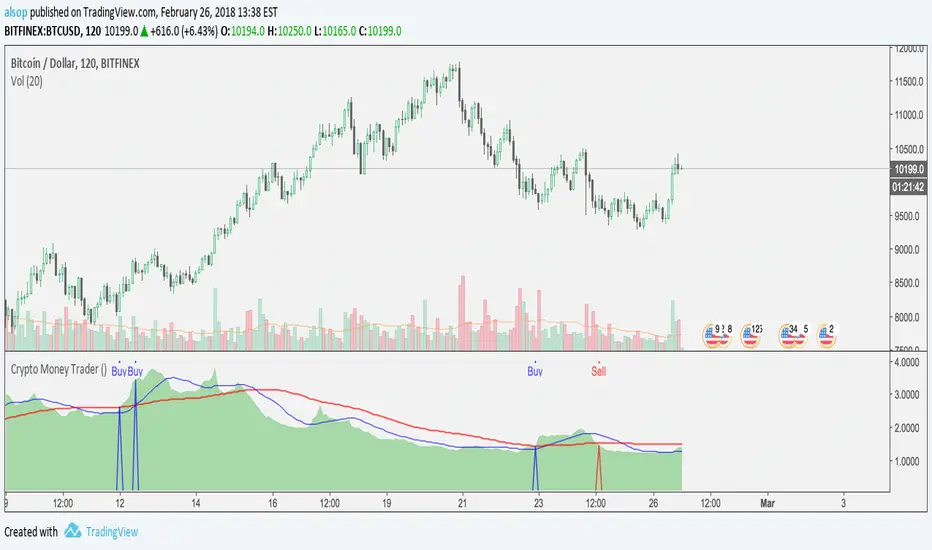
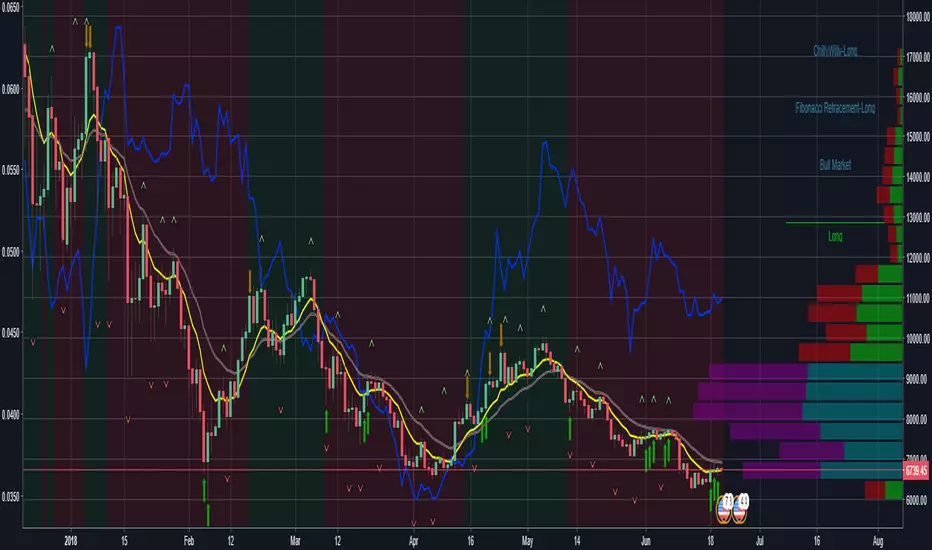
Crypto Money Trader - Indicator for Buy and Sell SignalsThis is it... the one that many have been waiting for.
We have taken everything we have learned from the Crypto Money Index and Crypto Money Bot and combined it into the best indicator possible for trading crypto currencies. This version also includes logic for shorts (sell) and another criteria for longs (buys).
The code is cleaner as well so there is less signal noise and more precise entries.
Before we released this script, we did backtesting on all the current supported USD pairs for optimal results.
Here is one set of results for BTC on 2 hour chats using $5,000 starting balance, 1 trade at once maximum, and 1 contract size:
www.cryptosignalsbot.com
Net Profit: $25,582, 511.64%
Total Trades: 17
Percent Profitable: 70.59%
Profit Factor: 4.304
Maximum Downdraw: $6,629
AvgTrade: $1,504.82, 30.1%
These results get even crazier when you get into settings where you can have 4 trades at once - beyond 700% return... crazy...
The indicator also includes alerts that you can setup so you are aware when a Buy or Sell signal is triggered. Just set an indicator alert for the Trigger Buy or Trigger Sell greater then a value of 0 and you will always know when it is time to look at the charts.
--== STRATEGY ==--
You can combine this indicator with other indicators in your strategy. Many of our most successful users of our previous scripts do just that as it helps them tune a perfect time for an entry.
Personally, we use the indicator and simple trendline entries. When a Buy or Sell triggers, draw a trendline and support / resistance lines and enter on a breakout. That's it.
Please note: this is not a "buy it or sell it now" kind of indicator. Sometimes it will signal a few hours early before a move.
--== SUPPORTED PAIRS ==--
We are always adding pairs, but as of February, 2018 this is our supported USD based pairs: BTC, ETH, LTC, XRP, NEO, BCH, IOT, EOS, BTG, ETC, ETP, OMG, EDO, ZEC, XMR, TRX, SAN, DSH, SNG
--== TELEGRAM CHANNEL ==--
All subscribers to this indicator will get access to our Exclusive Telegram Group where all the signals are analyzed and posted for you to see how we are playing the calls. You can either use this to learn how we use the indicator, or to trade from (at your own risk of course).
The alerts are all posted in this channel automatically and only the timeframes with the highest returns from extensive backtests are posted here automatically. However, we will sometimes post analysis on other timeframes as well.
--== BONUS ==--
As a subscriber, not only do you get this amazing indicator, but as a subscriber you will get access to our Crypto Money Index and the Crypto Money Bot
--== ACCESS ==--
Access is simple, go to our new website and register: Crypto Signals Bot
We will work to get you access to everything as quickly as possible. If you have any issues or questions, use the contact form on the website.