Arbitrage Scanner Pro [Multi-Asset Dashboard]⚡ Arbitrage Scanner Pro
━━━━━━━━━━━━━━━━━━━━━━━━━━━━━━━━━━━━━━━━━━━━━━
📌 OVERVIEW
Arbitrage Scanner Pro is a multi-asset monitoring and arbitrage detection system that displays 3 assets simultaneously on one chart. It detects trend divergences between correlated assets, identifies arbitrage opportunities in real-time, and uses speed simulation to make indicators react as if running on sub-minute timeframes (10s, 15s, 30s).
━━━━━━━━━━━━━━━━━━━━━━━━━━━━━━━━━━━━━━━━━━━━━━
🧠 HOW IT WORKS
🔹 Speed Simulation Engine
TradingView's minimum timeframe is 1 minute. This indicator mathematically scales indicator parameters to simulate faster reactions:
• Normal (1m) → Standard indicator behavior
• Simulate 30s → Parameters divided by 2 (2x faster reactions)
• Simulate 15s → Parameters divided by 4 (4x faster reactions)
• Simulate 10s → Parameters divided by 6 (6x faster reactions)
Example in 15s mode: EMA 20 becomes EMA 5, RSI 14 becomes RSI 4, Supertrend Length 5 becomes 1.
🔹 Signal Logic
Each asset runs the same strategy independently using its own price data:
LONG conditions (all must be true):
✅ Supertrend = Bullish (green)
✅ Close > EMA of Highs (breakout above channel)
✅ RSI > 60 (strong momentum)
✅ RSI > RSI Moving Average (momentum accelerating)
✅ Supertrend outside EMA channel (trending, not choppy)
SHORT conditions (all must be true):
✅ Supertrend = Bearish (red)
✅ Close < EMA of Lows (breakdown below channel)
✅ Supertrend outside EMA channel (trending, not choppy)
The "Supertrend outside EMA channel" filter is the key innovation — it eliminates false signals during sideways consolidation by only allowing signals when the market shows a clean directional trend.
━━━━━━━━━━━━━━━━━━━━━━━━━━━━━━━━━━━━━━━━━━━━━━
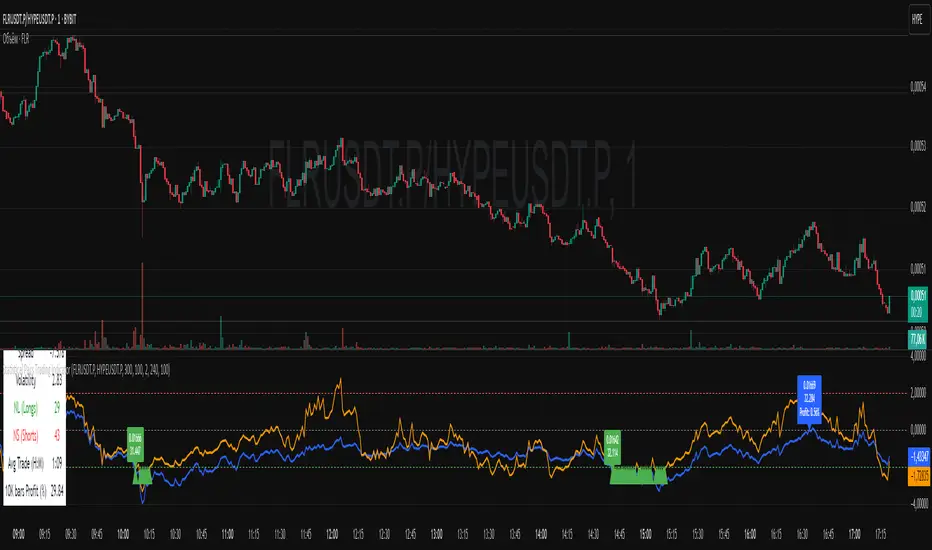
📊 MULTI-ASSET DISPLAY
The indicator creates a stacked 3-panel layout in a single pane:
• Asset A (Main) → Your chart's symbol with overlay indicators
• Asset B (Secondary) → Normalized candles in 0-100 range with full OHLC
• Asset C (Third) → Normalized candles shifted below with adjustable gap
Each secondary asset displays:
📊 Ticker name (e.g., ETHUSDT)
🏛️ Exchange/broker name (e.g., BINANCE) — auto-parsed from symbol
💲 Live price with up to 4 decimal precision
📈 Bar-to-bar percentage change with color coding
Price normalization formula:
Normalized = (Price - 200-bar Low) ÷ (200-bar High - 200-bar Low) × 100
All indicators (EMA channels, Supertrend) are also normalized to the same scale.
━━━━━━━━━━━━━━━━━━━━━━━━━━━━━━━━━━━━━━━━━━━━━━
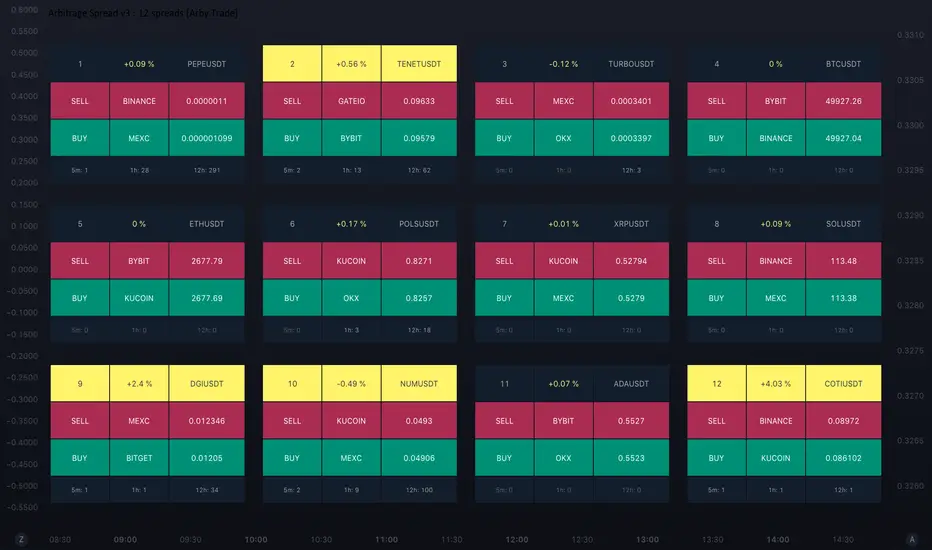
🔍 ARBITRAGE DETECTION
The core feature — compares trend directions and signal timing across all 3 assets.
🔹 Signal Divergence (strongest signal):
Fires when two assets generate OPPOSITE signals on the same bar.
Example: Asset A = LONG while Asset B = SHORT → ⚠️ Arbitrage Opportunity
🔹 Trend Divergence (ongoing):
Tracks when assets have different Supertrend directions.
Measured as a Divergence Score from 0/3 (all aligned) to 3/3 (all different).
🔹 Convergence Detection:
Fires when ALL 3 assets trigger the same signal simultaneously.
All LONG → Maximum bullish confirmation.
All SHORT → Maximum bearish confirmation.
🔹 Visual Feedback:
• Yellow background flash → Signal divergence detected
• Green background flash → All assets triggered LONG
• Pink background flash → All assets triggered SHORT
━━━━━━━━━━━━━━━━━━━━━━━━━━━━━━━━━━━━━━━━━━━━━━
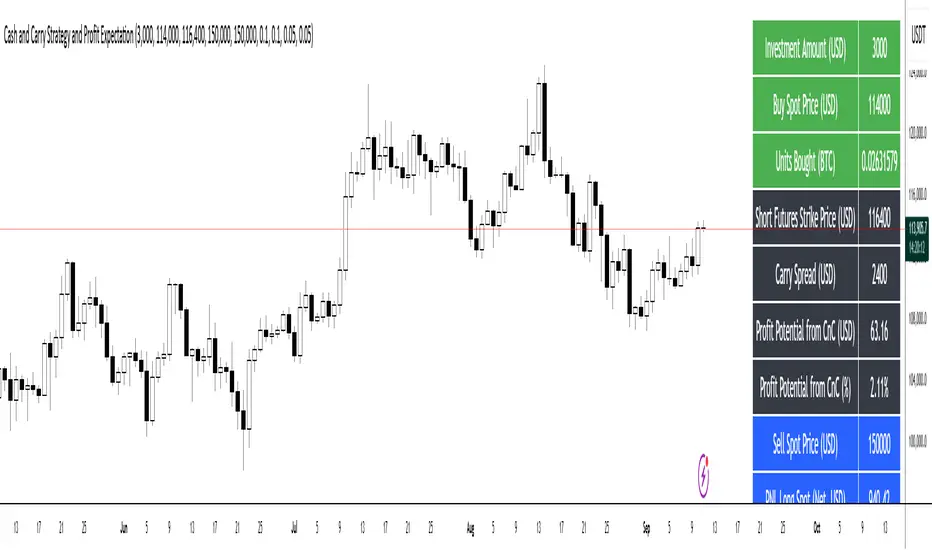
📋 DASHBOARD
The professional dashboard table shows real-time data for all assets:
• ASSET → Parsed ticker name with emoji identifier
• EXCHANGE → Auto-detected exchange/broker (BINANCE, COINBASE, FX, etc.)
• PRICE → Live close price
• CHANGE → Bar-to-bar % change (green/red)
• TREND → Supertrend direction (▲ BULL / ▼ BEAR)
• SIGNAL → Current state (🚀 LONG! / 🔻 SHORT! / 🟢 Long / 🔴 Short / ⚪ Neutral)
Arbitrage Status Section:
• Overall divergence assessment with descriptive message
• Pair-by-pair comparison (A↔B, A↔C, B↔C) — DIVERGED or ALIGNED
• RSI values for all 3 assets side-by-side
• Divergence score (0/3 to 3/3)
Dashboard size, position, and label sizes are all adjustable.
━━━━━━━━━━━━━━━━━━━━━━━━━━━━━━━━━━━━━━━━━━━━━━
⚙️ SETTINGS
🔹 Speed Mode:
Scan Speed → Normal (1m) / Simulate 30s / Simulate 15s / Simulate 10s
🔹 Detection Settings:
Trend Detection Length → Supertrend ATR lookback (default: 5)
Sensitivity Factor → Supertrend ATR multiplier (default: 1.0)
Channel Length → EMA lookback for high/low channel (default: 20)
Momentum Length → RSI period (default: 14)
🔹 Asset Configuration:
Asset B and Asset C can be independently enabled/disabled with custom symbols and candle colors.
🔹 Display Settings:
Show Trend Overlays → Toggle EMA and Supertrend on secondary charts
Signal Style → Labels / Arrows / Both
Gap Between Charts → 80 to 500 (vertical spacing)
Signal Label Offset → Distance of signal labels from candles
🔹 Size Settings:
Dashboard Text Size → Tiny / Small / Normal / Large
Chart Label Size → Tiny / Small / Normal / Large / Huge
Signal Label Size → Tiny / Small / Normal / Large / Huge
Dashboard Position → 9 positions (Top/Mid/Bottom × Left/Center/Right)
━━━━━━━━━━━━━━━━━━━━━━━━━━━━━━━━━━━━━━━━━━━━━━
🔔 ALERTS (12 Total)
Individual (6):
• Asset A LONG / SHORT
• Asset B LONG / SHORT
• Asset C LONG / SHORT
Combined (2):
• ANY asset LONG
• ANY asset SHORT
Arbitrage-Specific (4):
• ⚠️ Signal Divergence detected (opposite signals on same bar)
• 🟢 All 3 assets LONG convergence
• 🔴 All 3 assets SHORT convergence
• 🔶 High divergence score (2+/3)
━━━━━━━━━━━━━━━━━━━━━━━━━━━━━━━━━━━━━━━━━━━━━━
📈 USE CASES
🔹 Cross-Exchange Arbitrage:
Monitor BTC on BINANCE, COINBASE, and BYBIT simultaneously. When one exchange shows LONG while another shows SHORT, a price discrepancy exists.
🔹 Crypto Correlation Trading:
Watch BTC, ETH, and SOL together. BTC often leads — when BTC triggers LONG first, altcoins typically follow. Enter altcoins on confirmation.
🔹 Forex Multi-Pair Scanning:
Monitor EURUSD, GBPUSD, and USDJPY. When EUR and GBP both show LONG while JPY shows SHORT, it confirms broad USD weakness.
🔹 Index + Sector Rotation:
Track S&P 500 futures alongside QQQ (tech) and XLF (financials). Divergences between sectors reveal which is driving the market.
🔹 News Event Reaction:
Monitor Gold, Dollar Index, and 10-Year Yields during economic releases. The 10s simulation catches reactions within the first minute candle.
━━━━━━━━━━━━━━━━━━━━━━━━━━━━━━━━━━━━━━━━━━━━━━
⚠️ IMPORTANT NOTES
• This uses 1-minute OHLC data — it does NOT create actual sub-minute candles
• Signals fire at bar close, not mid-candle
• The 0-100 normalization can make small moves appear larger
• This is a detection tool — trade execution requires separate infrastructure
• Best used on 1-minute charts where the speed simulation is calibrated
• Always combine with proper risk management
━━━━━━━━━━━━━━━━━━━━━━━━━━━━━━━━━━━━━━━━━━━━━━
🔧 RECOMMENDED SETTINGS
Crypto (High Volatility): Sim 15s, Length 5, Factor 1.0, Channel 20
Crypto (Low Volatility): Sim 30s, Length 7, Factor 1.5, Channel 25
Forex Majors: Sim 30s, Length 5, Factor 1.5, Channel 20
Stock Indices: Sim 30s, Length 5, Factor 1.0, Channel 15
News Events: Sim 10s, Length 3, Factor 0.5, Channel 10
Pine Script® indicator