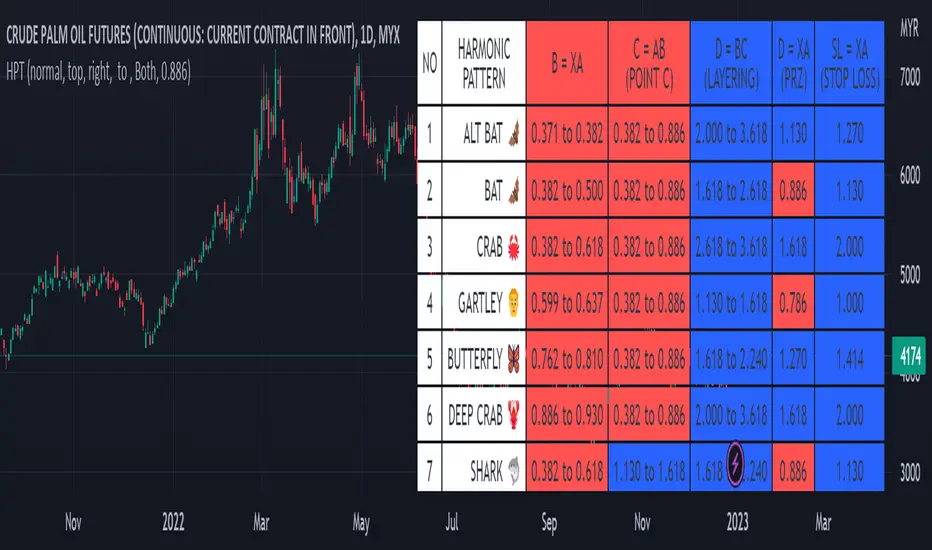
Harmonic Pattern Table UDT█ OVERVIEW
This table indicator was intended as helper / reference for using XABCD Pattern drawing tool.
The values shown in table was based on Harmonic Trading Volume 3: Reaction vs. Reversal written by Scott M Carney.
Code upgrade from Harmonic Pattern Table (Source Code) and based on latest User-Defined Type (UDT) .
As a result, code appeared more cleaner.
█ FEATURES
1. List Harmonic Patterns.
2. Font size small for mobile app and font size normal for desktop.
3. Options to show Animal name in text, emoji or both.
█ USAGE
Similar to Harmonic Pattern Table (Source Code).
█ CREDITS
Scott M Carney, Trading Volume 3: Reaction vs. Reversal
Array
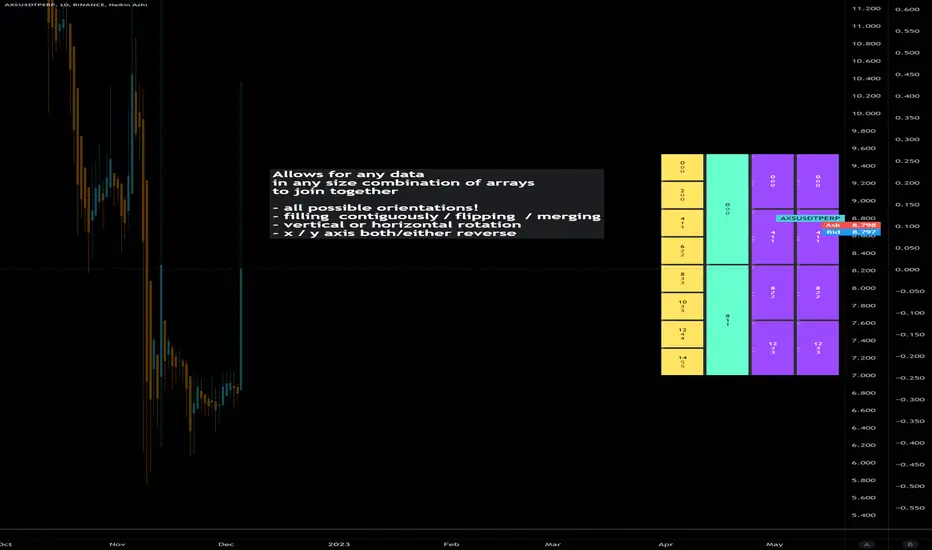
Dynamic Array Table (versatile display methods)Library "datTable"
Dynamic Array Table.... Configurable Shape/Size Table from Arrays
Allows for any data in any size combination of arrays to join together
with:
all possible orientations!
filling all cells contiguously and/or flipping at boundaries
vertical or horizontal rotation
x/y axis direction swapping
all types array inputs for data.
please notify of any bugs. thanks
init(_posit)
Get Table (otional gapping cells)
Parameters:
_posit : String or Int (1-9 3x3 grid L to R)
Returns: Table
coords()
Req'd coords Seperate for VARIP table, non-varip coords
add
Add arrays to display table. coords reset each calc
uses displaytable object, string titles, and color optional array, and second line optional data array.
Trend line & pivot level
This script can plot pivot levels and trend lines that are haven't broke out.
In the setting, left and right means how to get the pivot. the pivot will be gotten based on the left candles and the right candles. boxes will be auto deleted after the box was broke.
Important: This is just a beta version, if you find some bug with using this script. Don't hesitate to contact me.
What the future version will have? Might be pattern scanner, multi trend line, levels in different time frame, break out alert, or better key level algorithm. Depends on when I have free time.

fast_utilsLibrary "fast_utils"
This library contains my favourite functions. Will be updated frequently
count_int_digits()
Count int digits in number
Returns: : number of int digits in number
count_float_digits()
Count float digits in number
Returns: : number of float digits in number
stringify()
Convert values in array or matrix into string values
Returns: : array or matrix of string values
arrcompare()
Compare values in arrays
Returns: : bool value
arrdedup()
Remove duplicate values in array
Returns: : array without duplicates
ResInMins()
Converts current resolution in minutes
Returns: : return float number of minuted
MultOfRes(res, mult)
Convert current float TF in minutes to target string TF in "timeframe.period" format.
Parameters:
res : : current resolution in minutes
mult : : Multiple of current TF to be calculated.
Returns: : timeframe format string

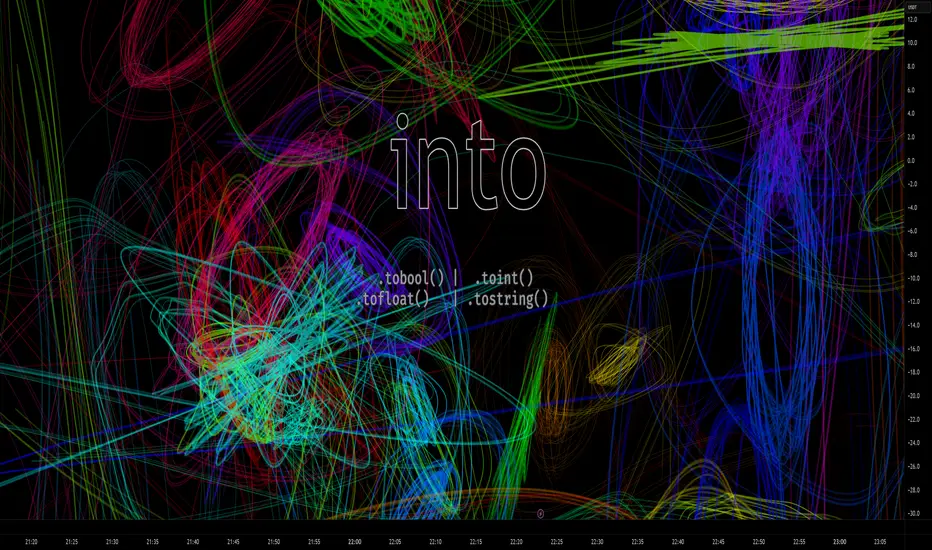
intoLibrary "into"
convert literals by type,
Same-types left in for bulk reasons.
TODO: Expand Types
b(string)
Convert string to bool.
Parameters:
string : val A string value.
Returns: Bool.
b(bool)
Pass Bool/bool
Parameters:
bool :
Returns: Bool.
b(float)
Convert Float (True if exists and not 0)
Parameters:
float : val A float value.
Returns: Bool.
b(int)
Convert integer (True if exists and not 0)
Parameters:
int : val An integer value.
Returns: Bool.
f(bool)
Convert bool to float.
Parameters:
bool : val A boolean value.
Returns: Float.
f(string, int)
Convert with decimal
Parameters:
string : val A string value.
int : decimals Decimal places. def = 6
Returns: Float.
f(float, int)
Convert float bypass with decimals
Parameters:
float : val A float value.
int : decimals Decimal places. def = 6
Returns: Float.
f(int)
Convert integer to float.
Parameters:
int : val An integer value.
Returns: Float.
i(bool)
Convert bool to int.
Parameters:
bool : val A boolean value.
Returns: Int.
i(string)
Convert string number to int.
Parameters:
string : val A string value.
Returns: Int.
i(float)
Convert float to int.
Parameters:
float : val A float value.
Returns: Int.
i(int)
Convert int to int.
Parameters:
int : val An int value.
Returns: Int.
s(bool)
Convert bool value to string.
Parameters:
bool : val A boolean value.
Returns: String.
s(str)
bypass string
Parameters:
str : val A string value.
Returns: String.
s(float)
Convert float value to string.
Parameters:
float : val A float value.
Returns: String.
s(int)
Convert int value to string.
Parameters:
int : val An integer value.
Returns: String.
s(val)
Array Convert Each Item
Parameters:
val : Array Input (Str,Bool,Int,Float)
Returns: String.
s(val)
Array Convert Each Item
Parameters:
val : Array Input (Str,Bool,Int,Float)
Returns: String.
s(val)
Array Convert Each Item
Parameters:
val : Array Input (Str,Bool,Int,Float)
Returns: String.
s(val)
Array Convert Each Item
Parameters:
val : Array Input (Str,Bool,Int,Float)
Returns: String.
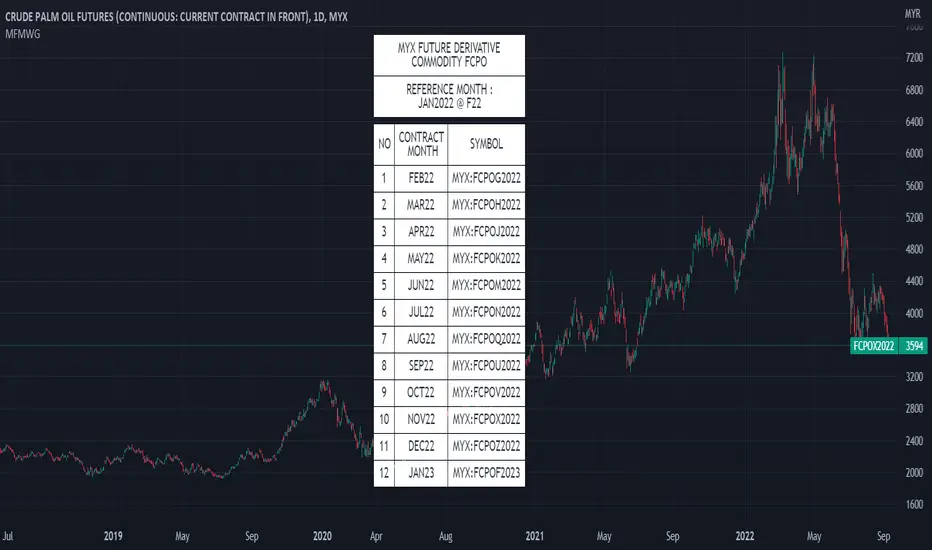
MYX Future Market Watchlist Generator█ OVERVIEW
This indicator listed all Future market in Malaysia and categorize them into Contract Month, Spread, Current Contract and Continuous Contract.
The indicator was developed to make user easier to make watchlist, suitable for beginners and experts in Malaysia Future Market.
This cover all Malaysia Future Markets as follows :
1. Commodity - FCPO, FPKO, FGLD, FTIN, FPOL and FUPO
2. Equity - FKLI and FM70
3. SSF - FCIM, FDRB, FGAM, FHAR, FINA, FMEG, FGEM, FGEN, FTEL and FTOP
4. Financial - FKB3, FMG3, FMG5 and FMGA
█ INSPIRATIONS
This indicator got inspirations from the previous indicators which I developed :
MYX Malaysia Bursa Futures Derivatives Auto Detect
FCPO Contract Month Table
█ CREDITS
I dedicated to known members in this industry especially who actively involved in Malaysia Future Market.
BURSATRENDBANDCHART
zhafrihandsome
XMODEUS
HAIDOJO_trading
datuksri
wrtech2020
FaizHebat
█ FEATURES
1. As mentioned in overview, main ability to categorize and export into watchlist.
2. Dark or light theme table including table position.
█ IMPORTANT NOTES
1. This indicator is one time usage only to generate watchlist through alert.
2. Use live chart to generate alert.
3. Set Alert Frequency to All.
4. Remove Alert once watchlist is done.
5. Usage method is similar to this video . (Sorry no audio provided)
█ EXAMPLE OF USAGE
Library: ArrayLibrary "xarray"
Additional functions for array.
remove_duplicates(array_in)
Remove duplicates in array.
Parameters:
array_in : (int /float /string ) Array contains duplicates.
Returns: Array without duplicates.
// Example: int
import tuele99/xarray/1 as xarray
c = xarray.remove_duplicates(array.from(1, 4, 2, 1, 2))
plot(array.size(c))
plot(array.get(c, 0))
plot(array.get(c, 1))
// Example: float
import tuele99/xarray/1 as xarray
c = xarray.remove_duplicates(array.from(1.0, 4.0, 2.0, 1.0, 2.0))
plot(array.size(c))
plot(array.get(c, 0))
plot(array.get(c, 1))
// Example: string
import tuele99/xarray/1 as xarray
c = xarray.remove_duplicates(array.from("green", "red", "green", "red", "green"))
plot(array.size(c)) // value = 2
label0 = label.new(x=last_bar_index, y=0, yloc=yloc.belowbar, text=array.get(c, 0), style=label.style_label_left, color=color.new(color.black, 100), textcolor=color.green) // below text = "green"
label1 = label.new(x=last_bar_index, y=0, yloc=yloc.abovebar, text=array.get(c, 1), style=label.style_label_left, color=color.new(color.black, 100), textcolor=color.red) // above text = "red"
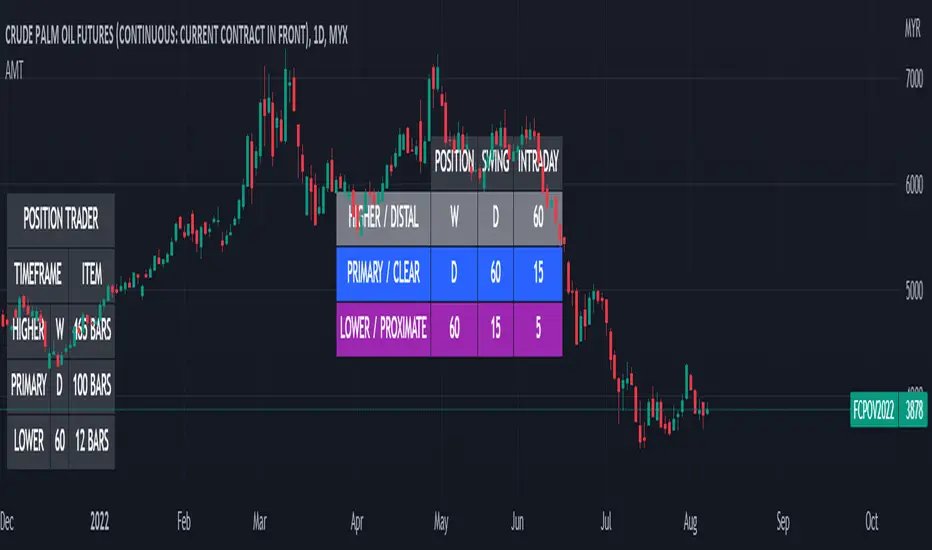
Alternative MTF Table█ OVERVIEW
This indicator is an educational indicator which was stripped down from Regression Channel Alternative MTF to display 3 timeframes based on timeframe scenarios.
The timeframe scenarios are defined based on Position, Swing and Intraday Trader.
█ INSPIRATION
It is possible to use array.new_bool, array.indexof and switch to get this outcome. Credits to TradingView .
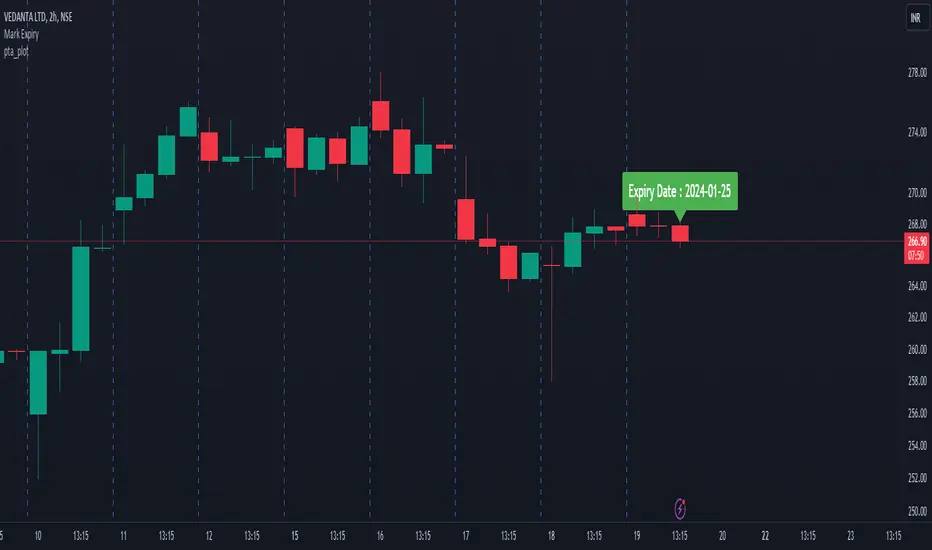
pta_plotLibrary "pta_plot"
pta_plot: This library will help you to plot different value. I will keep updating with your requirement
print_array(array_id, border_color)
Display array element as a table.
Parameters:
array_id : Id of your array.
border_color : Color for border (`color.black` is used if no argument is supplied).
Returns: Display array element in bottom of the pane.
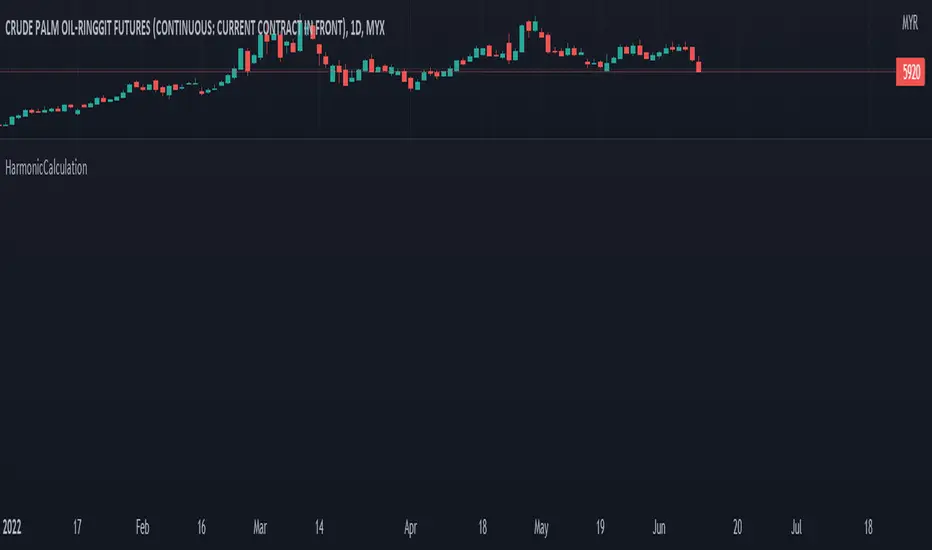
HarmonicCalculation█ OVERVIEW
This library is complementary for XABCD Harmonic Pattern Custom Range Interactive
PriceDiff()
: Price Difference
Parameters:
: : price_1, price_2
Returns: : PriceDiff
TimeDiff()
: Time Difference
Parameters:
: : time_1, time_2
Returns: : TimeDiff
ReturnIndexOf3Arrays()
: Return Index Of 3 Arrays
Parameters:
: : id1, id2, id3, _int
Returns: : ReturnIndexOf3Arrays
AbsoluteRange()
: Price Difference
Parameters:
: : price, y, point
Returns: : AbsoluteRange
PriceAverage()
: To calculate average of 2 prices
Parameters:
: : price_1, price_2
Returns: : PriceAverage
TimeAverage()
: To calculate average of 2 times
Parameters:
: : time_1, time_2
Returns: : TimeAverage
StringBool()
: To show ratio in 3 decimals format
Parameters:
: : _value, _bool, _text
Returns: : StringBool
PricePercent()
: To show Price in percent format
Parameters:
: : _price, PriceRef, str_dir
Returns: : PricePercent
BoolCurrency()
: To show syminfo.currency
Parameters:
: : _bool
Returns: : BoolCurrency
RatioText()
: To show RatioText in 3 decimals format
Parameters:
: : _value, _text
Returns: : RatioText
RangeText()
: To display RangeText in Harmonic Range Format
Parameters:
: : _id1, _id2, _int, _text
Returns: : RangeText
PriceCurrency()
: To show Currency in Price Format
Parameters:
: : _bool, _value
Returns: : PriceCurrency
"Swap" - Bool/Position/Value : Array / Matrix / Var AutoswapLibrary "swap"
Side / Boundary Based All Types Swapper
- three automagical types for Arrays, Matrixes, and Variables
-- no signal : Long/ Short position autoswap
-- true / false : Boolean based side choice
-- Src / Thresh : if source is above or below the threshold
- two operating modes for variables, Holding mode only for arrays/matrixes
-- with two items, will automatically change between the two caveat is it does not delete table/box/line(fill VAR items automatically)
-- with three items, a neutral is available for NA input or neutral
- one function name for all of them. One import name that's easy to type/remember
-- make life easy for your conditional items.
side(source, thresh, _a, _b, _c)
side Change outputs based on position or a crossing level
Parameters:
source : (float) OPTIONAL value input
thresh : (float) OPTIONAL boundary line to cross
_a : (any) if Long/True/Above
_b : (any) if Short/False/Below
_c : (any) OPTIONAL NOT FOR MTX OR ARR... Neutral Item, if var/varip on a/b it will leave behind, ie, a table or box or line will not erase , if it's a varip you're sending in.
Returns: first, second, or third items based on input conditions
Please notify if bugs found.
Thanks.

Harmonic Table Combo Point B█ OVERVIEW
This indicator was intended as educational purpose only and alternative way to show value in table as shown in Harmonic Pattern Possibility Table .
█ CREDITS
Credit to Scott M Carney, Harmonic Trading Volume 3: Reaction vs. Reversal.
█ USAGE EXAMPLE

[LIB] Array / Matrix DisplayLibrary "ArrayMatrixHUD"
Show Array or Matrix Elements In Table
For Arrays: Set the number of rows you want the data displayed in and it will generate a table, calculating the columns based on the size of the array being displayed.
For Matrix: It will automatically match the Rows and Columns to the values in the matrix.
Note: On the left, the table shows the index of the array/matrix value starting at 1. So, to call that value from inside the array, subtract 1 from the index value to the left. For matrices, keep in mind that the row and column are also starting at one when trying to call a value from the matrix. The numbering of the values on the left is for display purposes only.
viewArray(_arrayName, _pos, _txtSize, _tRows)
Array Element Display (Supports float, int, string, and bool)
Parameters:
_arrayName : ID of Array to be Displayed
_pos : Position for Table
_txtSize : Size of Table Cell Text
_tRows : Number of Rows to Display Data In (columns will be calculated accordingly)
Returns: A Display of Array Values in a Table
viewMatrix(_matrixName, _pos, _txtSize)
Matrix Element Display (Supports float, int, string, and bool)
Parameters:
_matrixName : ID of Matrix to be Displayed
_pos : Position for Table
_txtSize : Size of Table Cell Text
Returns: A Display of Matrix Values in a Table

Harmonic Pattern Possibility Table█ OVERVIEW
This indicator was intended as educational purpose only based on Harmonic Pattern Table (Source Code) and Ratio For Harmonic Points to show Harmonic Pattern Possibility.
█ INSPIRATION
This indicator was build upon realizing there are some overlap for B = XA among Alternate Bat, Bat, Crab and Gartley.
Hence, the values split up to showcase the possibility of non overlap ratio.
█ USAGE
Possible pattern, priority pattern and selected pattern may differs based value input.
Therefore C = AB, D = BC, D = XA and Stop Loss will change based value input and also selected pattern.
█ CREDITS
Credit to Scott M Carney, Harmonic Trading Volume 3: Reaction vs. Reversal.

ColorArrayLibrary "ColorArray"
Simple color array gradient tool.
makeGradient(size, _col1, _col2, _col3, _col4, _col5) Color Gradient Array from 5 colors.
Parameters:
size : : default 10
_col1 : : default #ff0000
_col2 : : default #ffff00
_col3 : : default #00ff00
_col4 : : default #00ffff
_col5 : : default #0000ff
Returns: array of colors to specified size.

[HELPER] Math Constant Helper█ OVERVIEW
This indicator is to show constant in table using built-in math name space, coded in latest Pine Script version 5.
█ CREDITS
Credits to PineCoders.
█ FEATURES
- Display table by changing table position, font size and color.

Ratio For Harmonic Points█ OVERVIEW
This indicator was intended as educational purpose only based on Harmonic Pattern Table (Source Code) to show indication of ratio for each Harmonic points from Point B until Stop Loss.
█ CREDITS
Credit to Scott M Carney, Harmonic Trading Volume 3: Reaction vs. Reversal.
█ USAGE EXAMPLE

Education: INDEXThis is an INDEX page where educational links/scripts are sorted in the script itself (see below)
For example:
- where is the link of the 'var' article/idea?
-> search in the script comments below for Keywords -> var -> look for the date ->
now you will find the link at the date of update

Selamat Hari RayaA fun way to express Selamat Aidil Fitri to all muslims.
Selamat Hari Raya Aidil Fitri
Maaf Zahir Dan Batin.

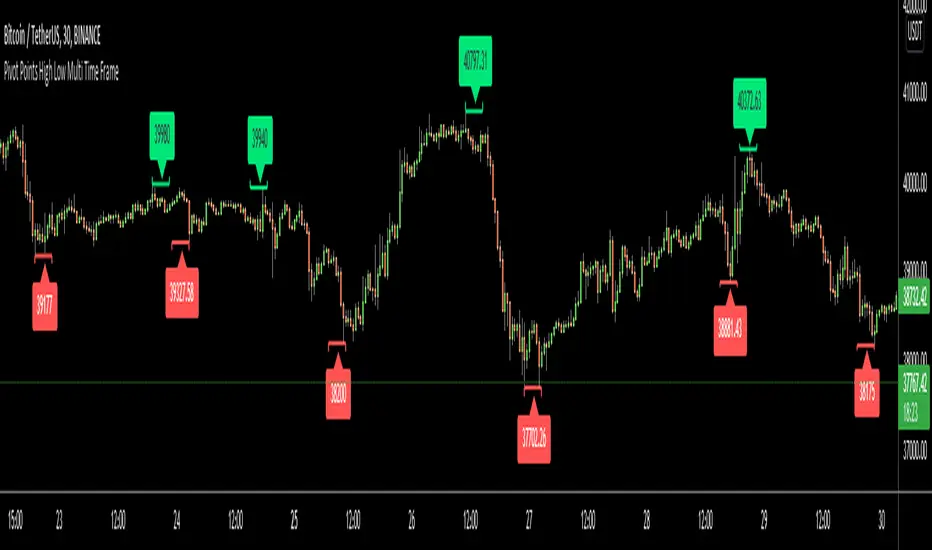
Pivot Points High Low Multi Time FrameHello All,
There are built-in and published Pivot Point High Low indicators in Public Library but as far as I see none of them is for Higher Time frames. so I decided to write & publish this script. I hope it would be useful while trading or developing your own scripts. I also did this to use in one of my future projects (we will see it in a few weeks/months ;) ).
I tried to make all settings optional, so you can play with them as you wish.
P.S. There is no control mechanism if the chart time frame is lower than the time frame in the options. So you better set higher time frame in the options than the chart time frame.
Enjoy!
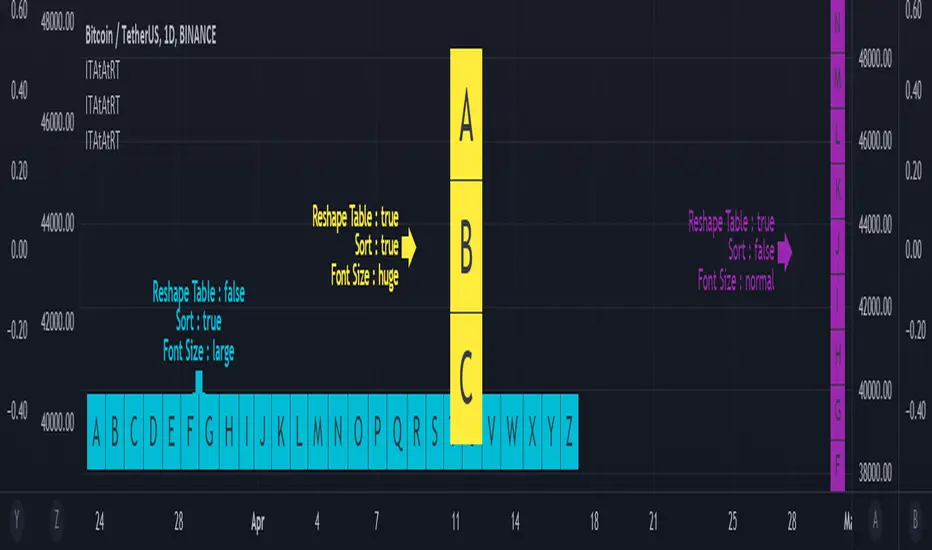
Input Text Area to Array then Reshape Table█ OVERVIEW
Simple method to convert from input.text_area to array using str.split.
Reshape table using switch, not necessary must use matrix.reshape.
Might be useful pine script to replace input.symbol.
█ FEATURES
Table can positioned by any position and font size can be resized.
Reshape table and sorting array if necessary.
█ CREDITS
Credits to TradingView for new update of input.text_area.
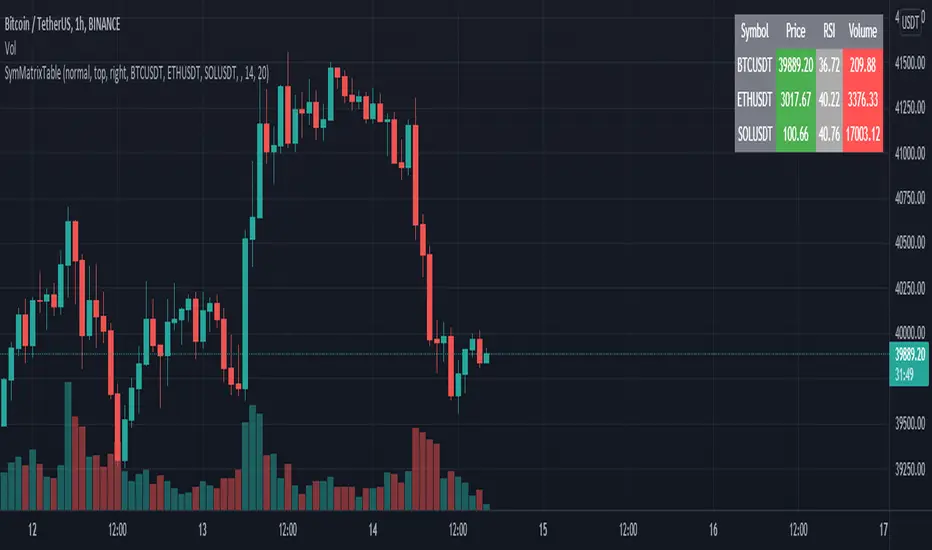
SymMatrixTableSimple Example Table for Displaying Price, RSI, Volume of multiple Tickers on selected Timeframe
Displays Price, RSI and Volume of 3 Tickers and Timeframe selected by user input
Conditional Table Cell coloring
Price color green if > than previous candle close and red if < previous candle close
RSI color green if < 30 and red if > 70 (RSI14 by default)
Volume color green if above average volume and red if less than that (SMA20 volume by default)
Can turn on/off whole table, header columns, row indices, or select individual columns or rows to show/hide
// Example Mixed Type Matrix To Table //
access the simple example script by uncommenting the code at the end
Basically I wanted to have the headers and indices as strings and the rest of the matrix for the table body as floats, then conditional coloring on the table cells
And also the functionality to turn rows and columns on/off from table through checkboxes of user input
Before I was storing each of the values separately in arrays that didn't have a centralized way of controlling table structure
so now the structure is :
- string header array, string index array
- float matrix for table body
- color matrix with bool conditions for coloring table cells
- bool checkboxes for controlling table display
jsonLibrary "json"
Convert JSON strings to tradingview
▦ FEATURES ▦
█ Json to array █ Get json key names █ Get json key values █ Size of json
get_json_keys_names(raw_json) Returns string array with all key names
Parameters:
raw_json : (string) Raw JSON string
Returns: (string array) Array with all key names
get_values_by_id_name(raw_json, key_name) Returns string array with values of the input key name
Parameters:
raw_json : (string) Raw JSON string
key_name : (string) Name of the key to be fetched
Returns: (string array) Array with values of the input key name
size_of_json_string(raw_json) Returns size of raw JSON string
Parameters:
raw_json : (string) Raw JSON string
Returns: Size of n_of_values, size of n_of_keys_names
