Pixel ArtHaving Fun with Arrays.
I couldn't load all of the images into their respective arrays without getting an "Internal Pine error" So I commented out some of them. You can pop them back in, but make sure to disable another in its place.
Vader
Pine Logo
&hearts
Bitcoin
pAulse
Array

Array SMACalcuating SMA on an Array
In this script i show you how to calculate SMA on an array.
Several values are plotted just for illustration.
Steps to follow:
- make sure you have an array with values (source array)
- create a blank array (pref. with the same size)
- call the function array_sma
This function fills the empty array with the SMA values of the source array.

Advancing Declining OscillatorYet another Array indicator, simple, but efficient which i call ADO. The indicator acts as a COUNTER of when CLOSE closes above OPEN and vice versa based on specified look back period in settings.
If we have more Closes above Opens, obviously the indicator will be above ZERO and GREEN, otherwise RED.
Optional to smooth it by EMA (true by default).
Like if you Like and Enjoy!

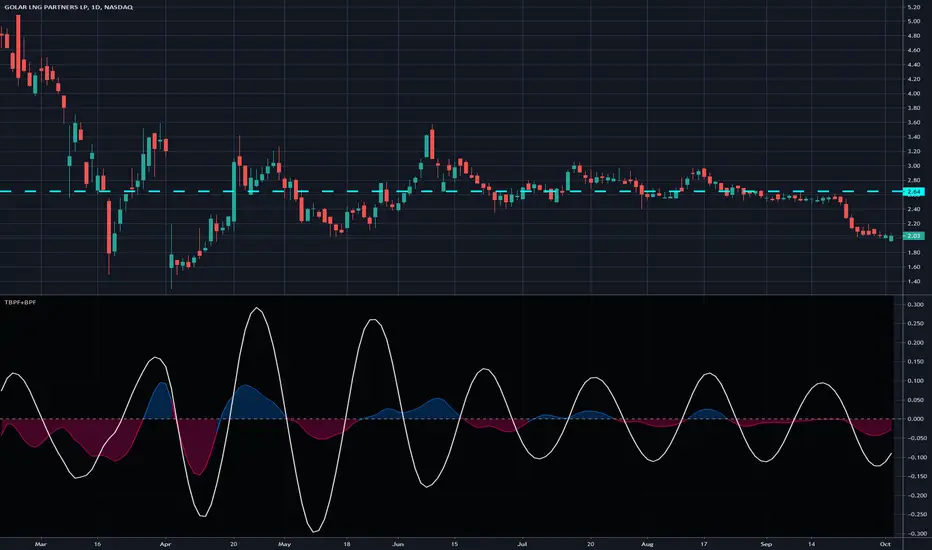
Truncated Bandpass Filter and Bandpass Filter - Dr. John EhlersWith the arrival of the blessed gifts of arrays from TV, I now present the REAL "Truncated Bandpass Filter" indicator employing PSv4.0 upon initial release, originally formulated by the magnificent mathemagician Dr. John Ehlers for TASC - July 2020 Traders Tips. Don't be bamboozled by the other incorrect truncated bandpass filters found on TV, those published with an erroneous haste that preceded Pine array availability. More information about these bandpass filters can be acquired with a simple search for this indicator's white paper, entitled "TRUNCATED INDICATORS by John F. Ehlers", on his site in the educational reference section.
This actually contains two indicators, one being the truncated bandpass, the other being a two pole bandpass which is also found in my Voss implementation. The two pole bandpass is primarily for comparison of both types, but as you can see, they share common code within both, one being truncated and the other not. I modified Ehlers' original truncation formulation by allowing the capability to alter the truncation period using two distinct methods. I will explain very briefly that the purpose of a truncated "infinite impulse response" filter is to dampen it's response. Truncation techniques aren't limited to only bandpass filters, "some" other IIR filters, but not all, may benefit from this as well.
Lastly this is a miniature starter lesson by example of how the new native Pine array functions may be used, along with other various methods such as `var` to improve computational efficiency on the cloud servers. Yep, native Pine arrays just doubled the "Power of Pine" by exponential magnitudes of power into the dimension of what I would now term as the "Immense Power of Pine" . The next generation capability of programming extremely advanced indicators has now successfully arrived on mothership Earth, right on TradingView's front lawn. Who would of known?? This is brought to you in part by the devoted voluntary efforts of the most skilled poetic programmers on TV, the likes of which most extraterrestrial alien programmers would fear. Ladies and Gents, YOU KNOW WHO YOU ARE. Wink, wink!
NOTICE: You have absolute freedom to use this source code any way you see fit within your new Pine projects. You don't have to ask for my permission to reuse these functions in your published scripts, simply because I have better things to do than answer requests for the reuse of the tbpf() and bpf() functions. Sufficient accreditation regarding this script and compliance with "TV's House Rules" regarding code reuse, is as easy as copying the functions in their entirety as is. Fair enough? Good!
Features List Includes:
Dark Background - Easily disabled in indicator Settings->Style for "Light" charts or with Pine commenting
AND a few more... Why list them, when you have the source code to explore!
When available time provides itself, I will consider your inquiries, thoughts, and concepts presented below in the comments section, should you have any questions or comments regarding this indicator. When my indicators achieve more prevalent use by TV members, I may implement more ideas when they present themselves as worthy additions. Have a profitable future everyone!
Low - High Simple TrackerYet another "Low - High" indicator using the new Pine Script Arrays.
The indicator uses the latests Lows and Highs to plot a trend line and reversal/slowdown.
More detailed explanation inside the script.
Enjoy!
Green - Up Trending
Red - Down Trending
White - Slow Down/Reversal might occur.
Made for educational purposes of how to use Arrays, yet can be very useful.

CC - Array-meta Consolidated Interval Display (ACID)This script extends my other two Array examples (which I've also provided to you open source):
The Ticker-centric 5m,15m,45m,1h,4h,1d resolution labels using arrays:
And the more Macro VIX,GLD,TLT,QQQ,SPY,IWM 1d resolution labels using arrays:
This script aims to show how to use min/max/avg with Arrays easily. My next example after this will be exploring the usage of variance versus covariance ratios over different periodic interval resolutions. Currently, this is using the following intervals: 5m,15m,45m,1h,4h,1d. It takes these intervals, calculates the values at those resolutions and puts the absolute min and max from the 5 minute to the 1 day resolutions.
It's more of an example of the power that arrays can hold, as all this truly is right now is a min/max bound calculator. The real gem lies in the avg calculators for multiple resoltuions tied into a single label with readable data. Check out the code and let me know what you think. If you need more examples, the other two scripts I mentioned before are also open source.
Using this on intervals of less than 1D sometimes times out, the way I wrote it is memory intensive, may not work for non-pro users.
Thanks!
NONE OF THIS IS FOREWARD LOOKING STATEMENTS, THIS IS NOT A PREDECTIVE ANALYSIS TOOL. THIS IS A RESEARCH ATTEMPT AT A NOVEL INDICATOR. I am not responsible for outcomes using it.
Please use and give criticisms freely. I am experimenting with combining resolutions and comparing covariance values at different levels right now, so let me know your thoughts! The last indicator will likely not be open source, but may be depending on how complex I get.

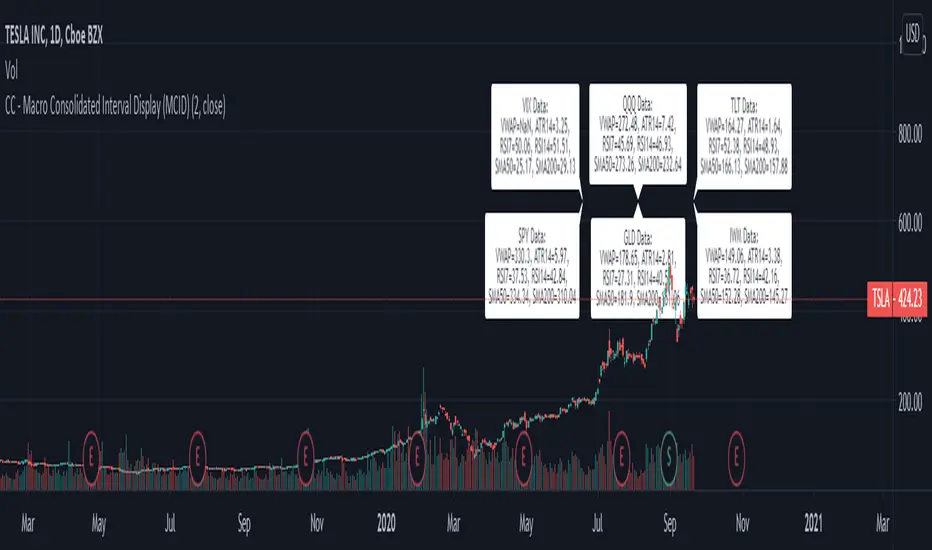
CC - Macro Consolidated Interval Display (MCID)Ever wish you didn't have to rapidly flip between 6 different tickers to get the full picture?
Yeah, me too. Do you also wish that you kind of understood how the shift / unshift function works for arrays?
Yeah, I did too. Both of those birds are taken care of with one stone!
The Macro Consolidated Interval Display uses the new Array structure and security to display data for VIX, GLD, TLT, QQQ, SPY and IWM (at a 1D interval) SIMUTANEOUSLY! Regardless of which ticker you're looking at you can get the full picture of macro futures data without flipping around to get it.
This is my first script trying to use arrays. It basically shows the following a 1d interval:
ATR14, RSI7, RSI14, SMA50, SMA200 and VWAP for VIX.
ATR14, RSI7, RSI14, SMA50, SMA200 and VWAP for GLD.
ATR14, RSI7, RSI14, SMA50, SMA200 and VWAP for TLT.
ATR14, RSI7, RSI14, SMA50, SMA200 and VWAP for QQQ.
ATR14, RSI7, RSI14, SMA50, SMA200 and VWAP for SPY.
ATR14, RSI7, RSI14, SMA50, SMA200 and VWAP for IWM
To make it more or less busy, I've allowed you to toggle off any of the levels you wish. I've also chosen to leave this as open source, as it's nothing too experimental, and I hope that it can gain some traction as an Array example that the public can use! If you don't like the different values that are shown, use this source code example as a spring-board to put values that you do care about onto the labels.
If this code has helped you at all please drop me a like or some constructive criticism if you do not think it's worth a like.
Good luck and happy trading friends. This should be compatible with my CID as well:
If this gets traction, I will post something similar for a dynamic combination of tickers and intervals that you can set yourself.
CC - Consolidated Interval Display (CID)Ever wish you didn't have to rapidly flip between 6 different intervals to get the full picture?
Yeah, me too. Do you also wish that you kind of understood how the shift / unshift function works for arrays?
Yeah, I did too. Both of those birds are taken care of with one stone!
The Consolidated Interval Display uses the new Array structure and security to display data for 5m, 15m, 45m, 1h, 4h and 1d intervals SIMUTANEOUSLY! Regardless of which interval you're looking at you can get the full picture of numerical data without flipping around to get it.
This is my first script trying to use arrays. It basically shows the following for the given ticker:
ATR14, RSI7, RSI14, SMA50, SMA200 and VWAP at the 5 minute level.
ATR14, RSI7, RSI14, SMA50, SMA200 and VWAP at the 15 minute level.
ATR14, RSI7, RSI14, SMA50, SMA200 and VWAP at the 45 minute level.
ATR14, RSI7, RSI14, SMA50, SMA200 and VWAP at the 1 hour level.
ATR14, RSI7, RSI14, SMA50, SMA200 and VWAP at the 4 hour level.
ATR14, RSI7, RSI14, SMA50, SMA200 and VWAP at the 1 day level.
To make it more or less busy, I've allowed you to toggle off any of the levels you wish. I've also chosen to leave this as open source, as it's nothing too experimental, and I hope that it can gain some traction as an Array example that the public can use! If you don't like the different values that are shown, use this source code example as a spring-board to put values that you do care about onto the labels.
If this code has helped you at all please drop me a like or some constructive criticism if you do not think it's worth a like.
Good luck and happy trading friends.
If this gets traction, I will post something similar for a combination of SPY, VIX, GOLD, QQQ, IWM and TLT.

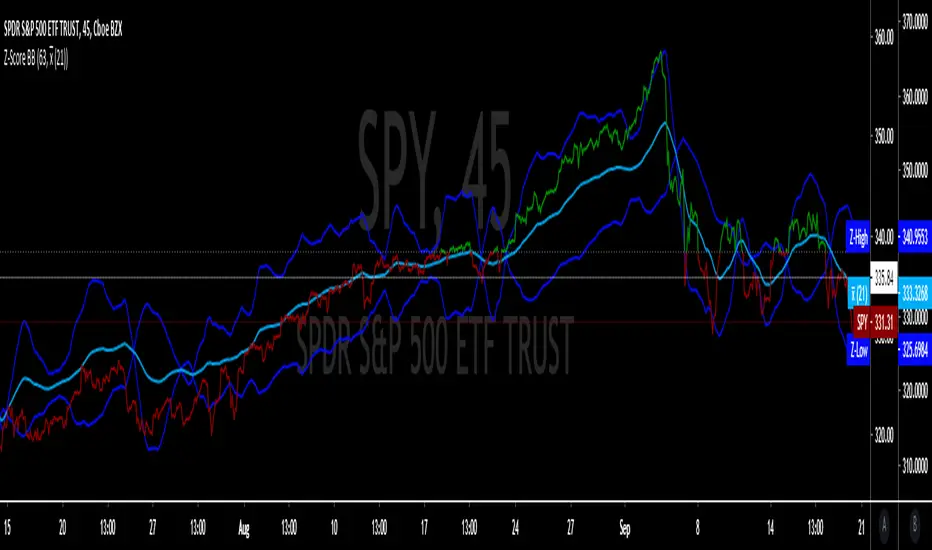
Z-Score 'Bollinger Bands'The following script is an application of the Z-Score (previous script).
Z-Scores can be used in place of standard deviation (sigma) in 'Bollinger Bands'.
The average of the sample (x-bar) over 21 days (N)
21 average trading days per month, fixed value
The average of the population (mu) over 63 days (n)
63 days per quarter, default is set to 63
Z-Score is calculated by formula in previous script, and the absolute value is taken of "Z".
Z-High = absolute value of Z + (x-bar).
Z-Low = absolute value of Z - (x-bar).
Will update with Z from mu and Z from avg (working on UX and visualization details).

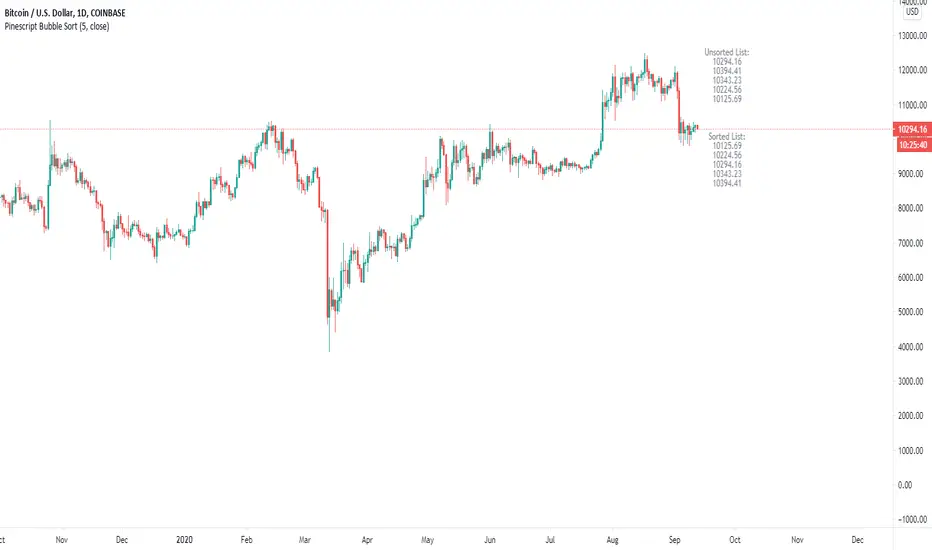
Pinescript Bubble Sort using ArraysThe new feature of arrays allows for a multitude of new possibilities within Pinescript. This script implements a bubble sort function with most probable efficiency of О(n^2) with a best-case being O(n). This sort does not require large amounts of memory to process and has advantages when sorting small lists of data.
The main advantages: Bubble sort is an in-place sorting algorithm. It does not require extra memory or even stack space like in the case of merge sort or quicksort.
The main disadvantages: In the worst case the time complexity is equal to O(n^2) which is not efficient in comparison to other sorts which can have a time complexity of O(n*logn).
The Pseudocode for a bubble sort is as follows:
begin BubbleSort(list)
for all elements of list
if list > list
swap(list , list )
end if
end for
return list
end BubbleSort
The results of the sort are plotted against the unsorted list and overlayed on the chart.
A big thanks to Alex Grover for the help.
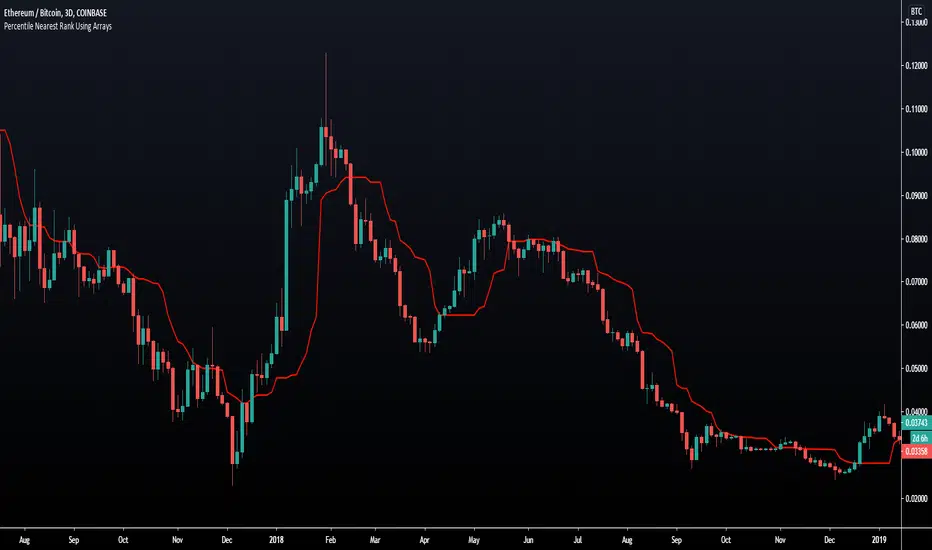
Percentile Nearest Rank Using Arrays [LuxAlgo]The new array feature is extremely powerful, as it will allow pinescript users to do more complex things, or compute existing calculations more efficiently, it will also be possible to shine some light to some already existing functions, one of them being percentile_nearest_rank .
We have been working on this new feature with our pal alexgrover, and made this script which computes a rolling percentile using the nearest rank method.
Settings
Length: Window of the rolling percentile, determine the number of past data to be used.
Percentage: Return the current value if Percentage % of the data fall below that value, the setting is in a range (0,100).
Src: Input source of the indicator.
Usage
A rolling percentile can have many usages when it comes to technical analysis, this is due to its ability to return the value of three common rolling statistics, the rolling median, which can be obtained using a percentage equal to 50, the rolling maximum, obtained with a percentage equal to 100, and the rolling minimum, obtained with a percentage equal to 0.
When we use our rolling percentile as a rolling median, we can obtain a robust estimation of the underlying trend in the price, while using it as a rolling maximum/minimum can allow us to determine if the market is trending, and at which direction. The rolling maximum/minimum is a rolling statistic used to calculate the well known stochastic oscillator and Donchian channel indicator.
We can also compute rolling quartiles, which can be obtained using a percentage of 25 or 75, with one of 25 returning the lower quartile and 75 the upper quartile.
In blue the upper rolling quartile (%75), in orange the lower rolling quartile (%25), both using a window size of 100.
Details
In order to compute a rolling percentile nearest rank, we must first take the most recent length closing prices, then order them in ascending order, we then return the value of the ordered observations at index (percentage/100*length) - 1 (we use - 1 because our array index starts at 0).
High/Low meterUsing the new 'pinescript' array support to build an High/Low tunnel meter.
Using the Array to save only X HIGHEST HIGHS and Y LOWEST LOWS.
By the X and Y i build a tunnel - X is the top line (highs) and Y bottom line (lows)
Green - Up Trending
Red - Down Trending
Yellow - Reversal / drawback might occur.

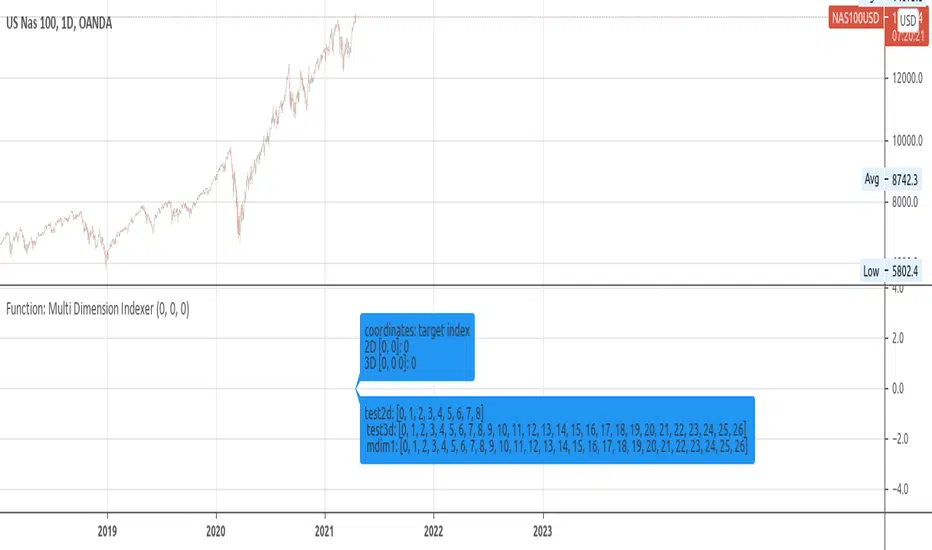
Function: Multi Dimension IndexerDescription:
A Function that returns the flat index of a N dimensions array.
Inputs:
_indices: Array containing dimension indices.¹
_limits: Array containing dimension size.¹
Note:
¹: _indices and _limits size must match. indices must be within dimension size.
Outputs:
_offset: the flat 1D index.
Resources:
eli.thegreenplace.net
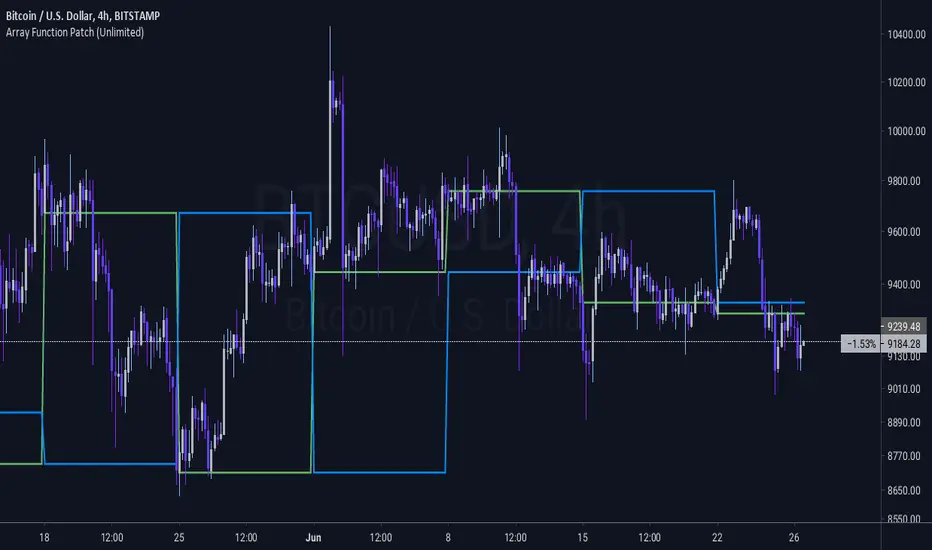
Array Function Patch (Unlimited)This is an educational script about utilizing array function in pine script.
The provided example within records the opening price of days or weeks and can be plotted on lower timeframes. It may or may not be useful.
Further information is provided inside the source code.
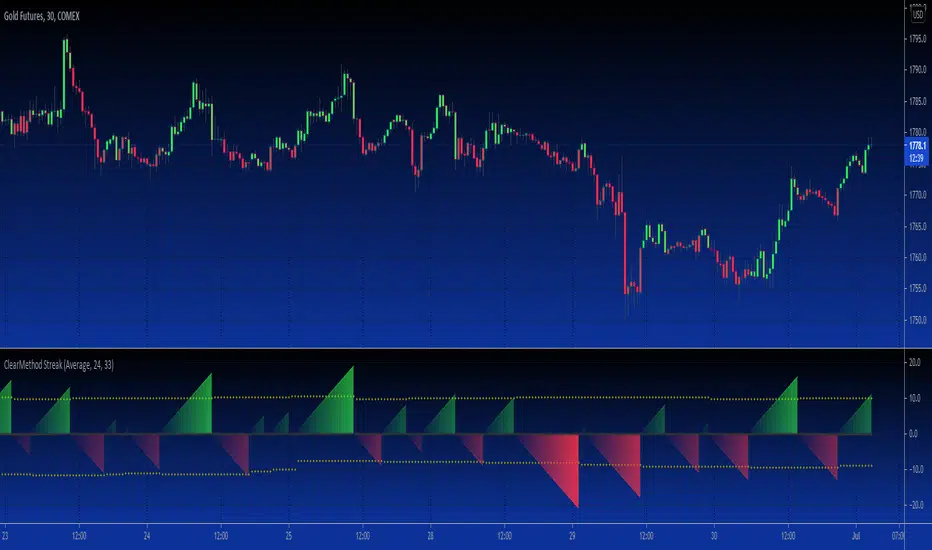
B3 Clear Method Streak CountAbout Clear Method -- to repeat my prior post on the bar painter script:
This indicator is translated out of Technical Analysis of Stocks & Commodities , September 2010, (I take zero design credit). The script simply looks for the price action to break or "clear" the most recent action, and only changes the paintbar color if the action indeed clears the previous candles. Simple to use, just add to your chart from your favorites and change the colors in the UI. It does the rest.
This version can replace my previous Clear Method Bar Painter as it also paints the bars.
What is different is this share is a lower study that counts the streak of the bars shown via histogram.
The way to use the streak is to notice the previous streaks and get a sense of how long the current trend is lasting versus prior trends of the same direction.
@Tradestation recently posted their "price streak" study, and this one is quite similar in nature.
Enjoy, the code open to view,
_B3
d^.^b
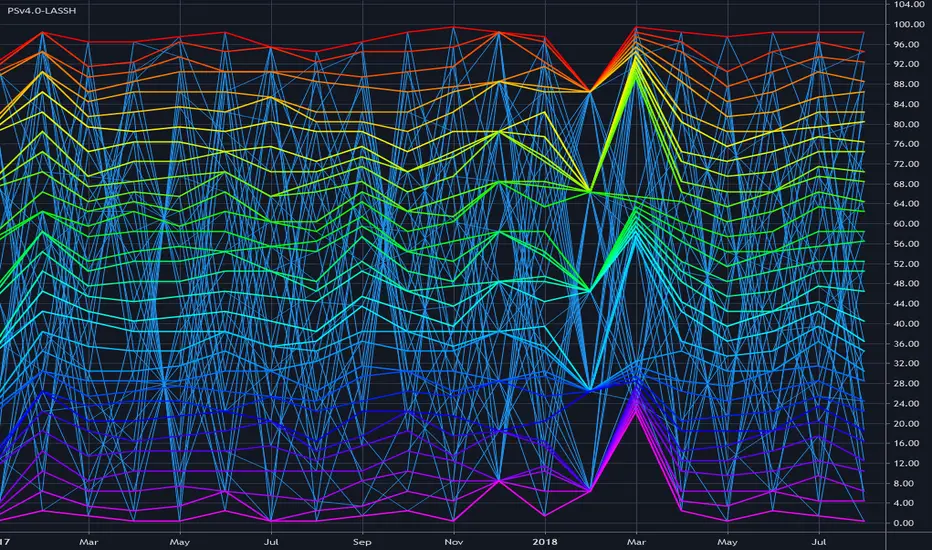
PSv4.0 Limited Array Support Super HackThis is my "PSv4.0 Limited Array Support Super Hack", derived from MichelT's Workaround for Arrays in pine and Bubble sort script, except this utilizes line.new() to obtain one array with up to 100 indices. I provided functions that may be syntactically comparable in operation to the array class we should get with PSv5.0 when that arrives. I have no clue when that ETA shall be either, so your guess is as good as mine. Due to the complexity of the script, I would ONLY recommend this script's functions for reuse by advanced Pine programmers, not newcomers to Pine Script.
Notice: FYI, support for these functions will be limited to only errata with the included functions. Honestly, I don't have an abundance of time on a daily basis to assist members with incorporation into their newly developed scripts. I hope you will understand.
The intention of this script is to provide Pine developers with one large array having up to 100 indices until we have full native array support in the future. Availability of full use of the array is only obtained when bar_index is indicesCount-1, so bear that in mind. This script is so computationally expensive, I would only advise using it "as is" on 5Y and All Charts at it's current initial release. On smaller sampling rates such as 1D, 5D and 1M... it has a tendency to encounter runtime errors such as this message: "Calculation timed out. Remove the indicator and reapply it to the chart". I just switch to a larger sampling interval - 5Y or All. I believe this is occurring due mostly to prng() generating thousands of random floating point numbers, PLUS the overhead of using line.new() for something it wasn't originally intended for. It does also use 64 plots in full color, maxing out the plotting capabilities of Pine as well. With usage of the array functions alone in your code, I anticipate those scripts to be more server friendly.
Basically this scripts functionality, as is, generates 32 pseudorandom numbers per bar in a sky blue birds nest of random numbers. It then sorts them numerically and plots them once again in a visually stunning rainbow spectrum. You will notice the plot()s colors will invert when the sorting order is changed in Settings. I commented out a lot of plot()s because we are limited to a maximum of 64 plot()s. By commenting and uncommenting with highlighted text blocks and + , you may alter the scripts appearance when done properly.
Overall, I hope you find it useful with incorporating expected array functionality that will perpetuate the novel development of next generation indicators in Pine Script version 4.0 . Once again, check out MichelT's brilliantly crafted script mentioned above. You may be able to use both scripts incorporated into an all-in-one to have dual array support, BUT I have not tested this yet, be forewarned. I hope the community contribution of this script in open source is of some benefit to those who can utilize it properly. As always, I have included advanced Pine programming techniques that conform to proper "Pine Etiquette", so this script is more than just a complex array provision...
The comments section below is solely just for commenting and other remarks, ideas, compliments, etc... regarding only this indicator, not others. When available time provides itself, I will consider your inquiries, thoughts, and concepts presented below in the comments section, should you have any questions or comments regarding this indicator. When my indicators achieve more prevalent use by TV members, I may implement more ideas when they present themselves as worthy additions. As always, "Like" it if you simply just like it with a proper thumbs up, and also return to my scripts list occasionally for additional postings. Have a profitable future everyone!
Data structure map[string, float]The script shows a workaround for map in pine-script via drawings.
There are few restrictions with them:
1. The size of the map cannot be more that amount of allowed drawings (about 40 by now)
2. Because the map shares the space of drawings throughout the whole script, using drawings with the map must be careful, with handly creating and removing of each drawing, because otherwise pine's garbage collector might break the stack. I'd recommend not using more drawings with the map.
3. setters and getters must be called on every bar, because of implementation of functions in pine there are inner serieses, which must be updated on every bar. So wherever you have a setter or getter in the code - it must be called on every bar. But if it's just an update, then you should pass 'false' as a param of the funtion.
The script shows a way to work with the map: filling it with some tickers and values for each of it and then plot the value if the symbol on the chart equals to one of the tickers in the map.
And there are some examples of updating of the value and removing of the item from the map.

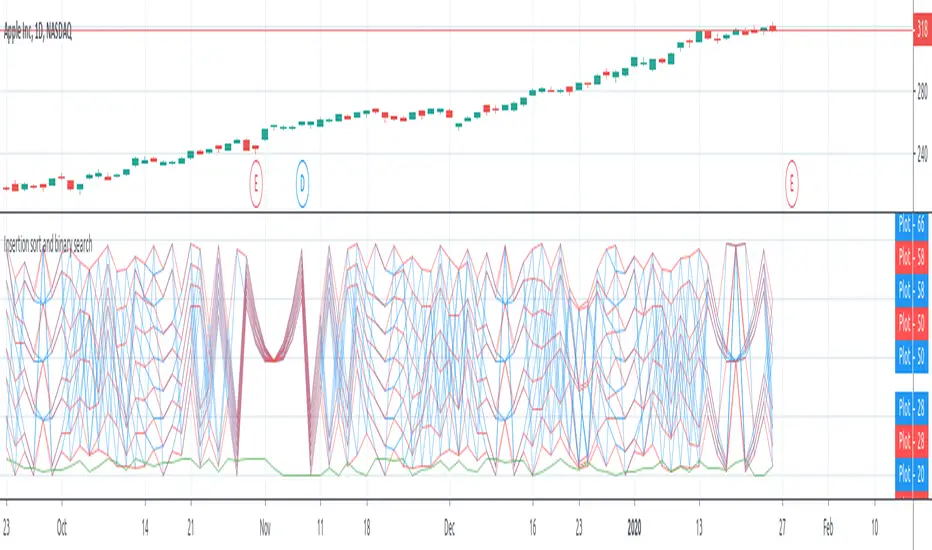
Insertion sort and binary searchThe script shows a workaround for arrays in pine-script via drawings.
There are few restrictions with them:
1. The length of the array cannot be more that amount of allowed drawings (about 40 by now)
2. Because the "array" shares the space of drawings throughout the whole script, using drawings with the "array" must be careful, with handly creating and removing of each drawing, because otherwise pine's garbage collector might break the "array"
3. Getter and Setter must be called on every bar, because of implementation of functions in pine there are inner serieses, which must be updated on every bar. So wherever you have a setter or getter in the code - it must be called on every bar. But if it's just an update, then you should pass 'false' as a param of the funtion.
The script also shows an example of implementation of Insertion sort of the array in pine: when the array have been created, it's filled with pseudo-random numbers and sorted on every bar. There are plotting of the array's numbers before/after soring to show the sorting result.
There's also an example of implementation of binary search: after generation elements of the array, the first element is kept in local variable and after sorting of the array, the scripts is looking for new element's position via binary search and then plot that new index in an array (last plotted value with the green color)
Workaround for Arrays in pine and Bubble sortThe script shows a workaround for arrays in pine-script via drawings.
There are few restrictions with them:
1. The length of the array cannot be more that amount of allowed drawings (about 40 by now)
2. Because the "array" shares the space of drawings throughout the whole script, using drawings with the "array" must be careful, with handly creating and removing of each drawing, because otherwise pine's garbage collector might break the "array"
3. Getter and Setter must be called on every bar, because of implementation of functions in pine there are inner serieses, which must be updated on every bar. So wherever you have a setter or getter in the code - it must be called on every bar. But if it's just an update, then you should pass 'false' as a param of the funtion.
The script also shows an example of implementation of bubble sort of the array in pine: when the array have been created, it's filled with pseudo-random numbers and sorted on every bar. There are plotting of the array's numbers before/after soring to show the sorting result.

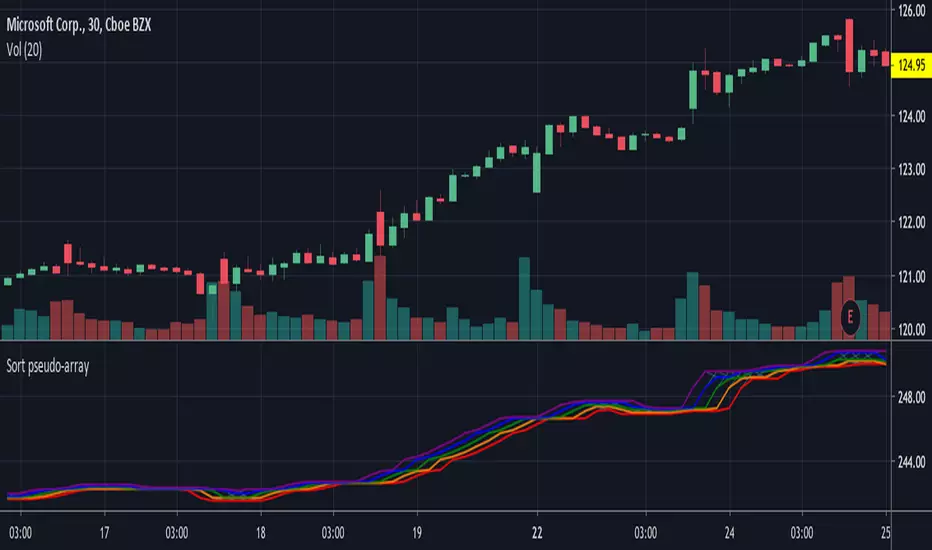
Sort pseudo-array v3Based on Sort pseudo-array v2 by apozdnyakov
- fixed issue where if the same number is repeated in the list it gets skipped
- replaced hardcoded 10000 and -10000 values with na in case those values are in the list
- added sort_all to demonstrate how to sort a list if the length is fixed
Function Locked Enumeratorreturns the value at index, can be used if you want to compare/select multiple values from different series and need to simulate a array/enumerator.
