VIX Option Hedge Monitor# VIX Option Hedge Monitor
Inspired by Cem Karsan
The VIX Option Hedge Monitor is a specialized indicator designed to detect unusual hedging activity in VIX call options that may signal impending market volatility or potential market crashes. By monitoring deep out-of-the-money (OTM) VIX calls that are 1-2weeks out—typically 150-170% OTM with premiums around $0.05-$0.10—this indicator identifies when institutional players are aggressively hedging for tail risk events.
## What It Does
This indicator tracks the intraday percentage change of a specific VIX option contract from its daily opening price and provides two distinct alert levels:
- **🟠 Orange Alert (200%+ increase)**: "Increased Hedging" - Indicates elevated hedging activity
- **🔴 Red Alert (400%+ increase)**: "Crash Imminent" - Suggests extreme hedging behavior often seen before major market dislocations
## Why This Matters
Deep OTM VIX calls are typically used by institutional investors as insurance against severe market crashes. When these options suddenly spike in price, it often indicates that sophisticated market participants are positioning for significant volatility. Historically, extreme spikes in these types of options have preceded major market corrections.
## How to Use
### Initial Setup
1. **Add the Indicator**
- Open TradingView and click on "Indicators" at the top of your chart
- Search for "VIX Option Hedge Monitor"
- Click to add it to your chart
2. **Find Your VIX Option Ticker**
- Go to VIX options chain in TradingView
- Find an expiration date that is more than 1 week out but less than 4 weeks out
- Locate a call strike approximately 168% OTM (these typically trade at $0.05-$0.10)
- Note the exact option ticker symbol (e.g., VIX260121C37.0)
3. **Configure the Indicator**
- Click on the gear icon next to "VIX Option Hedge Monitor" in your indicator list
- In the "VIX Option Symbol" field, paste your option ticker
- Adjust thresholds if desired (default: 200% orange, 400% red)
- Click "OK"
### Setting Up Alerts (Recommended)
1. Click the three dots (⋮) next to the indicator name
2. Select "Add alert on VIX Option Hedge Monitor"
3. Choose your alert condition:
- "Increased Hedging Alert" for the 200% threshold
- "Crash Hedge Behavior Alert" for the 400% threshold
4. Configure how you want to receive alerts (popup, email, SMS, etc.)
5. Click "Create"
### Ongoing Maintenance
**Rolling to New Expiration:**
When your current option is within 7 days of expiration, you'll need to update to a new option:
1. Find a new VIX call option meeting the criteria (1-3 weeks out, ~168% OTM)
2. Open the indicator settings (gear icon)
3. Update the "VIX Option Symbol" field with the new ticker
4. Click "OK"
The indicator will immediately begin tracking the new option.
## Understanding the Display
### Info Table (Top Right)
- **Option**: Current option ticker being monitored
- **Current Price**: Real-time option price
- **Day Open**: Option's opening price for the current trading day
- **% Change**: Percentage increase from day open
- **Status**: Current alert level (Normal, Increased Hedging, or Crash Imminent)
### Chart Elements
- **Blue Line**: Option price movement
- **White Line**: Percentage change from daily open
- **Orange Dashed Line**: 200% threshold marker
- **Red Dashed Line**: 400% threshold marker
- **Triangle Markers**: Appear when thresholds are crossed
- **Background Color**: Changes to orange or red when alerts are triggered
## Settings & Customization
### Adjustable Parameters
**VIX Option Symbol** (Required)
- The exact ticker of the VIX option you want to monitor
- Must be updated manually when rolling to new expirations
- Example: VIX250131C00055000
**Orange Alert Threshold** (Default: 200%)
- Percentage increase from day open to trigger "Increased Hedging" alert
- Adjust higher for fewer false positives or lower for earlier warnings
**Red Alert Threshold** (Default: 400%)
- Percentage increase from day open to trigger "Crash Imminent" alert
- Represents extreme hedging behavior
**Show % Change Line** (Default: On)
- Toggle visibility of the percentage change line
**Show Price Line** (Default: On)
- Toggle visibility of the option price line
## Trading Strategy Considerations
### This Indicator Is:
- A early warning system for potential market volatility
- A tool to monitor institutional hedging behavior
- Most effective when combined with other technical and fundamental analysis
### This Indicator Is NOT:
- A standalone trading signal
- A guarantee of market crashes
- A timing tool (alerts may come hours or days before events)
### Best Practices:
1. **Don't trade solely on this indicator** - Use it as one input among many
2. **Monitor throughout the day** - Set alerts but also check manually
3. **Consider market context** - High VIX environments may see more false signals
4. **Roll options weekly** - Keep your monitored option in the 1-3 week window
5. **Track multiple strikes** - Consider monitoring 2-3 different strikes for confirmation
## Technical Notes
- The indicator uses daily open as the baseline for percentage calculations
- Price data refreshes based on your chart timeframe
- Works best on intraday timeframes (1min - 15min) for quick alerts
- Requires TradingView access to options data for the ticker you specify
## Interpretation Guide
**Normal Operation** (0-199% increase)
- Market functioning normally
- Standard hedging activity
- No action required
**Increased Hedging** (200-399% increase)
- Heightened caution warranted
- Consider reviewing portfolio hedges
- Monitor closely for further escalation
- May indicate near-term volatility concerns
**Crash Imminent** (400%+ increase)
- Extreme hedging activity detected
- Institutional players positioning for severe downside
- Consider defensive positioning
- Review stop losses and portfolio allocation
- Historical precedent suggests elevated crash risk
## Limitations
- Requires manual option ticker updates
- Cannot automatically select optimal strikes
- Low liquidity options may show erratic price movements
- False signals possible during high volatility periods
- Past performance does not guarantee future results
## Support & Updates
For questions, suggestions, or to report issues, please leave a comment on the indicator page.
## Disclaimer
This indicator is for informational and educational purposes only. It does not constitute financial advice, investment recommendations, or trading signals. Always conduct your own research and consult with a qualified financial advisor before making investment decisions. Options trading carries significant risk and may not be suitable for all investors.
---
**Version**: 1.0
**Last Updated**: January 2026
**Compatible With**: TradingView Pine Script v5
Behavior

Candle Emotion Oscillator [CEO]Candle Emotion Oscillator (CEO) - Revolutionary User Guide
🧠 World's First Market Psychology Oscillator
The Candle Emotion Oscillator (CEO) is a groundbreaking indicator that measures market emotions through pure candle price action analysis. This is the first oscillator ever created that translates candle patterns into psychological states, giving you unprecedented insight into market sentiment.
🚀 Revolutionary Concept
What Makes CEO Unique
100% Pure Price Action: No volume, no external data - just candle analysis
Market Psychology: Measures actual emotions: Fear, Greed, Panic, Euphoria
Never Been Done Before: First oscillator to analyze market emotions
Exhaustion Prediction: Detects emotional fatigue before reversals
Fast Response: Perfect for your 2-5 minute scalping setup
The Four Core Emotions
🟢 GREED (Positive Values)
What it measures: Market conviction and decisiveness
Candle Pattern: Large bodies, small wicks
Psychology: Traders are confident and decisive
Oscillator: Positive values (0 to +100)
Trading Implication: Trend continuation likely
🔴 FEAR (Negative Values)
What it measures: Market uncertainty and indecision
Candle Pattern: Small bodies, large wicks
Psychology: Traders are uncertain and hesitant
Oscillator: Negative values (0 to -100)
Trading Implication: Consolidation or reversal likely
🚀 EUPHORIA (Extreme Positive)
What it measures: Excessive optimism and buying pressure
Candle Pattern: Large green bodies with upper wicks
Psychology: Extreme bullish sentiment
Oscillator: Values above +60
Trading Implication: Overbought, reversal warning
💥 PANIC (Extreme Negative)
What it measures: Capitulation and selling pressure
Candle Pattern: Large red bodies with lower wicks
Psychology: Extreme bearish sentiment
Oscillator: Values below -60
Trading Implication: Oversold, reversal opportunity
📊 Visual Elements Explained
Main Components
Thick Colored Line: Primary emotion oscillator
Green: Greed (positive emotions)
Red: Fear (negative emotions)
Bright Green: Euphoria (extreme positive)
Dark Red: Panic (extreme negative)
Thin Blue Line: Emotion trend (longer-term context)
Background Gradient: Emotional intensity
Darker = stronger emotions
Lighter = weaker emotions
Diamond Signals: 🔶 Emotional exhaustion detected
Rocket Signals: 🚀 Extreme euphoria warning
Explosion Signals: 💥 Extreme panic warning
Information Table (Top Right)

Even vs Odd Weeks Performance█ OVERVIEW
The Even vs Odd Weeks Performance indicator is designed to visualise and compare the performance of even-numbered weeks versus odd-numbered weeks. This indicator explores one of the many calendar based anomalies that exist in financial markets.
In the context of financial analysis, a calendar based anomaly refers to patterns or tendencies that are linked to specific time periods, such as days of the week, weeks of the month, or months of the year. This indicator helps explore whether such a calendar based anomaly exists between even and odd weeks.
By calculating cumulative weekly performance and counting the number of weeks with positive returns, it provides a clear snapshot of whether one set of weeks tends to outperform the other, potentially highlighting a calendar based anomaly if a significant difference is observed.
█ FEATURES
Customisable time window through input settings.
Tracks cumulative returns for even and odd weeks separately.
Easily adjust table settings like position and font size via input options.
Clear visual distinction between even and odd week performance using different colours.
Built-in error checks to ensure the indicator is applied to the correct timeframe.
█ HOW TO USE
Add the indicator to a chart with a Weekly timeframe.
Choose your start and end dates in the Time Settings.
Enable or disable the performance table in the Table Settings as needed.
View the cumulative performance, with even weeks in green and odd weeks in red.

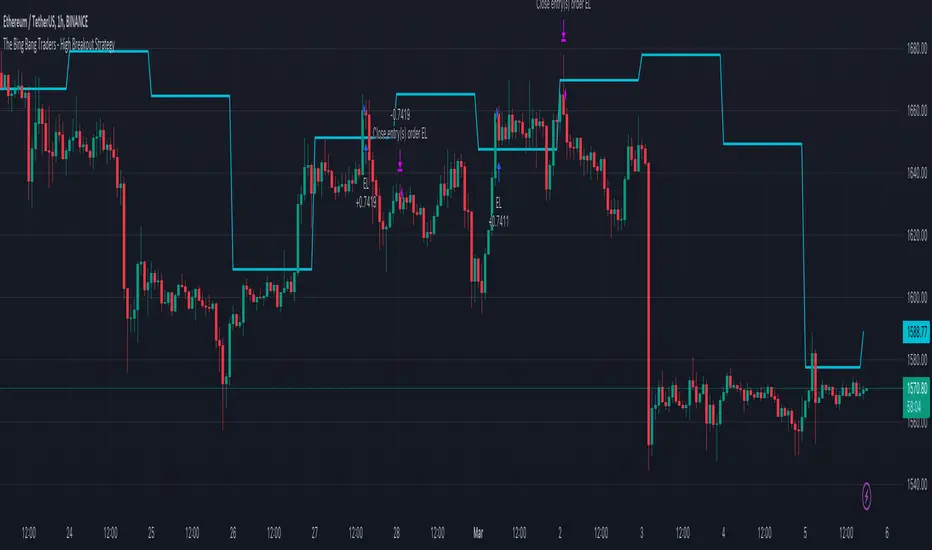
TheBigBangTraders BreakoutName: TheBigBangTraders Breakout
Category: Trend Follower
Operating mode: Spot
Trades duration: Intraday
Timeframe: 1H
Suggested usage: the purpose of this strategy is to help to investigate if the asset is sensitive to breakout approach.
Entry: Trigger point can be choose by the user between:
High of the N days ago
High of the N weeks ago
Exit: End of Day
Usage:
⁃ It can be useful to use this script to test the behaviour of a definite asset
⁃ This is a raw system that can be considered a base to realize a complete breakout strategy
Configuration:
- N/A
Backtesting
⁃ Exchange: BINANCE
⁃ Pair: ETHUSDT
⁃ Timeframe: !H
⁃ Fee 0.075%
⁃ Slippage 0
- Start : 2020-01-03
How you or we can improve? Source code is open so share your ideas!
Visualizing Behaviors of barstate VariablesThe title pretty much sums up what this script does. It's intended for Pine Script developers, but especially for newcomers to Pine Editor contemplating the use of barstate variables. I would recommend using this on 15 second or 1 minute chart intervals for a quick and obvious analysis of barstate behaviors.
These barstate variables change from TRUE to FALSE or FALSE to TRUE during specific times/conditions of script operation. One unique state you might not ever see change is barstate.isfirst. This is only TRUE when bar_index==0, most easily viewed on the monthly "All" chart on the far left. I provided a label displaying the current bar_index for perspective. I hope this provides an improved grasp of barstate understanding for fellow members, as it did for myself.
When available time provides itself, I will consider your inquiries, thoughts, and concepts presented below in the comments section, should you have any questions or comments regarding this indicator. When my indicators achieve more prevalent use by TV members , I may implement more ideas when they present themselves as worthy additions. Have a profitable future everyone!

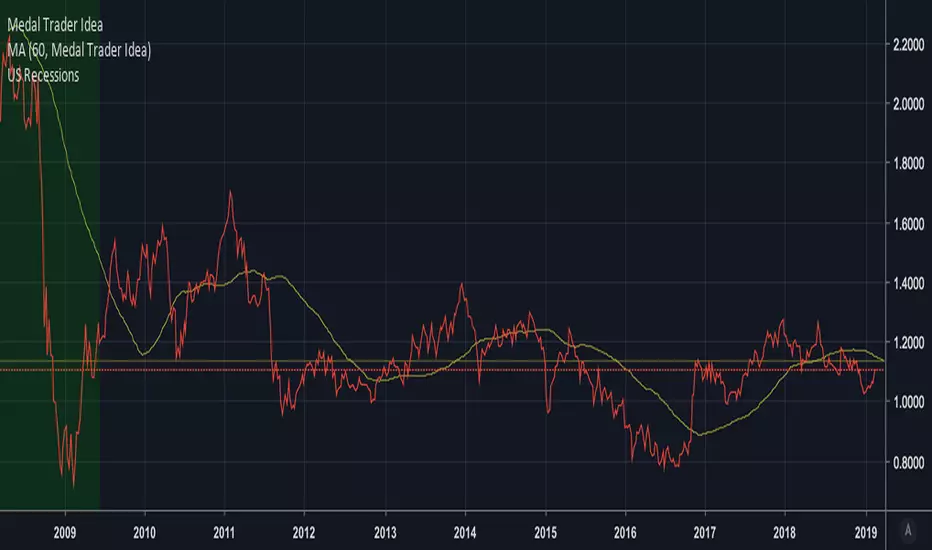
Medal Trader Idea [Xiaolai(Sean) Chen]During the podcast of "winning the great game", Adam Robinson share his thought about Medal Traders disagree with Bond traders and Medal Traders will always trump.
Medal Trader Idea = Copper Future / Gold Future
when up, means Medal Trader has a good expectation of the future economy