Praetor Sentinel V11.2 NOLOOSE BETA📈 Praetor Sentinel V11.2 – "NOLOOSE BETA"
Algorithmic Trading Strategy for Trend Markets with Adaptive Risk Management
Praetor Sentinel V11.2 is an advanced algorithmic trading strategy for TradingView, specifically designed to operate in strong trend conditions. It combines multiple technical systems—including dynamic trend filters, multi-layer EMA structures, ADX-based volatility control, and adaptive trailing stops—into a powerful and automated trading framework.
🔧 Core Features
Multi-EMA Trend Detection: Two EMA pairs (short/long) to identify and confirm directional trends.
XO-EMA Breakout Logic: Fast EMA crossover to detect breakout opportunities.
ADX Trend Filter: Trades only during strong market trends (above custom ADX threshold).
HTF Filter: Optional higher timeframe trend confirmation (e.g. Daily 50 EMA).
VWAP Validation: Ensures entries aren't taken against the volumetric average.
RSI Filter: Adds a momentum filter (e.g. RSI > 50 for long trades).
🎯 Entry Signals
The strategy uses two entry types:
Breakout Entries: Based on XO-EMA cross and multi-EMA trend alignment.
Pullback Entries: Configurable via various methods such as EMA21 reentry, RSI reversal, engulfing candles, or VWAP reclaim.
All entries can be delayed via confirmation candle logic, requiring a bullish or bearish follow-up bar.
🛡️ Risk Management & Exit Logic
Dynamic ATR Trailing Stop: Adjusts stop distance according to market volatility with optional swing high/low protection.
Break-Even Logic: Locks in trades at breakeven once a defined profit is reached.
Hard Stop-Loss: Caps potential loss per trade with a fixed % (e.g. 1%).
Safe Mode ("NOLOOSE"): Exits early if price moves too far against the position — ideal for automated bots that must avoid drawdowns.
🤖 Automation & Alerts
This strategy is fully automatable with services like 3Commas using built-in alert messages for entries and exits.
All parameters are fully configurable to adapt to different assets, timeframes, and trading styles.
⚙️ Additional Features
Configurable leverage & position sizing
Time-based trading window
Built-in Anchored VWAP
Modular design for easy extension
📌 Summary
Praetor Sentinel V11.2 is a professional-grade tool for trend traders who want rule-based entry/exit logic, adaptive stop systems, and robust protection features. When paired with automation tools, it offers a reliable, low-maintenance setup that emphasizes safety, structure, and scalability.
🛠 How to Use Praetor Sentinel V11.2 – NOLOOSE BETA
🔍 1. Basic Configuration (Required)
Setting Description
Enable Long Trades Enables long (buy) positions.
Enable Short Trades Enables short (sell) positions.
Leverage Used for position sizing calculations.
Position Size % Defines % of capital to be used per trade.
⏰ 2. Time Filter (Optional)
Restricts trading to a defined time range.
Setting Description
Start Date Start date for strategy to be active.
End Date End date for strategy to stop.
Time Zone Time zone for above settings.
📊 3. Trend Setup (Essential for Entry Signals)
Setting Description
MA Type Type of moving average: EMA or SMA.
EMA1/2 Short & Long Two EMA-based systems to determine trend.
Fast/Slow EMA (XO) Used for crossover breakout detection.
HTF Filter Uses higher timeframe trend for additional confirmation.
RSI Filter Confirms entries only if momentum (RSI) supports it.
ADX Threshold Ensures trades only occur during strong trends.
🎯 4. Entry Logic
Setting Description
Pullback Entry Type Enables optional entry setups:
"Off"
"EMA21"
"RSI"
"Engulfing"
"VWAP"
| Use Confirmation Candle | Entry is delayed until a confirmation bar appears. |
| VWAP Confirmation | Trade only if price is above/below the VWAP (based on direction). |
Note: You can combine breakout + pullback signals. Only one has to trigger.
🧯 5. Risk Control & Exit Settings
Setting Description
Trailing Stop Mode
"Standard": Classic trailing stop
"Dynamic ATR": Adjusts to current volatility
"Dynamic ATR + Swing": Adds swing high/low buffer
| Enable Break-Even | Moves SL to breakeven once a target % gain is reached. |
| Enable Hard Stop-Loss | Fixed stop-loss (e.g. 1%) to cap trade risk. |
| Enable Safe Mode | Exits trade early if price moves against it beyond defined % (e.g. 0.3%). |
🔔 6. Alerts & Bot Automation
Setting Description
Entry Long/Short Msg Text message sent via alert when a position opens.
Exit Long/Short Msg Alert message for stop-loss/exit logic.
How to automate with 3Commas:
Load the strategy on your chart.
Manually create alerts using "Create Alert" in TradingView.
Use the built-in alert_message values for bot integration.
✅ Recommended Settings (Example for BTC/ETH on 1H)
Long & Short: ✅ Enabled
Leverage: 2.0
Timeframe: 1H
Pullback Entry: "EMA21"
MA Type: EMA
HTF Filter: Enabled (Daily EMA50)
RSI Filter: Enabled
VWAP Filter: Enabled
Break-Even: On at 0.5%
Hard SL: 1.0%
Safe Mode: On at -0.3%
Trailing Stop: "Dynamic ATR + Swing"
📘 Pro Tips for Testing & Customization
Use the Strategy Tester in TradingView to analyze performance over different assets.
Experiment with timeframes and entry modes.
Ideal for trending assets like BTC, ETH, SOL, etc.
You can expand it with take-profit logic, fixed TPs, indicator exits, etc.
Bitcoinstrategy

Crypto Punk [Bot] (Zeiierman)█ Overview
The Crypto Punk (Zeiierman) is a trading strategy designed for the dynamic and volatile cryptocurrency market. It utilizes algorithms that incorporate price action analysis and principles inspired by Geometric Brownian Motion (GBM). The bot's core functionality revolves around analyzing differences in high and low prices over various timeframes, estimating drift (trend) and volatility, and applying this information to generate trading signals.
█ How to use the Crypto Punk Bot
Utilize the Crypto Punk Bot as a technical analysis tool to enhance your trading strategy. The signals generated by the bot can serve as a confirmation of your existing approach to entering and exiting the market. Additionally, the backtest report provided by the bot is a valuable resource for identifying the optimal settings for the specific market and timeframe you are trading in.
One method is to use the bot's signals to confirm entry points around key support and resistance levels.
█ Key Features
Let's explain how the core features work in the strategy.
⚪ Strategy Filter
The strategy filter plays a vital role in the entries and exits. By setting this filter, the bot can identify higher or lower price points at which to execute trades. Opting for higher values will make the bot target more long-term extreme points, resulting in fewer but potentially more significant signals. Conversely, lower values focus on short-term extreme points, offering more frequent signals focusing on immediate market movements.
How is it calculated?
This filter identifies significant price points within a specified dynamic range by applying linear regression to the absolute deviation of the range, smoothing out fluctuations, and determining the trend direction. The algorithm then normalizes the data and searches for extreme points.
⚪ External AI filter
The external AI filter allows traders to incorporate two external sources as signal filters. This feature is particularly useful for refining their signal accuracy with additional data inputs.
External sources can include any indicator applied to your TradingView chart that produces a plot as an output, such as a moving average, RSI, supertrend, MACD, etc. Traders can use these indicators of their choice to set filters for screening signals within the strategy.
This approach offers traders increased flexibility to select filters that align with their trading style. For instance, one trader might prefer to take trades when the price is above a moving average, while another might opt for trades when the MACD is below the MACD signal line. These external filters enable traders to choose options that best fit their trading strategies. See the example below. Note that the input sources for the External AI filter can be any indicator applied to the chart, and the input source per se does not make this strategy unique. The AI filter takes the selected input source and applies our function to it. So, if a trader selects RSI as an input filter, RSI is not unique, but how the source is computed within the AI functions is.
How is it calculated?
Once the external filters are selected and enabled within the settings panel, our AI function is applied to enhance the filter's ability to execute trades, even when the set conditions of the filter are not met. For instance, if a trader wants to take trades only when the price is above a moving average, the AI filter can actually execute trades even if the price is below the moving average.
The filter works by combining k-nearest Neighbors (KNN) with Geometric Brownian Motion (GBM) involves first using GBM to model the historical price trends of an asset, identifying patterns of drift and volatility. KNN is then applied to compare the current market conditions with historical instances, identifying the closest matches based on similar market behaviors. By examining the drift values of these nearest historical neighbors, KNN predicts the current trend's direction.
The AI adaptability value is a setting that determines how flexible the AI algorithm is when applying the external AI filter. Setting the adaptability to 10 indicates minimal adaptability, suggesting that the bot will strictly adhere to the set filter criteria. On the other hand, a higher adaptability value grants the algorithm more leeway to "think outside the box," allowing it to consider signals that may not strictly meet the filter criteria but are deemed viable trading opportunities by the AI.
█ Examples
In this example, the RSI is used to filter out signals when the RSI is below the smoothing line, indicating that prices are declining.
Note that the external filter is specifically designed to work with either 'LONG ONLY' or 'SHORT ONLY' modes; it does not apply when the bot is set to trade on 'BOTH' modes. For 'LONG ONLY' positions, the filter criteria are met when source 1 is greater than source 2 (source 1 >= source 2). Conversely, for 'SHORT ONLY' positions, the filter criteria require source 1 to be less than source 2 (source 1 <= source 2).
Examples of Filter Usage:
Long Signals: To receive long signals when the closing price is higher than a moving average, set Source 1 to the 'close' price and Source 2 to a moving average value. This setup ensures that signals are generated only when the closing price exceeds the moving average, indicating a potential upward trend.
█ Settings
⚪ Set Timeframe
Choosing the correct entry and exit timeframes is crucial for the bot's performance. The general guideline is to select a timeframe that is higher than the one currently displayed on the trading chart but still relatively close in duration. For instance, if trading on a 1-minute chart, setting the bot's Timeframe to 5 minutes is advisable.
⚪ Entry
Traders have the flexibility to configure the bot according to their trading strategy, allowing them to choose whether the bot should engage in long positions only, short positions only or both. This customization ensures that the bot aligns with the trader's market outlook and risk tolerance.
⚪ Pyramiding
Pyramiding functionality is available to enhance the bot's trading strategy. If the current position experiences a drawdown by a specified number of points, the bot is programmed to add new positions to the existing one, potentially capitalizing on lower prices to average down the entry cost. To utilize this feature, access the settings panel, navigate to 'Properties,' and look for 'Pyramiding' to specify the number of times the bot can re-enter the market (e.g., setting it to 2 allows for two additional entries).
⚪ Risk Management
The bot incorporates several risk management methods, including a regular stop loss, trailing stop, and risk-reward-based stop loss and exit strategies. These features assist traders in managing their risk.
Stop Loss
Trailing Stop
⚪ Trading on specific days
This feature allows trading on specific days by setting which days of the week the bot can execute trades on. It enables traders to tailor their strategies according to market behavior on particular days.
⚪ Alerts
Alerts can be set for entry, exit, and risk management. This feature allows traders to automate their trading strategy, ensuring timely actions are taken according to predefined criteria.
█ How is Crypto Punk calculated?
The Crypto Punk Bot is a trading bot that utilizes a combination of price action analysis and elements inspired by Geometric Brownian Motion (GBM) to generate buy and sell signals for cryptocurrencies. The bot focuses on analyzing the difference between high and low prices over various timeframes, alongside estimates of drift (trend) and volatility derived from GBM principles.
Timeframe Analysis for Price Action
The bot examines multiple timeframes (e.g., daily, weekly) to identify the range between the highest and lowest prices within each period. This range analysis helps in understanding market volatility and the potential for significant price movements. The algorithm calculates the trading range by applying maximum and minimum functions to the set of prices over your selected timeframe. It then subtracts these values to determine the range's width. This method offers a quantitative measure of the asset's price volatility for the specified period.
Estimating Drift (Trend)
The bot estimates the drift component, which reflects the underlying trend or expected return of the cryptocurrency. The algorithm does this by estimating the drift (trend) using Geometric Brownian Motion (GBM), which involves determining an asset's average rate of return over time, reflecting the asset's expected direction of movement.
Estimating Volatility
Volatility is estimated by calculating the standard deviation of the logarithmic returns of the cryptocurrency's price over the same timeframe used for the drift calculation. Geometric Brownian Motion (GBM) involves measuring the extent of variation or dispersion in the returns of an asset over time. In the context of GBM, volatility quantifies the degree to which the price of an asset is expected to fluctuate around its drift.
Combining Drift and Volatility for Signal Generation
The bot uses the calculated drift and volatility to understand the current market conditions. A higher drift coupled with manageable volatility may indicate a strong upward trend, suggesting a potential buy signal. Conversely, a low or negative drift with increasing volatility might suggest a weakening market, triggering a sell signal.
█ Strategy Properties
This script backtest is done on the 1 hour chart Bitcoin, using the following backtesting properties:
Balance (default): 10 000 (default base currency)
Order Size: 10% of the equity
Commission: 0.05 %
Slippage: 500 ticks
Stop Loss: Risk Reward set to 1
These parameters are set to provide an accurate representation of the backtesting environment. It's important to recognize that default settings may vary for several reasons outlined below:
Order Size: The standard is set at one contract to facilitate compatibility with a wide range of instruments, including futures.
Commission: This fee is subject to fluctuation based on the specific market and financial instrument, and as such, there isn't a standard rate that will consistently yield accurate outcomes.
We advise users to customize the Script Properties in the strategy settings to match their personal trading accounts and preferred platforms. This adjustment is crucial for obtaining practical insights from the deployed strategies.
-----------------
Disclaimer
The information contained in my Scripts/Indicators/Ideas/Algos/Systems does not constitute financial advice or a solicitation to buy or sell any securities of any type. I will not accept liability for any loss or damage, including without limitation any loss of profit, which may arise directly or indirectly from the use of or reliance on such information.
All investments involve risk, and the past performance of a security, industry, sector, market, financial product, trading strategy, backtest, or individual's trading does not guarantee future results or returns. Investors are fully responsible for any investment decisions they make. Such decisions should be based solely on an evaluation of their financial circumstances, investment objectives, risk tolerance, and liquidity needs.
My Scripts/Indicators/Ideas/Algos/Systems are only for educational purposes!

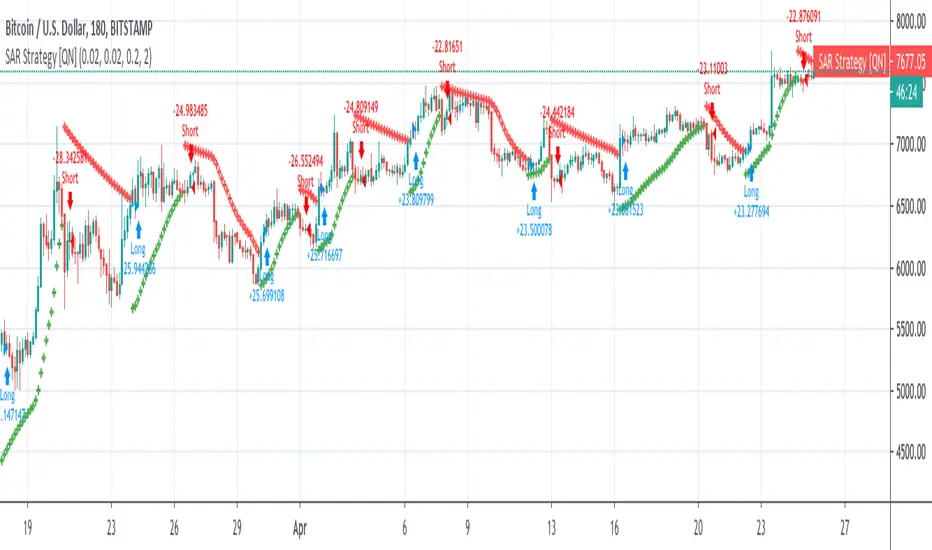
Parabolic SAR Strategy (on close) [QuantNomad]Created a Parabolic SAR strategy where price has to close under/above the level before for it to reverse. This way it should be a bit more stable and protect you from false breakouts.
It was impossible to adjust the built-in "sar" function so I implemented PSAR from scratch. So if you're interested in how it's work inside you can check the code and probably adjust to your need if you have a custom modification of PSAR in your mind.
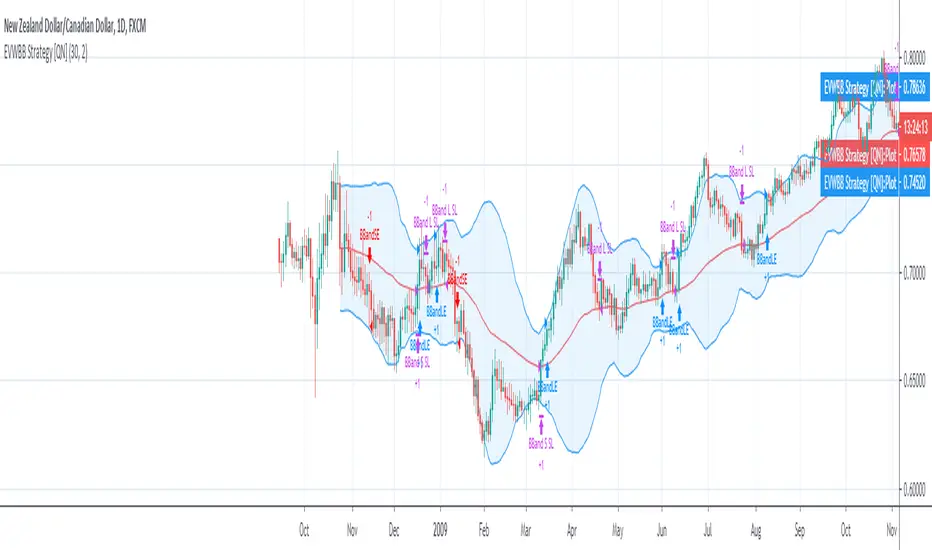
EVWBB Strategy [QuantNomad]It's my new strategy using EVWMA (Elastic Volume Weighted Moving Average).
Now I created a Bollinger Bands strategy where basis level is EVWMA.
It looks pretty interesting but you have to be careful with the entries/exits on the same bar, I'm using stop orders, so on big moves it happens pretty often.
In the next version, I will try to eliminate these issues.
Entry for this strategy happens when price crossover upper for long and lower for short. I exit both short and long on basis level.