Live Ichimoku BOXThis indicator offers a unique "Visual" approach to the Ichimoku Kinko Hyo system. Instead of just plotting lines, it visualizes the mathematical logic behind the Tenkan-sen (9), Kijun-sen (26), and Span B (52) in real-time.
Core Concept: Ichimoku lines represent the equilibrium (50% level) of the High-Low range over a specific period. This tool draws Equilibrium Boxes to show exactly where these Highs and Lows are located relative to the current price.
Key Features:
Live Equilibrium Boxes: Visualizes the 9, 26, and 52-period ranges on the current live candle.
Mid-Lines: Clearly marks the equilibrium points (Tenkan, Kijun, Span B) within each box.
Vector Lines: Diagonal lines connecting the High and Low of each box to visualize momentum direction.
Fractals & Signals: Marks major pivots with Stars (*) and secondary pivots with Arrows.
Time Counters: Displays the candle count from the pivot to the current bar.
Future & Past: Visualizes the Chikou Span (lagging) and Future Cloud levels (leading) using dash lines.
Split-Color Background: distinct transparency for the upper and lower halves of the boxes for better trend identification.
How to Use: Use this tool to understand the market structure behind the Ichimoku lines. If the price is above the box's mid-line, the trend is bullish for that period. Aligned mid-lines indicate strong support/resistance levels.
این اندیکاتور یک دیدگاه کاملاً جدید و "بصری" (Visual) به سیستم ایچیموکو کینکو هیو (Ichimoku Kinko Hyo) ارائه میدهد. برخلاف اندیکاتورهای کلاسیک که فقط خطوط را رسم میکنند، این ابزار منطق محاسباتی پشت خطوط تنکانسن (۹)، کیجونسن (۲۶) و اسپن بی (۵۲) را در لحظه حال (Live) به تصویر میکشد.
فلسفه عملکرد: در ایچیموکو، خطوط بر اساس میانگینِ بالاترین قیمت (High) و پایینترین قیمت (Low) در یک دوره خاص محاسبه میشوند. این اندیکاتور با رسم باکسهای تعادلی (Equilibrium Boxes)، دقیقاً نشان میدهد که این سقف و کفها کجا هستند و قیمت در حال حاضر نسبت به "ناحیه تعادل" (۵۰٪ باکس) چه وضعیتی دارد.
ویژگیهای کلیدی:
🟥 باکسهای ۹، ۲۶ و ۵۲ دوره: نمایش محدوده نوسان قیمت در دورههای زمانی استاندارد ایچیموکو بر روی کندل زنده.
➖ خطوط میانی (Mid-Lines): نمایش دقیق محل تنکانسن، کیجونسن و اسپن بی به صورت خطوط دش یا ضخیم در وسط باکسها.
📐 بردارهای حرکتی (Vectors): رسم خطوط مورب داخل باکس که جهت و شتاب حرکت از High به Low (یا برعکس) را نشان میدهند.
✨ نقاط چرخش (Pivots): نمایش سقفها و کفهای ماژور با علامت ستاره (*) و نقاط برگشت فرعی با فلش (Arrows).
🔢 شمارشگر زمانی: نمایش تعداد کندلهای گذشته از سقف یا کف باکس تا لحظه حال.
🔮 آینده و گذشته: نمایش وضعیت چیکو اسپن (۲۵ کندل عقبتر) و ابرهای آینده (۲۵ کندل جلوتر) به صورت خطوط راهنما.
🎨 طراحی دو رنگ (Split Color): ناحیه بالای تعادل و پایین تعادل با شفافیتهای متفاوت نمایش داده میشوند تا تشخیص روند صعودی/نزولی در یک نگاه ساده باشد.
نحوه استفاده: این ابزار برای کسانی طراحی شده که میخواهند "چرایی" حرکت قیمت را درک کنند. وقتی قیمت بالای خط میانی باکس قرار دارد، خریداران در آن بازه زمانی کنترل را در دست دارند و برعکس. همپوشانی باکسها و خطوط میانی، نواحی قدرتمند حمایت و مقاومت را نشان میدهد.
BOX

Malama's Range BreakoutMalama's Range Breakout is a dynamic Pine Script v6 indicator designed to automatically detect periods of price consolidation (tight ranges) on any timeframe or market, visually highlight them with expandable boxes, and generate actionable signals for breakouts and wick-based reversals.
Key Features
Adaptive Consolidation Detection: Uses a volatility-adjusted threshold (ATR multiplier) over a user-defined lookback period to identify genuinely tight ranges, avoiding false detections in trending or high-volatility conditions.
Preset Profiles: Quickly switch between optimized settings for different trading styles:
Tight Ranges (Scalping): Short lookback, low threshold for frequent small-range setups.
Normal Ranges (Intraday): Balanced for day trading.
Swing Trading: Longer lookback for larger consolidations.
Options Selling (Chop): Very low threshold to capture extended sideways/choppy phases.
Custom: Full manual control.
Visual Elements: Draws semi-transparent boxes around detected ranges (with optional dashed midline), dynamically extending them until a valid breakout occurs. Limits historical boxes for clean charts.
Breakout Signals: Triggers buy/sell labels and alerts only on confirmed breakouts, optionally requiring a volume spike (above SMA threshold) for higher-probability momentum moves.
Wick Reversal Signals: Detects rejection wicks touching range boundaries (without closing outside), signaling potential fakeouts or early reversals. Optional next-bar confirmation (e.g., bearish candle after upper wick) reduces false signals.
Built-in Alerts: Separate alert conditions for range detection, bullish/bearish breakouts, and confirmed/unconfirmed wick reversals.
How It Works
The script continuously monitors the price range over the selected lookback period. When the range contracts below the ATR-based threshold, it initiates a consolidation box starting from the tightest point. The box expands with new highs/lows while price remains inside.
A true breakout closes outside the box (with optional volume confirmation) → ends the range and plots a directional signal.
Wicks probing boundaries without closing outside → flags potential rejection/reversal zones inside the range.
This combination helps traders anticipate volatility expansion after compression, while distinguishing strong momentum breakouts from traps/false breaks.
Why It's Useful
Unlike fixed-time Opening Range Breakout (ORB) tools or simple consolidation detectors, this indicator adapts to current market volatility (via ATR) and works across all timeframes—ideal for scalping tight intraday ranges, capturing swing consolidations, or identifying chop for premium-selling strategies. The volume filter and wick reversal detection add confluence, helping avoid low-conviction trades in ranging markets.
Usage Tips
Best on liquid assets (stocks, futures, forex, crypto).
Combine breakouts with trend filters (e.g., higher-timeframe EMA) for directional bias.
Use wick signals cautiously in strong trends—they shine in ranges or at key levels.
Test presets on your preferred timeframe; "Normal" is a solid default for most intraday work.
No repainting: All logic based on confirmed closes.

NY 8-11 Statistical Bias NQ 【Donkey】This indicator analyzes historical session patterns to predict directional bias during the NY 8:00-11:00 AM trading window for Micro NQ futures.
Simple Logic:
Monitors 3 sessions: Asian (20:00-02:00), London (02:00-08:00), NY (08:00-11:00)
Identifies current pattern based on: ranges, opening positions, and sweep behaviors
Searches database of 2.080 historical sessions for matching patterns
Displays statistical probability: "X% reached HIGH" vs "Y% reached LOW"
Shows expected drawdown levels for risk management
Example: If pattern shows "77% HIGH bias" → historically, 77 out of 100 similar sessions reached London high during NY 8-11 window.
Key Features
✅ Statistical Database:2.080 real sessions analyzed, 236 unique patterns
✅ 4-Level Pattern Matching: Finds best match with minimum 25 occurrences
✅ Live Bias Display: Shows HIGH% vs LOW% probability in real-time table
✅ Risk Management Zones: Visual drawdown levels (50%, 75%, 90%) + stop-loss suggestion
✅ No Repainting: Calculations made in real-time, no look-ahead bias
✅ Session Visualization: Color-coded boxes for Asian/London/NY ranges
How Pattern Matching Works
5 Components Analyzed:
Asian Range: Above/Below average
London Open: Above/Below Asian 50%
London Sweep: H, L, DH (double high→low), DL (double low→high), N (none)
London Range: Above/Below average
NY Open: Above/Below London 50%
Cascade Search (finds best available match):
Level 1: All 5 components (most specific)
Level 2: 4 components (drops London Range)
Level 3: 3 components (core pattern)
Level 4: 2 components (minimal pattern)
Validity: Only displays patterns with ≥25 historical occurrences.
Interpretation
Bias Table Shows:
Pattern match level (1-4) and historical count
Session characteristics (ranges, sweeps, positions)
TOTAL HIGH % = probability of reaching London high
TOTAL LOW % = probability of reaching London low
Bias strength: ⭐⭐⭐ STRONG (≥70%), ⭐⭐ MEDIUM (60-69%), ⭐ WEAK (<60%)
Drawdown Zones (for winning trades):
🟢 Green: 50% of winners stayed within this level
🟡 Yellow: 75% of winners stayed within this level
🟠 Orange: 90% of winners stayed within this level
🔴 Red Line: Suggested stop-loss (95th percentile + buffer)
Settings
Fully Customizable:
Timezone selection (auto-detects sessions correctly)
Minimum session threshold (default: 25)
Toggle boxes, lines, labels, drawdown zones
Complete color customization
Table size and position
Best Use Cases
✅ Optimal Setup:
Instrument: Micro NQ (MNQ) futures
Timeframe: Only 1-minute
Timezone: America/New_York
Historical data: 8+ years loaded
✅ Trading Approach:
Wait for pattern confirmation (≥25 sessions)
Prefer STRONG bias (≥70%) for higher confidence
Use drawdown zones for stop placement
Combine with price action confirmation
Avoid major news events (FOMC, NFP)
⚠️ Required Disclaimers
IMPORTANT RISK WARNINGS:
Past Performance ≠ Future Results: Historical statistics do NOT guarantee future outcomes
Not Financial Advice: Educational tool for statistical analysis only
Risk of Loss: Futures trading involves substantial risk of loss
No Guarantees: Individual trades WILL result in losses regardless of percentages shown
Requires Knowledge: Best for traders familiar with session analysis and risk management
Instrument-Specific: Optimized for Micro NQ - test before using elsewhere
Never risk more than you can afford to lose. Always use proper risk management.

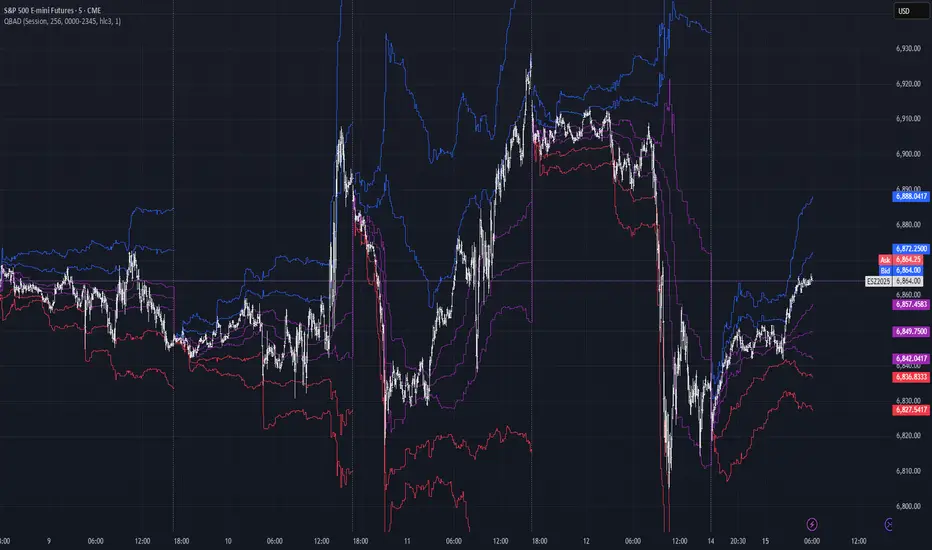
Quantile-Based Adaptive Detection🙏🏻 Dedicated to John Tukey. He invented the boxplot, and I finalized it.
QBAD (Quantile-Based Adaptive Detection) is ‘the’ adaptive (also optionally weighted = ready for timeseries) boxplot with more senseful fences. Instead of hardcoded multipliers for outer fences, I base em on a set of quantile-based asymmetry metrics (you can view it as an ‘algorithmic’ counter part of central & standardized moments). So outer bands are Not hardcoded, not optimized, not cross-validated etc, simply calculated at O(nlogn).
You can use it literally everywhere in any context with any continuous data, in any task that requires statistical control, novelty || outlier detection, without worrying and doubting the sense in arbitrary chosen thresholds. Obviously, given the robust nature of quantiles, it would fit best the cases where data has problems.
The thresholds are:
Basis: the model of the data (median in our case);
Deviations: represent typical spread around basis, together form “value” in general sense;
Extensions: estimate data’s extremums via combination of quantile-based asymmetry metrics without relying on actual blunt min and max, together form “range” / ”frame”. Datapoints outside the frame/range are novelties or outliers;
Limits: based also on quantile asymmetry metrics, estimate the bounds within which values can ‘ever’ emerge given the current data generating process stays the same, together form “field”. Datapoints outside the field are very rare, happen when a significant change/structural break happens in current data-generating process, or when a corrupt datapoint emerges.
…
The first part of the post is for locals xd, the second is for the wanderers/wizards/creators/:
First part:
In terms of markets, mostly u gotta worry about dem instruments that represent crypto & FX assets: it’s either activity hence data sources there are decentralized, or data is fishy.
For a higher algocomplexity cost O(nlong), unlike MBAD that is 0(n), this thing (a control system in fact) works better with ishy data (contaminated with wrong values, incomplete, missing values etc). Read about the “ breakdown point of an estimator ” if you wanna understand it.
Even with good data, in cases when you have multiple instruments that represent the same asset, e.g. CL and BRN futures, and for some reason you wanna skip constructing a proper index of em (while you should), QBAD should be better put on each instrument individually.
Another reason to use this algo-based rather than math-based tool, might be in cases when data quality is all good, but the actual causal processes that generate the data are a bit inconsistent and/or possess ‘increased’ activity in a way. SO in high volatility periods, this tool should provide better.
In terms of built-ins you got 2 weightings: by sequence and by inferred volume delta. The former should be ‘On’ all the time when you work with timeseries, unless for a reason you want to consciously turn it off for a reason. The latter, you gotta keep it ‘On’ unless you apply the tool on another dataset that ain’t got that particular additional dimension.
Ain’t matter the way you gonna use it, moving windows, cumulative windows with or without anchors, that’s your freedom of will, but some stuff stays the same:
Basis and deviations are “value” levels. From process control perspective, if you pls, it makes sense to Not only fade or push based on these levels, but to also do nothing when things are ambiguous and/or don’t require your intervention
Extensions and limits are extreme levels. Here you either push or fade, doing nothing is not an option, these are decisive points in all the meanings
Another important thing, lately I started to see one kind of trend here on tradingview as well and in general in near quant sources, of applying averages, percentiles etc ‘on’ other stationary metrics, so called “indicators”. And I mean not for diagnostic or development reasons, for decision making xd
This is not the evil crime ofc, but hillbilly af, cuz the metrics are stationary it means that you can model em, fit a distribution, like do smth sharper. Worst case you have Bayesian statistics armed with high density intervals and equal tail intervals, and even some others. All this stuff is not hard to do, if u aint’t doing it, it’s on you.
So what I’m saying is it makes sense to apply QBAD on returns ‘of your strategy’, on volume delta, but Not on other metrics that already do calculations over their own moving windows.
...
Second part:
Looks like some finna start to have lil suspicions, that ‘maybe’ after all math entities in reality are more like blueprints, while actual representations are physical/mechanical/algorithmic. Std & centralized moments is a math entity that represents location, scale & asymmetry info, and we can use it no problem, when things are legit and consistent especially. Real world stuff tho sometimes deviates from that ideal, so we need smth more handy and real. Add to the mix the algo counter part of means: quantiles.
Unlike the legacy quantile-based asymmetry metrics from the previous century (check quantile skewness & kurtosis), I don’t use arbitrary sets of quantiles, instead we get a binary pattern that is totally geometric & natural (check the code if interested, I made it very damn explicit). In spirit with math based central & standardized moments, each consequent pair is wider empathizing tail info more and more for each higher order metric.
Unlike the classic box plot, where inner thresholds are quartiles and the rest are based on em, here the basis is median (minimises L1), I base inner thresholds on it, and we continue the pattern by basing the further set of levels on the previous set. So unlike the classic box plot, here we have coherency in construction, symmetry.
Another thing to pay attention to, tho for some reason ain’t many talk about it, it’s not conceptually right to think that “you got data and you apply std moments on it”. No, you apply it to ‘centered around smth’ data. That ‘smth’ should minimize L2 error in case of math, L1 error in case of algo, and L0 error in case of learning/MLish/optimizational/whatever-you-cal-it stuff. So in the case of L0, that’s actually the ‘mode’ of KDE, but that’s for another time. Anyways, in case of L2 it’s mean, so we center data around mean, and apply std moments on residuals. That’s the precise way of framing it. If you understand this, suddenly very interesting details like 0th and 1st central moments start to make sense. In case of quantiles, we center data around the median, and do further processing on residuals, same.
Oth moment (I call it init) is always 1, tho it’s interesting to extrapolate backwards the sequence for higher order moments construction, to understand how we actually end up with this zero.
1st moment (I call it bias) of residuals would be zero if you match centering and residuals analysis methods. But for some reason you didn’t do that (e.g centered data around midhinge or mean and applied QBAD on the centered data), you have to account for that bias.
Realizing stuff > understanding stuff
Learning 2981234 human invented fields < realizing the same unified principles how the Universe works
∞
Happy BoxesThe logic behind this indicator is based off of time and a move just before or after a new hourly open. The larger boxes represent one (1) hour each. The smaller colored boxes inside the larger boxes highlight the 1 minute opening candle of each hour.
These 1 minute colored opening candles more often than not will act as magnets, especially when they open and immediately run away in one direction too quickly. You will see a reversal back to that open. When you see your reversal setup use these as targets.
Back test and track the timing of these reversals and the type of candle. The timing aspect is unreal. Good luck with it. It has brought me and many others financial freedom. Feel free to reach out with any questions.

Standard Deviation Range with Box (NY Session Timeframe)
---
Standard Deviation Range with Box (NY Session Timeframe)
This TradingView script is designed to help traders visualize a **price range** along with **standard deviations** during the **New York session (GMT-5)**. It provides key insights into market movements and standard deviation levels, all while offering graphical representations for easy analysis.
#### **Key Features**:
*⏰ Customizable Time Range**:
- Define a **start** and **end time** for the price range during the New York session (default: 09:40 to 09:50 GMT-5).
- The script automatically converts the specified time into New York timezone timestamps.
**📦 Price Range Box**:
- Draws a **dynamic box** to capture the **highest** and **lowest** prices during the defined timeframe.
- The box automatically updates as the highest and lowest prices change during the session.
**📏 Standard Deviations**:
- Calculates **standard deviation levels** (e.g., -1.5, 2, 2.5, -2, -1) based on the session's high-low range.
- Plots **horizontal lines** to represent these standard deviations, allowing for quick visual analysis of price volatility.
**🎨 Graphical Customization**:
- Customize the **box color**, **background color**, and **line styles** to match your chart’s aesthetics.
- The standard deviation lines are also customizable in terms of color and style for optimal visual clarity.
**💬 Watermark and Information Overlay**:
- Displays a **quote watermark** on the chart. The default quote is: "Patience is the price of the best opportunities."
- Provides real-time **symbol information** (ticker, timeframe, date) for context while analyzing the chart.
**🔄 Dynamic Updates**:
- Continuously updates the **highest** and **lowest** prices during the selected session.
- The box and deviation lines are automatically redrawn with each new bar during the session.
**Use Case**:
Ideal for traders who want to analyze **price movements** and **volatility** within a specific New York session window. It offers a clear view of the market’s historical range and current volatility, helping traders make data-driven decisions.
#### **How It Works**:
**Set the Time Range** ⏱️: Choose your start and end time for the New York session price range.
**Observe the Box** 📦: View the box showing the high/low price range for the session.
. **Check Standard Deviations** 📉: Monitor how the price relates to various standard deviation levels (plotted as horizontal lines).
**Watch Watermark & Info** 🧑💻: View your selected symbol’s **ticker**, **timeframe**, and **date** on the chart.

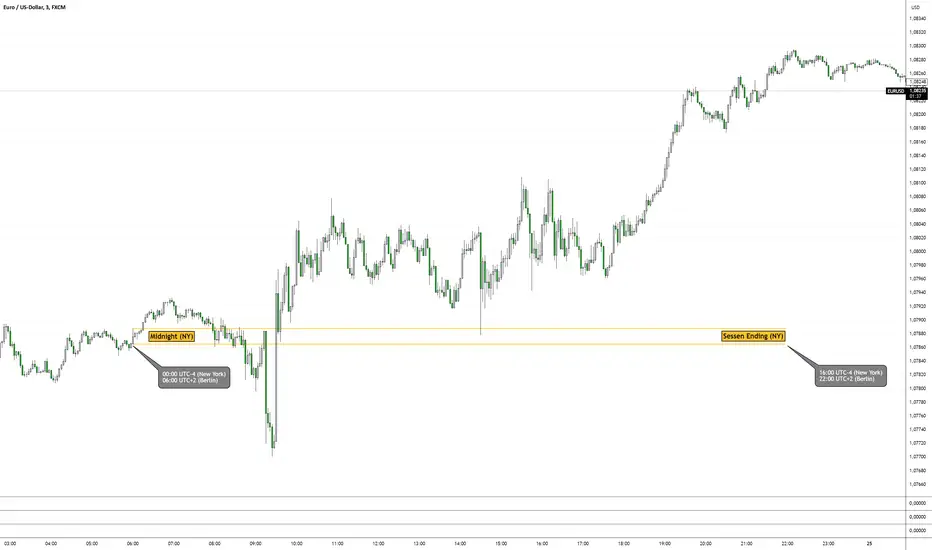
6am Box Indicator (German Time) - Midnight (NY Time) Indicator6am Box Indicator
This Indicator draws 2 lines between midnight (NY) / 6AM (Germany) and Session Ending (NY) / 10PM (Germany)
The first line is exactly at 6am UTC+2 whereas the second line prints one candle after the first line with a minimum time difference of 3min. This gives you the freedom to use different timeframes to get different boxes if you want to compare those. Minimum Box timeframe is 3min chart.
You can use this box for a support/resistance area, flipzone, magnet areas or whatever you call it, or use it in combination with other indicators.
Wish you the best! Good luck
StyleLibraryLibrary "StyleLibrary"
A small library of Pine Script functions that return built-in style variables.
method sizeStyle(size)
Takes a `string` that returns the corresponding built-in size style variable.
Namespace types: series string, simple string, input string, const string
Parameters:
size (string) : A `string` representing a built-in size style: `"Tiny"`, `"Small"`, `"Normal"`, `"Large"`,
`"Huge"`, `"Auto"`.
Returns: The respective built-in size style variable.
method sizeStyle(size)
Takes a `sizeStyle` that returns the corresponding built-in size style variable.
Namespace types: series sizeStyle
Parameters:
size (series sizeStyle) : A `sizeStyle` representing a built-in size style variable.
Returns: The respective built-in size style variable.
method lineStyle(style)
Takes a `string` that returns the corresponding built-in line style variable.
Namespace types: series string, simple string, input string, const string
Parameters:
style (string) : A `string` representing a built-in line style: `"Dashed"`, `"Dotted"`, `"Solid"`.
Returns: The respective built-in line style variable.
method lineStyle(style)
Takes a `lineStyle` that returns the corresponding built-in line style variable.
Namespace types: series lineStyle
Parameters:
style (series lineStyle) : A `lineStyle` representing a built-in line style variable.
Returns: The respective built-in line style variable.
method labelStyle(style)
Takes a `string` that returns the corresponding built-in label style variable.
Namespace types: series string, simple string, input string, const string
Parameters:
style (string) : A `string` representing a built-in label style:
`"Arrow Down"`, `"Arrow Up"`, `"Circle"`, `"Cross"`, `"Diamond"`, `"Flag"`,
`"Label Center"`, `"Label Down"`, `"Label Left"`, `"Label Lower Left"`,
`"Label Lower Right"`, `"Label Right"`, `"Label Up"`, `"Label Upper Left"`,
`"Label Upper Right"`, `"None"`, `"Square"`, `"Text Outline"`, `"Triangle Down"`,
`"Triangle Up"`, `"XCross"`.
Returns: The respective built-in label style variable.
method labelStyle(style)
Takes a `labelStyle` that returns the corresponding built-in label style variable.
Namespace types: series labelStyle
Parameters:
style (series labelStyle) : A `labelStyle` representing a built-in label style variable.
Returns: The respective built-in label style variable.
method fontStyle(font)
Takes a `string` that returns the corresponding built-in font style variable.
Namespace types: series string, simple string, input string, const string
Parameters:
font (string) : A `string` representing a built-in font style: `"Default"`, `"Monospace"`.
Returns: The respective built-in font style variable.
method positionStyle(position)
Takes a `string` that returns the corresponding built-in position style variable.
Namespace types: series string, simple string, input string, const string
Parameters:
position (string) : A `string` representing a built-in position style:
`"Bottom Center", `"Bottom Left", `"Bottom Right", `"Middle Center", `"Middle Left",
`"Middle Right", `"Top Center", `"Top Left", `"Top Right".
Returns: The respective built-in position style variable.
method displayStyle(display)
Takes a `simple string` that returns the corresponding built-in display style variable.
Namespace types: simple string, input string, const string
Parameters:
display (simple string) : A `simple string` representing a built-in display style: `"All"`, `"Data Window"`,
`"None"`, `"Pane"`, `"Price Scale"`, `"Status Line"`.
Returns: The respective built-in display style variable.

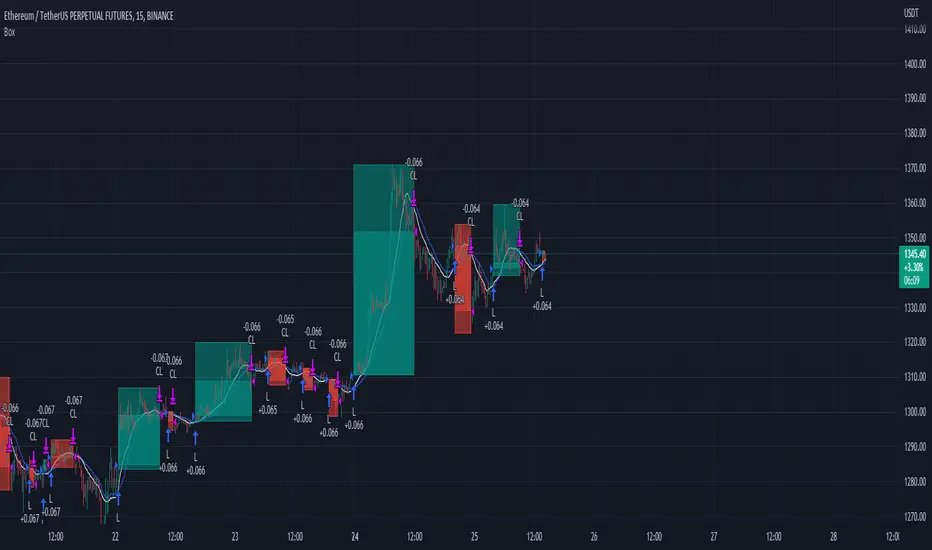
Low Volatility Range Breaks [BigBeluga]Low Volatility Range Breaks
The Low Volatility Range Breaks indicator is an advanced technical analysis tool designed to identify periods of low volatility and potential breakout opportunities. By visualizing low volatility ranges as ranges and tracking subsequent price movements, this indicator helps traders spot potential high-probability trade setups.
🔵 KEY FEATURES
● Low Volatility Detection
Identifies periods of low volatility based on highest and lowest periods and user-defined sensitivity
Uses a combination of highest/lowest price calculations and ATR for dynamic adaptation
● Volatility Box Visualization
Creates a box to represent the low volatility range
Box height is adjustable based on ATR multiplier
Includes a mid-line for reference within the box
● Breakout Detection
Identifies when price breaks above or below the volatility box
Labels breakouts as "Break Up" or "Break Dn" on the chart
Changes box appearance to indicate a completed breakout
● Probability Tracking
Counts the number of closes above and below the box's mid-line
Displays probability counters for potential upward and downward moves
Resets counters after a confirmed breakout
🔵 HOW TO USE
● Identifying Low Volatility Periods
Watch for the formation of volatility boxes on the chart
These boxes represent periods where price movement has been confined
● Anticipating Breakouts
Monitor price action as it approaches the edges of the volatility box
Use the probability counters to gauge the likely direction of the breakout
● Trading Breakouts
Consider posible entering trades when price breaks above or below the volatility box
Use the breakout labels ("Break Up" or "Break Dn") as a trading opportunity
● Managing Risk
Use the opposite side of the volatility box as a potential invalidation level
Consider the box height for position sizing and risk management
● Trend Analysis
Multiple upward breakouts may indicate a developing uptrend
Multiple downward breakouts may suggest a forming downtrend
Use in conjunction with other trend indicators for confirmation
🔵 CUSTOMIZATION
The Low Volatility Box Breaks indicator offers several customization options:
Adjust the volatility length to change the period for highest/lowest price calculations
Modify the volatility level to fine-tune the sensitivity of low volatility detection
Adjust the box height multiplier to change the size of volatility boxes
By fine-tuning these settings, traders can adapt the indicator to various market conditions and personal trading strategies.
The Low Volatility Range Breaks indicator provides a unique approach to identifying potential breakout opportunities following periods of consolidation. By visually representing low volatility periods and tracking subsequent price movements, it offers traders a powerful tool for spotting high-probability trade setups.
This indicator can be particularly useful for traders focusing on breakout strategies, mean reversion tactics, or those looking to enter trades at the beginning of new trends. The combination of visual cues (boxes and breakout labels) and quantitative data (probability counters) provides a comprehensive view of market dynamics during and after low volatility periods.
As with all technical indicators, it's recommended to use the Low Volatility Range Breaks indicator in conjunction with other forms of analysis and within the context of a well-defined trading strategy. While this indicator can provide valuable insights into potential breakouts, it should be considered alongside other factors such as overall market trends, volume, and fundamental analysis when making trading decisions.

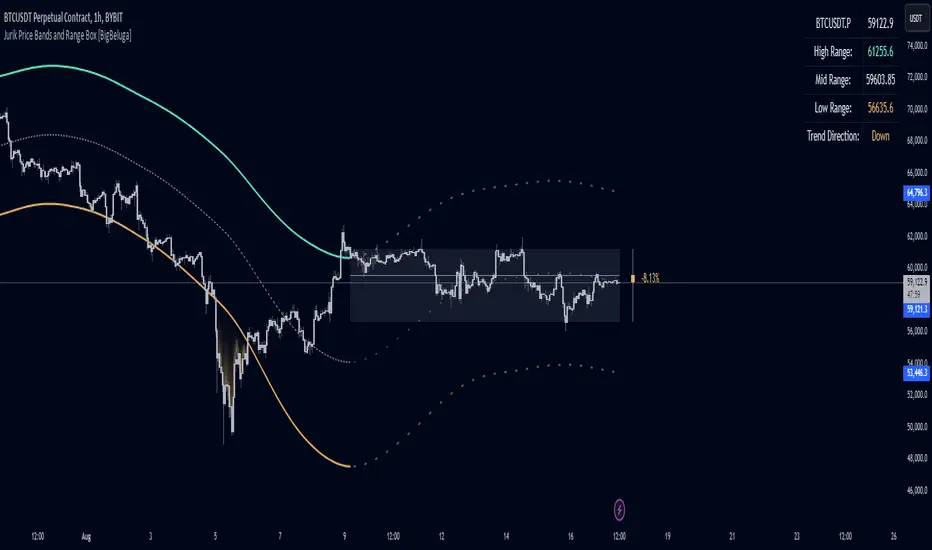
Jurik Price Bands and Range Box [BigBeluga]Jurik Price Bands and Range Box
The Jurik Price Bands and Range Box - BigBeluga indicator is an advanced technical analysis tool that combines Jurik Moving Average (JMA) based price bands with a dynamic range box. This versatile indicator is designed to help traders identify trends, potential reversal points, and price ranges over a specified period.
🔵 KEY FEATURES
● Jurik Price Bands
Utilizes Jurik Moving Average for smoother, more responsive bands
//@function Calculates Jurik Moving Average
//@param src (float) Source series
//@param len (int) Length parameter
//@param ph (int) Phase parameter
//@returns (float) Jurik Moving Average value
jma(src, len, ph) =>
var float jma = na
var float e0 = 0.0
var float e1 = 0.0
var float e2 = 0.0
phaseRatio = ph < -100 ? 0.5 : ph > 100 ? 2.5 : ph / 100 + 1.5
beta = 0.45 * (len - 1) / (0.45 * (len - 1) + 2)
alpha = math.pow(beta, phaseRatio)
e0 := (1 - alpha) * src + alpha * nz(e0 )
e1 := (src - e0) * (1 - beta) + beta * nz(e1 )
e2 := (e0 + phaseRatio * e1 - nz(jma )) * math.pow(1 - alpha, 2) + math.pow(alpha, 2) * nz(e2 )
jma := e2 + nz(jma )
jma
Consists of an upper band, lower band, and a smooth price line
Bands adapt to market volatility using Jurik MA on ATR
Helps identify potential trend reversal points and overextended market conditions
● Dynamic Range Box
Displays a box representing the price range over a specified period
Calculates high, low, and mid-range prices
Option for adaptive mid-range calculation based on average price
Provides visual representation of recent price action and volatility
● Price Position Indicator
Shows current price position relative to the mid-range
Displays percentage difference from mid-range
Color-coded for quick trend identification
● Dashboard
Displays key information including current price, range high, mid, and low
Shows trend direction based on price position relative to mid-range
Provides at-a-glance market context
🔵 HOW TO USE
● Trend Identification
Use the middle of the Range Box as the primary trend reference point
Price above the middle of the Range Box indicates an uptrend
Price below the middle of the Range Box indicates a downtrend
The bar on the right shows the percentage distance of the close from the middle of the box
This percentage indicates both trend direction and strength
Refer to the dashboard for quick trend direction confirmation
● Potential Reversal Points
Upper and lower Jurik Bands can indicate potential trend reversal points
Price reaching or exceeding these bands may suggest overextended conditions
Watch for price reaction at these levels for possible trend shifts or pullbacks
Range Box high and low can serve as additional reference points for price action
● Range Analysis
Use Range Box to gauge recent price volatility and trading range
Mid-range line can act as a pivot point for short-term price movements
Percentage difference from mid-range helps quantify price position strength
🔵 CUSTOMIZATION
The Jurik Price Bands and Range Box indicator offers several customization options:
Adjust Range Box length for different timeframe analysis
Toggle between standard and adaptive mid-range calculation
Standard:
Adaptive:
Modify Jurik MA length and deviation for band calculation
Toggle visibility of Jurik Bands
By fine-tuning these settings, traders can adapt the indicator to various market conditions and personal trading strategies.
The Jurik Price Bands and Range Box indicator provides a multi-faceted approach to market analysis, combining trend identification, potential reversal point detection, and range analysis in one comprehensive tool. The use of Jurik Moving Average offers a smoother, more responsive alternative to traditional moving averages, potentially providing more accurate signals.
This indicator can be particularly useful for traders looking to understand market context quickly, identify potential reversal points, and assess current market volatility. The combination of dynamic bands, range analysis, and the informative dashboard provides traders with a rich set of data points to inform their trading decisions.
As with all technical indicators, it's recommended to use the Jurik Price Bands and Range Box in conjunction with other forms of analysis and within the context of a well-defined trading strategy. While this indicator provides valuable insights, it should be considered alongside other factors such as overall market conditions, volume, and fundamental analysis when making trading decisions.
DeleteArrayType█ OVERVIEW
Here are common functions usually delete drawing once array of drawing is recall.
Method is used as in pine script version 5 instead of custom function.
It is an upgrade from DeleteArrayObject , which may not support overload parameter in future.
Library "DeleteArrayType"
TODO: Delete array type especially for drawings
method deleteLabel(id)
TODO: Delete array
Namespace types: array
Parameters:
id (array)
Returns: TODO: label.delete()
method deleteLine(id)
TODO: Delete array
Namespace types: array
Parameters:
id (array)
Returns: TODO: line.delete()
method deleteLineFill(id)
TODO: Delete array
Namespace types: array
Parameters:
id (array)
Returns: TODO: linefill.delete()
method deletePolyLine(id)
TODO: Delete array
Namespace types: array
Parameters:
id (array)
Returns: TODO: polyline.delete()
method deleteBox(id)
TODO: Delete array
Namespace types: array
Parameters:
id (array)
Returns: TODO: box.delete()
method deleteTable(id)
TODO: Delete array
Namespace types: array
Parameters:
id (array)
Returns: TODO: table.delete()
Gann toolbox - Custom boxGann toolbox - Custom box
█ OVERVIEW
This script is designed to draw Gann boxes based on pivotal levels. It is made make it easy by being interactive where you do not have to input data manually but rather select your two points right after adding the script by clicking on the levels on the chart itself.
In addition, this script has some great features, such as the ability to select the number of divisions wanted up to three with a click from the menu and to adjust the end date based on the selected pivotal level. Not to mention that you can automatically add a follow-up box right after
The divisions included are the one division ( at 50% ), the two divisions ( at .333% and 666% ), and finally the three divisions ( at 25%, 50%, and 75% ).
You can also display the golden ration in Time and Price on your box when it's on the one division setting.
When choosing a different end point you're presented with 4 options for using your 2nd point as :
- 25% of the box
- 50% of the box
- 33 days total size box ( for lower time frame trading )
- 45 days total size box.
You can enable/disable multiple lines using the styling options.
█ Future Plans and upgrades to this script may include :
1. Box current volume.
2. Stat information box.
and more! feel free to let me know what you'd like to see!
█ How to use :
1. Put the script on your chart
2. You are going to be asked to select your first pivotal level, then your second pivotal level. Simply select them by clicking on the level on the chart.
give the script a few seconds and you should be set.

Buy/Sell BoxThis indicator tries to identify the points where the price exceeds or falls below a rectangle based on the opening and closing prices of the previous period, the creation of the boxes occurs when a doji is detected therefore it will calculate the coordinates of the rectangle that will be drawn around it, therefore the indicator offers buy or sell signals based on this logic. Specifically, the buy signal is generated if the closing price is above the top of the rectangle and satisfies some previous price conditions while the sell signal is generated if the closing price is below the bottom of the rectangle and satisfies some conditions of previous prices within a further threshold based on the Ema 150.
Lines are then drawn on the graph to visually display the extreme price levels, which can be useful for any confirmation of buy and sell signals, Stop Loss and Take Profit, Trend Filter (to visually understand if the trend is bullish or bearish)
A potentially effective trading strategy could involve identifying buy and sell signals near the extreme price level lines drawn by the indicator. This approach can be used to try to improve the accuracy of your trading signals and make more informed decisions. For example:
When you receive a buy or sell signal based on the dojis and rectangles generated by the indicator, check whether the price is also near one of the extreme price level lines. If you are receiving a buy signal and notice that the current price is near a low of the lower level line, this may further confirm the buying opportunity, as the price is near a significant resistance level. On the contrary, if the sell signal was close to a maximum price level it could confirm an excellent short entry.
It is also possible to use the boxes as reference points to set the stop loss and take profit levels. If you are entering a buy position, you might consider setting your stop loss just below an upper line of the last box. Additionally, you may want to set your take profit near a higher price level if you are looking to maximize profits. This will help manage risks and protect your capital.

Psychological Support/Resistence [BigBeluga]The Psychological Support/Resistance indicator aims to provide the user with hypothetical support and resistance zones that are likely to provoke a strong reaction in price, either in both directions, providing good bouncing zones or significant movements once those levels are breached.
🔶 CALCULATION
The script takes into consideration the total number of sequential candles moving in the same direction, as determined by the user's settings. When this sequence is identified, a level is created.
A level is considered broken when the candle's close is above the top/bottom of the level.
Users have the option to select the width of the area based on the Average (AVG), Open, or Close.
AVG will provide the average width of the level of the area.
Close will offer a broader range to work with.
Open will provide a very narrow area.
🔶 METHODOLOGY
The idea behind these areas is that the price will be more likely to produce either a substantial move in the ongoing direction or, when breached, a strong price reaction.
The more the support level is touched or tested, the more likely it is to break.
The longer it has been since its creation and the less it has been tested, the more likely it is to offer strong support or resistance.
Wicks starting to close above the level will indicate a potential breakout to the upside or downside if a candle manages to close above it.
🔶 INPUTS
Users have the option to determine the number of sequential candles.
Users also have the option to decide how many zones to display on the chart.
Color changes are possible.
The possibility to show volume on the creation of the zone is included."

Contraction Box & Doji LinesContraction & Doji Lines indicator is designed to identify and visualize potential support and resistance levels on a price chart. It does this by detecting doji candlestick patterns and drawing horizontal lines from the middle of the doji bodies to the right. Additionally, it also highlights price contraction zones with colored boxes.
The indicator first identifies doji candlestick patterns that it suggests indecision in the market, a horizontal line and these horizontal lines can act as potential support or resistance levels. Traders can observe price reactions around these lines. If the price approaches a line and bounces off it, it may indicate a significant level in the market.
In addition to doji lines, this indicator also highlights price contraction zones. When a contraction zone is detected, a colored box is drawn to highlight this zone. The box extends from the fifth bar ago (left side) to the current bar (right side), with the highest high and lowest low of the identified zone. The color and width of this box can be customized using the "Box Line Border Color," "Box Background Color," and "Box Width" parameters.
A possible strategy could be can use the doji lines as potential support and resistance levels to make trading decisions. For example, if the price breaks above a doji line and holds, it may indicate a bullish signal.
The colored boxes highlight areas of price contraction, which often precede significant price movements. Traders can use these zones to anticipate potential breakouts or breakdowns.
For example, you might enter a long (buy) position if it anticipate a breakout from a contraction zone with a target price set above the breakout level. Conversely, you might enter a short (sell) position if they anticipate a breakdown from a contraction zone with a target price set below the breakdown level.

Bollinger Bands Heatmap (BBH)The Bollinger Bands Heatmap (BBH) Indicator provides a unique visualization of Bollinger Bands by displaying the full distribution of prices as a heatmap overlaying your price chart. Unlike traditional Bollinger Bands, which plot the mean and standard deviation as lines, BBH illustrates the entire statistical distribution of prices based on a normal distribution model.
This heatmap indicator offers traders a visually appealing way to understand the probabilities associated with different price levels. The lower the weight of a certain level, the more transparent it appears on the heatmap, making it easier to identify key areas of interest at a glance.
Key Features
Dynamic Heatmap: Changes in real-time as new price data comes in.
Fully Customizable: Adjust the scale, offset, alpha, and other parameters to suit your trading style.
Visually Engaging: Uses gradients of colors to distinguish between high and low probabilities.
Settings
Scale
Tooltip: Scale the size of the heatmap.
Purpose: The 'Scale' setting allows you to adjust the dimensions of each heatmap box. A higher value will result in larger boxes and a more generalized view, while a lower value will make the boxes smaller, offering a more detailed look at price distributions.
Values: You can set this from a minimum of 0.125, stepping up by increments of 0.125.
Scale ATR Length
Tooltip: The ATR used to scale the heatmap boxes.
Purpose: This setting is designed to adapt the heatmap to the instrument's volatility. It determines the length of the Average True Range (ATR) used to size the heatmap boxes.
Values: Minimum allowable value is 5. You can increase this to capture more bars in the ATR calculation for greater smoothing.
Offset
Tooltip: Offset mean by ATR.
Purpose: The 'Offset' setting allows you to shift the mean value by a specified ATR. This could be useful for strategies that aim to capitalize on extreme price movements.
Values: The value can be any floating-point number. Positive values shift the mean upward, while negative values shift it downward.
Multiplier
Tooltip: Bollinger Bands Multiplier.
Purpose: The 'Multiplier' setting determines how wide the Bollinger Bands are around the mean. A higher value will result in a wider heatmap, capturing more extreme price movements. A lower value will tighten the heatmap around the mean price.
Values: The minimum is 0, and you can increase this in steps of 0.2.
Length
Tooltip: Length of Simple Moving Average (SMA).
Purpose: This setting specifies the period for the Simple Moving Average that serves as the basis for the Bollinger Bands. A higher value will produce a smoother average, while a lower value will make it more responsive to price changes.
Values: Can be set to any integer value.
Heat Map Alpha
Tooltip: Opacity level of the heatmap.
Purpose: This controls the transparency of the heatmap. A lower value will make the heatmap more transparent, allowing you to see the price action more clearly. A higher value will make the heatmap more opaque, emphasizing the bands.
Values: Ranges from 0 (completely transparent) to 100 (completely opaque).
Color Settings
High Color & Low Color: These settings allow you to customize the gradient colors of the heatmap.
Purpose: Use contrasting colors for better visibility or colors that you prefer. The 'High Color' is used for areas with high density (high probability), while the 'Low Color' is for low-density areas (low probability).
Usage Scenarios for Settings
For Volatile Markets: Increase 'Scale ATR Length' for better smoothing and set a higher 'Multiplier' to capture wider price movements.
For Trend Following: You might want to set a larger 'Length' for the SMA and adjust 'Scale' and 'Offset' to focus on more probable price zones.
These are just recommendations; feel free to experiment with these settings to suit your specific trading requirements.
How To Interpret
The heatmap gives a visual representation of the range within which prices are likely to move. Areas with high density (brighter color) indicate a higher probability of the price being in that range, whereas areas with low density (more transparent) indicate a lower probability.
Bright Areas: Considered high-probability zones where the price is more likely to be.
Transparent Areas: Considered low-probability zones where the price is less likely to be.
Tips For Use
Trend Confirmation: Use the heatmap along with other trend indicators to confirm the strength and direction of a trend.
Volatility: Use the density and spread of the heatmap as an indication of market volatility.
Entry and Exit: High-density areas could be potential support and resistance levels, aiding in entry and exit decisions.
Caution
The Bollinger Bands Heatmap assumes a normal distribution of prices. While this is a standard assumption in statistics, it is crucial to understand that real-world price movements may not always adhere to a normal distribution.
Conclusion
The Bollinger Bands Heatmap Indicator offers traders a fresh perspective on Bollinger Bands by transforming them into a visual, real-time heatmap. With its customizable settings and visually engaging display, BBH can be a useful tool for traders looking to understand price probabilities in a dynamic way.
Feel free to explore its features and adjust the settings to suit your trading strategy. Happy trading!

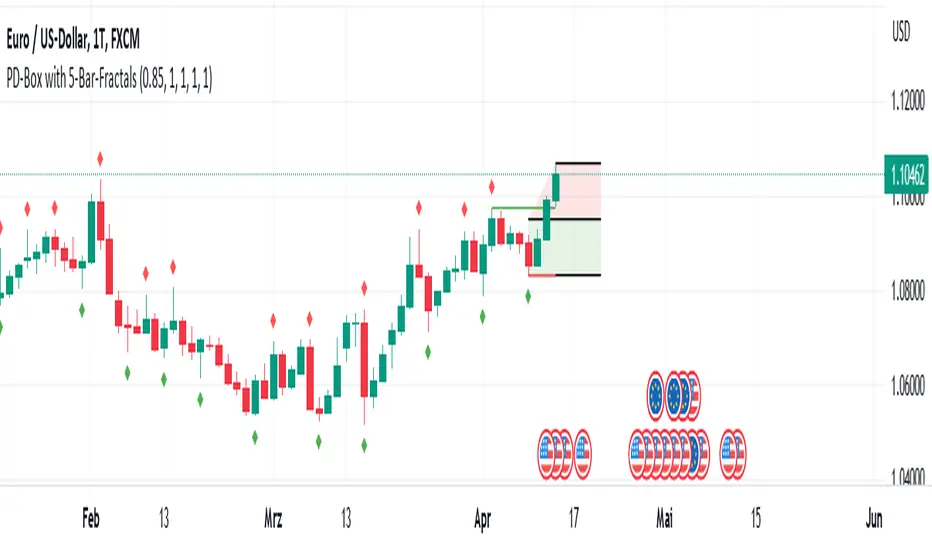
PD-Box with Fractal Points V1 (by Jonny86FXPro)PD-Box with Fractal Points V1 (by Jonny86FXPro)
This indicator has several functions:
Premium/Discount Box: The two most recent fractal highs and lows form a premium/discount box that provides valuable information about potential price movements.
Fractal Breaker Lines: Two fractal breaker lines are integrated for the high and low points to better visually represent the break of a fractal point.
Customizable: The genius of this indicator is that you can customize everything to your own needs. Whether you want to display lines, or change the colors of the box or lines, everything is possible.
Automatic Adjustment: Once a fractal point is broken, the premium discount automatically adjusts to the current price. Once a new fractal point is formed, the box is automatically adjusted again.
HTF Analysis: Use this indicator for your HTF analysis and determine in which direction the price could develop.
Premium Discount Box Information: When the price is in the premium range, there is a higher probability of a sell-off. However, if the price breaks upward, there is a good chance that it will continue to rise. The opposite is true for the discount range.
Power Behind Each Move: It is important how the price hits the fractal point. If there is power behind each move, the chances are very good that it will continue in that direction. If there is no real power behind it, it could be an indication of a trend reversal.
Weak Breaks: In the premium range, a weak upward break could lead to a bearish move, and in the discount range, a weak downward break through the fractal low point could lead to a move in the bullish direction.
As you can see, this powerful indicator has many functions that can help you determine trend direction and potential price movements.
Quick overview of functions:
Designed for higher timeframes such as 4H chart.
Identifies the last two fractal highs and lows to create a premium/discount box.
Includes two fractal breaker lines for the high and low points to better visually represent fractal breaks.
Customizable to fit individual needs, including the ability to show/hide lines and change box/line colors.
Automatically adjusts premium/discount levels to current price when a fractal point is broken.
Can be used for higher timeframe analysis to determine potential price direction.
Premium/discount box provides insight into potential market direction based on price movement within its range.
Fractal break with strong market momentum indicates a higher chance of trend continuation.
Fractal break with weak market momentum may suggest a potential trend reversal.
A powerful indicator that can greatly assist in determining trend direction.
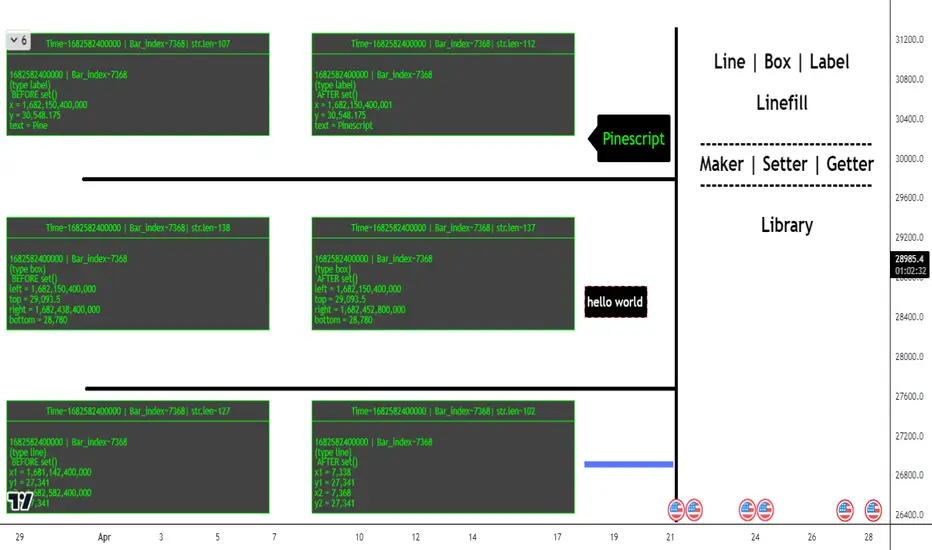
ObjectHelpersLibrary "ObjectHelpers"
Line | Box | Label | Linefill -- Maker, Setter, Getter Library
TODO: add table functionality
set(object)
set all params for `line`, `box`, `label`, `linefill` objects with 1 function
***
## Overloaded
***
```
method set(line Line, int x1=na, float y1=na, int x2=na, float y2=na,string xloc=na,string extend=na,color color=na,string style=na,int width=na,bool update=na) => line
```
### Params
- **Line** `line` - line object | `required`
- **x1** `int` - value to set x1
- **y1** `float` - value to set y1
- **x2** `int` - value to set x2
- **y2** `float` - value to set y2
- **xloc** `int` - value to set xloc
- **yloc** `int` - value to set yloc
- **extend** `string` - value to set extend
- **color** `color` - value to set color
- **style** `string` - value to set style
- **width** `int` - value to set width
- **update** `bool` - value to set update
***
```
method set(box Box,int left=na,float top=na,int right=na, float bottom=na,color bgcolor=na,color border_color=na,string border_style=na,int border_width=na,string extend=na,string txt=na,color text_color=na,string text_font_family=na,string text_halign=na,string text_valign=na,string text_wrap=na,bool update=false) => box
```
### Params
- **Box** `box` - box object
- **left** `int` - value to set left
- **top** `float` - value to set top
- **right** `int` - value to set right
- **bottom** `float` - value to set bottom
- **bgcolor** `color` - value to set bgcolor
- **border_color** `color` - value to set border_color
- **border_style** `string` - value to set border_style
- **border_width** `int` - value to set border_width
- **extend** `string` - value to set extend
- **txt** `string` - value to set _text
- **text_color** `color` - value to set text_color
- **text_font_family** `string` - value to set text_font_family
- **text_halign** `string` - value to set text_halign
- **text_valign** `string` - value to set text_valign
- **text_wrap** `string` - value to set text_wrap
- **update** `bool` - value to set update
***
```
method set(label Label,int x=na,float y=na, string txt=na,string xloc=na,color color=na,color textcolor=na,string size=na,string style=na,string textalign=na,string tooltip=na,string text_font_family=na,bool update=false) => label
```
### Paramas
- **Label** `label` - label object
- **x** `int` - value to set x
- **y** `float` - value to set y
- **txt** `string` - value to set text add`"+++"` to the _text striing to have the current label text concatenated to the location of the "+++")
- **textcolor** `color` - value to set textcolor
- **size** `string` - value to set size
- **style** `string` - value to set style (use "flip" ,as the style to have label flip to top or bottom of bar depending on if open > close and vice versa)
- **text_font_family** `string` - value to set text_font_family
- **textalign** `string` - value to set textalign
- **tooltip** `string` - value to set tooltip
- **update** `bool` - update label to next bar
***
```
method set(linefill Linefill=na,line line1=na,line line2=na,color color=na) => linefill
```
### Params
- **linefill** `linefill` - linefill object
- **line1** `line` - line object
- **line2** `line` - line object
- **color** `color` - color
Parameters:
object (obj)
Returns: `line`, `box`, `label`, `linefill`
method set(Line, x1, y1, x2, y2, xloc, extend, color, style, width, update)
set the location params of a line with 1 function auto detects time or bar_index for xloc param
Namespace types: series line
Parameters:
Line (line) : `line` - line object | `required`
x1 (int) : `int` - value to set x1
y1 (float) : `float` - value to set y1
x2 (int) : `int` - value to set x2
y2 (float) : `float` - value to set y2
xloc (string) : `int` - value to set xloc
extend (string) : `string` - value to set extend
color (color) : `color` - value to set color
style (string) : `string` - value to set style
width (int) : `int` - value to set width
update (bool) : `bool` - value to set update
Returns: `line`
method set(Box, left, top, right, bottom, bgcolor, border_color, border_style, border_width, extend, txt, text_color, text_font_family, text_halign, text_valign, text_wrap, update)
set the location params of a box with 1 function
Namespace types: series box
Parameters:
Box (box) : `box` - box object | `required`
left (int) : `int` - value to set left
top (float) : `float` - value to set top
right (int) : `int` - value to set right
bottom (float) : `float` - value to set bottom
bgcolor (color) : `color` - value to set bgcolor
border_color (color) : `color` - value to set border_color
border_style (string) : `string` - value to set border_style
border_width (int) : `int` - value to set border_width
extend (string) : `string` - value to set extend
txt (string) : `string` - value to set _text
text_color (color) : `color` - value to set text_color
text_font_family (string) : `string` - value to set text_font_family
text_halign (string) : `string` - value to set text_halign
text_valign (string) : `string` - value to set text_valign
text_wrap (string) : `string` - value to set text_wrap
update (bool) : `bool` - value to set update
Returns: `box`
method set(Label, x, y, txt, xloc, color, textcolor, size, style, textalign, tooltip, text_font_family, update)
set the location params of a label with 1 function auto detects time or bar_index for xloc param
Namespace types: series label
Parameters:
Label (label) : `label` | `required`
x (int) : `int` - value to set x
y (float) : `float` - value to set y
txt (string) : `string` - value to set text add`"+++"` to the _text striing to have the current label text concatenated to the location of the "+++")
xloc (string)
color (color)
textcolor (color) : `color` - value to set textcolor
size (string) : `string` - value to set size
style (string) : `string` - value to set style (use "flip" ,as the style to have label flip to top or bottom of bar depending on if open > close and vice versa)
textalign (string) : `string` - value to set textalign
tooltip (string) : `string` - value to set tooltip
text_font_family (string) : `string` - value to set text_font_family
update (bool) : `bool` - update label to next bar
Returns: `label`
method set(Linefill, line1, line2, color)
change the 1 or 2 of the lines in a linefill object
Namespace types: series linefill
Parameters:
Linefill (linefill)
line1 (line) : `line` - line object
line2 (line) : `line` - line object
color (color) : `color` - color
Returns: `linefill`
get(object)
get all of the location variables for `line`, `box`, `label` objects or the line objects from a `linefill`
***
## Overloaded
***
```
method get(line Line) =>
```
### Params
- **Line** `line` - line object | `required`
***
```
method get(box Box) =>
```
### Params
- **Box** `box` - box object | `required`
***
```
method get(label Label) =>
```
### Paramas
- **Label** `label` - label object | `required`
***
```
method get(linefill Linefill) =>
```
### Params
- **Linefill** `linefill` - linefill object | `required`
Parameters:
object (obj)
Returns: ` `
method get(Line)
Gets the location paramaters of a Line
Namespace types: series line
Parameters:
Line (line) : `line` - line object
Returns:
method get(Box)
Gets the location paramaters of a Box
Namespace types: series box
Parameters:
Box (box) : `box` - box object
Returns:
method get(Label)
Gets the `x`, `y`, `text` of a Label
Namespace types: series label
Parameters:
Label (label) : `label` - label object
Returns:
method get(Linefill)
Gets `line 1`, `line 2` from a Linefill
Namespace types: series linefill
Parameters:
Linefill (linefill) : `linefill` - linefill object
Returns:
method set_x(Line, x1, x2)
set the `x1`, `x2` of a line
***
### Params
- **Line** `line` - line object | `required`
- **x1** `int` - value to set x1 | `required`
- **x2** `int` - value to set x2 | `required`
Namespace types: series line
Parameters:
Line (line) : `line` - line object
x1 (int) : `int` - value to set x1
x2 (int) : `int` - value to set x2
Returns: `line`
method set_y(Line, y1, y2)
set `y1`, `y2` of a line
***
### Params
- **Line** `line` - line object | `required`
- **y1** `float` - value to set y1 | `required`
- **y2** `float` - value to set y2 | `required`
Namespace types: series line
Parameters:
Line (line) : `line` - line object
y1 (float) : `float` - value to set y1
y2 (float) : `float` - value to set y2
Returns: `line`
method Line(x1, y1, x2, y2, extend, color, style, width)
Similar to `line.new()` but can detect time or bar_index for xloc param and has defaults for all params but `x1`, `y1`, `x2`, `y2`
***
### Params
- **x1** `int` - value to set
- **y1** `float` - value to set
- **x2** `int` - value to set
- **y2** `float` - value to set
- **extend** `string` - extend value to set line
- **color** `color` - color to set line
- **style** `string` - style to set line
- **width** `int` - width to set line
Namespace types: series int, simple int, input int, const int
Parameters:
x1 (int) : `int` - value to set
y1 (float) : `float` - value to set
x2 (int) : `int` - value to set
y2 (float) : `float` - value to set
extend (string) : `string` - extend value to set line
color (color) : `color` - color to set line
style (string) : `string` - style to set line
width (int) : `int` - width to set line
Returns: `line`
method Box(left, top, right, bottom, extend, border_color, bgcolor, text_color, border_width, border_style, txt, text_halign, text_valign, text_size, text_wrap)
similar to box.new() with the but can detect xloc param and has defaults for everything but location params
***
### Params
- **left** `int` - value to set
- **top** `float` - value to set
- **right** `int` - value to set
- **bottom** `float` - value to set
- **extend** `string` - extend value to set box
- **border_color** `color` - color to set border
- **bgcolor** `color` - color to set background
- **text_color** `color` - color to set text
- **border_width** `int` - width to set border
- **border_style** `string` - style to set border
- **txt** `string` - text to set
- **text_halign** `string` - horizontal alignment to set text
- **text_valign** `string` - vertical alignment to set text
- **text_size** `string` - size to set text
- **text_wrap** `string` - wrap to set text
Namespace types: series int, simple int, input int, const int
Parameters:
left (int) : `int` - value to set
top (float) : `float` - value to set
right (int) : `int` - value to set
bottom (float) : `float` - value to set
extend (string) : `string` - extend value to set box
border_color (color) : `color` - color to set border
bgcolor (color) : `color` - color to set background
text_color (color) : `color` - color to set text
border_width (int) : `int` - width to set border
border_style (string) : `string` - style to set border
txt (string) : `string` - text to set
text_halign (string) : `string` - horizontal alignment to set text
text_valign (string) : `string` - vertical alignment to set text
text_size (string) : `string` - size to set text
text_wrap (string) : `string` - wrap to set text
Returns: `box`
method Label(txt, x, y, yloc, color, textcolor, style, size, textalign, text_font_family, tooltip)
Similar to label.new() but can detect time or bar_index for xloc param and has defaults for all params but x, y, txt, tooltip
***
### Params
- **txt** `string` - string to set
- **x** `int` - value to set
- **y** `float` - value to set
- **yloc** `string` - y location to set
- **color** `color` - label color to set
- **textcolor** `color` - text color to set
- **style** `string` - style to set
- **size** `string` - size to set
- **textalign** `string` - text alignment to set
- **text_font_family** `string` - font family to set
- **tooltip** `string` - tooltip to set
Namespace types: series string, simple string, input string, const string
Parameters:
txt (string) : `string` - string to set
x (int) : `int` - value to set
y (float) : `float` - value to set
yloc (string) : `string` - y location to set
color (color) : `color` - label color to set
textcolor (color) : `color` - text color to set
style (string) : `string` - style to set
size (string) : `string` - size to set
textalign (string) : `string` - text alignment to set
text_font_family (string) : `string` - font family to set
tooltip (string) : `string` - tooltip to set
Returns: `label`
obj
Fields:
obj (series__string)
Trend line & pivot level
This script can plot pivot levels and trend lines that are haven't broke out.
In the setting, left and right means how to get the pivot. the pivot will be gotten based on the left candles and the right candles. boxes will be auto deleted after the box was broke.
Important: This is just a beta version, if you find some bug with using this script. Don't hesitate to contact me.
What the future version will have? Might be pattern scanner, multi trend line, levels in different time frame, break out alert, or better key level algorithm. Depends on when I have free time.

Wicked Good S&R Zones// Hello tradeurs, ChasinAlts here with a script you've DEFINITELY never seen before. Hope everyone is well. Ok, so heres the low-down...When a wick's
// % size is above the threshold set by the user it is plotted with light blue (these aren't really the significant ones) and are put into an array.
// These large wick lines are great S&R lines but we're looking to filter out to only the best ones. So, after all the large wicks are recorded for the
// chart and lines drawn, it then calculates the area between each of these lines in % (you can think of the lines as the upper and lower lines to a box
// if you'd like...ie. it is one of the ways to view the final BEST S&R lines). What we are want is the largest of ALL the % areas between lines and to
// use these as our ultimate S&R Areas. Depending on the Min % Wick size that is chosen, you will find price usually either bouncing between these levels or
// that price will keep bouncing off of the same level until a large spike (up or down) occurs in price and the price will finally breach the level its been
// testing over and over. Once this DOES occur the level that was just broken many times will be the furthest point back for the retest. Now, as stated
// before there are 2 ways to view the output data. Either way it will show the largest % area between the lines as it is developing down the line of
// progressing bars on the chart (that means it WILL change but usually a portion of the previous area/box will be used for the newer smaller box or that
// the area/box will jump back and forth between the same few areas every now and again). Viewing it as a box will show the updated largest box
// (as stated twice now) but viewing it in it's S&R Line form will draw a new S&R line at the top and bottom of where the box would be if it was selected
// EXCEPT that these lines will persist across bars and you will continuously see how these levels will continue to be revisited and constantly used
// as S&R Lines as time progresses. (SO box only show the largest area and lines draws line at the top and bottom of box and persists across bars).
// There is not repainting that can occur. I hope you all enjoy this as I've found it EXTREMELY beneficial bc it's rare that when price first gets to a
// printed S&R level that it will shoot through it so you can depend on it bouncing off the the levels often multiple times. I've included comments in all
// of the code for your convenience. Also, the higher subscription plan you have (thus the more bars/data you have access to...the more S&R Lines will be drawn).
// Wish you all the best in your endeavors and may the force be with your trades, and as ALWAYS...Peace and Love people....Peace and Love. -ChasinAlts out.

Trading range display with BoxThis script is just for reference to see the trading range.
Do not use this strategy logic, it is just Test strategy.
The trading range is colored depending on whether it is profitable or not.
You can change the color if you want.
When you declare the strategy, put (process_orders_on_close=true,calc_on_every_tick=true, max_boxes_count=500) in your script.
Then it can show you current open trading as well.
If you use switching strategy (e.g longposition to shortposition right away), it may not show you the range properly.
In that case, reduse the test period.
IT IS Repainting Reference.
If you want to see your strategy result visually,
Just copy and paste from line 22 in my script.
Good Luck everyone.
전략 거래 기간 동안을 보여주는 지표입니다.
이 지표에 쓰인 전략은 단순 테스트용 입니다. 절대 사용하지 마세요.
각 거래기간은 수익이냐 아니냐에 따라 색깔이 정해 집니다.
색깔은 여러분이 변경하실 수 있습니다.
전략을 선언부에 process_orders_on_close=true,calc_on_every_tick=true, max_boxes_count=500 을 넣으시면 현재 오픈 거래도 보실 수 있습니다.
스위칭 전략(롱에서 숏으로 바로 전환하는 전략)을 쓰시는 분들은 아마 테스트 기간을 줄이라는 경고를 받으실 수 있습니다.
이 지표는 리페이팅이 될 수 있습니다.
전략 결과를 눈으로 보고 싶으신 분들은 22번째 줄 부터 카피하시면 됩니다.
행운이 있길..
---strategy set---
default_qty_value=10
commission_value=0.04
slippage=2
Educational: lines, linefill, labels & boxesThis educational script contains different examples regarding lines , linefill , labels & boxes
First part shows the use of array.new() without first
retrieving line.new() which then are put in a linefill.new()
At every start of the week a linefill.new() is added with the top line being
previous Weekly high , and the bottom line being previous Weekly low ,
if close doesn't go above top line, or below bottom line, both lines will be made longer
with 1 bar_index ( line.set_x2 ), otherwise the lines stop, and change color
Please read the comments in the script as well
Cheers!

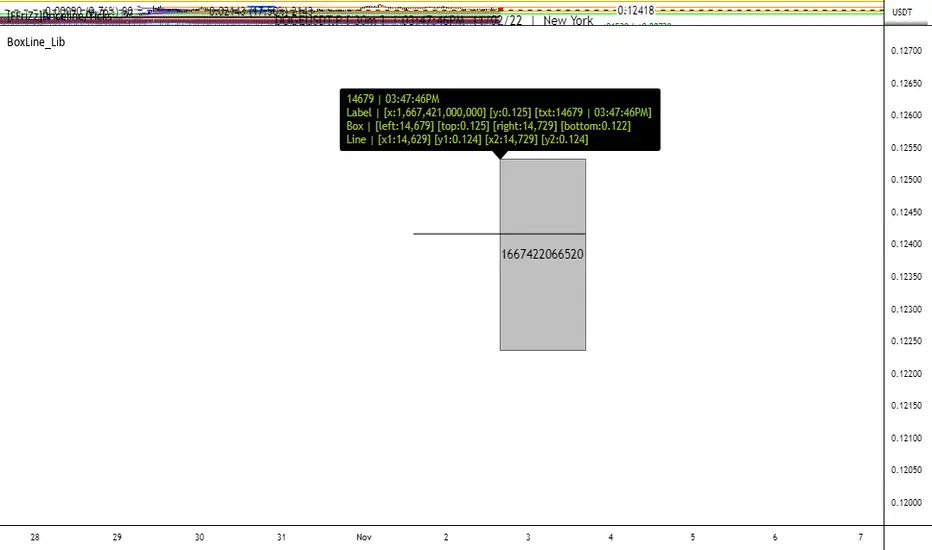
BoxLine_LibLibrary "BoxLine_Lib"
personal Library for line and box built in functions
lineXY(x)
get x1,y1,x2,y2 in a tuple
Parameters:
x : TODO: line
Returns: tuple of x1,y1,x2,y2
line(x)
Create line with only the y1 value(when line == na) or all
when line != na set x1,y1,x2,y2 individually just 1 or all
- use just the line value to set the x2 to current bar or time will set to time
- will auto pick xloc.bar_index or xloc.bar_time if not used
Parameters:
x : (line line,int x1,float y1,int x2,float y2,
string xloc,string extend,color color,string style,int width)
Returns: Line
boxXY(x)
get left,top,right,bottom in a tuple
Parameters:
x : box
Returns: tuple of left,top,right,bottom
box(x)
Create line with only the top,bottom value(when line == na) or all
when box != na set left,top,right,bottom individually just 1 or all
- use just the box value to set the right to current bar or time will set to time
- if right is above a number that a bar_index wouldnt be
Parameters:
x : box box,int left,float top,int right,
float bottom,color border_color, int border_width,
string border_style,string extend,string xloc,
color bgcolor,string text,string text_size, color text_color,
string text_halign,string text_valign,string text_wrap)
Returns: TODO: Box