BullTrader - ParabolicSARFlipSignals(NonRepainting)TP/SL🧠 Purpose & Concept
This indicator refines Wilder’s Parabolic SAR into a simple, non‑repainting alert and visualization system that marks each confirmed trend flip with a clear buy or sell signal.
It also auto‑generates dynamic, ATR‑based Take‑Profit (TP) and Stop‑Loss (SL) levels, keeps them updating with price in real time, and displays the current market bias in an on‑chart table.
The goal: clarity and automation without complexity — see exactly when a new bullish or bearish phase begins, what your current TP/SL targets are, and receive a single clean alert for every new flip.
⚙️ How It Works
1. The built‑in ta.sar() function tracks the Parabolic SAR dots.
2. When a candle closes across the SAR line, a trend‑change is confirmed:
• Price crossing above a SAR dot → Buy Flip (green triangle).
• Price crossing below a SAR dot → Sell Flip (red triangle).
3. On each flip, the indicator calculates dynamic ATR‑based TP / SL targets:
TP = entry ± (ATR × tpMult) and SL = entry ∓ (ATR × slMult)
These values move automatically as the trend develops.
4. A small floating label beside the latest bar shows live‑updated TP / SL numbers.
5. A color‑coded table in the upper‑right corner displays the current trend: Lime = Bullish, Red = Bearish, Yellow = Neutral.
6. Each new flip triggers an easy‑to‑use Buy / Sell alert after the bar closes—no repainting.
🔔 Alerts
Alert Name Triggers When Message
SAR Buy Flip Alert Green triangle (bullish reversal) “BUY Flip — Parabolic SAR on {{ticker}} ({{interval}})”
SAR Sell Flip Alert Red triangle (bearish reversal) “SELL Flip — Parabolic SAR on {{ticker}} ({{interval}})”
📈 Chart Elements
Element Meaning
🟠 Orange cross Standard Parabolic SAR trail.
🟢 / 🔴 Triangles Confirmed buy / sell flips (non‑repainting).
Bright lime/red TP‑SL box Live ATR targets that move with price.
Trend table (top‑right) Instant status of bullish/bearish bias.
✅ Features & Highlights
Non‑repainting — all signals confirm on closed bars.
Visual clarity — single pair of bright triangles for flips.
Dynamic ATR‑based TP / SL values that auto‑trail with trend.
Always‑visible trend summary table.
Two ready‑made alert types (Buy / Sell).
Lightweight and optimized for any timeframe or symbol.
💡 Best Use
Ideal for traders who prefer clean trend‑based entries and volatility‑adaptive exits without signal clutter:
Pair it with your existing strategy or use it standalone for reversal‑based swing and intraday trading.
Breadth Indicators

ATR_XAUUSD-BITCOINT-US100_Daniel# ATR Daniel - Indicator Description
## 🇬🇧 ENGLISH VERSION
### ATR Daniel - Smart Trailing Stop Manager
**ATR Daniel** is an intelligent trailing stop indicator that automatically adapts to your trading style and the asset you're trading.
#### Key Features:
**🎯 3 Trading Modes:**
- **Swing Trading** - For position trading with wider stops
- **Intraday** - For day trading with balanced parameters
- **Scalping** - For quick trades with tight stops
**📊 Automatic Asset Detection:**
The indicator automatically recognizes 3 major assets and applies optimized parameters:
- **XAUUSD (Gold)** - Lower volatility settings
- **BTCUSDT (Bitcoin)** - Medium volatility settings
- **NAS100USD (Nasdaq 100)** - Higher volatility settings
**🔧 Flexible Configuration:**
- **Auto Mode**: Applies optimal parameters based on detected asset and selected trading mode
- **Manual Mode**: Customize ATR length and multiplier to your preferences
- **Customizable Colors**: Choose your own line color
- **ON/OFF Display**: Toggle line visibility as needed
**📈 Visual Display:**
- Dynamic trailing stop line that follows price action
- Color changes based on trend direction (bullish/bearish)
- Real-time info table showing:
- Current asset
- Trading mode
- ATR value
- Stop loss distance
- Recommended SL price
- Current trend direction
- Signal arrows at trend reversals (optional)
**💡 How It Works:**
The indicator uses ATR (Average True Range) to calculate dynamic stop loss levels that adapt to market volatility. The trailing stop follows the price in trending markets while protecting your position.
**Perfect for:**
- Traders who want automated stop loss management
- Multi-asset traders (Gold, Bitcoin, Nasdaq)
- All trading styles (Swing, Intraday, Scalping)
---

Minhas MAs - Escala Unificada (lock)📘 Indicator: My Moving Averages – Clean & Fixed
Description:
This indicator displays four classic moving averages (two exponential and two simple) designed to clearly show market trend direction and strength. It’s optimized to stay locked to the main price scale, avoiding the common issue of indicator lines “floating” when the chart is moved.
Composition:
EMA 9 (Short): Fast-reacting line; ideal for short-term entries and exits.
EMA 20 (Medium): Smooths short-term noise and confirms trend direction.
SMA 50 (Long): Represents the intermediate trend and often acts as dynamic support/resistance.
SMA 200 (Macro): Defines the overall long-term trend; widely used by institutional traders.
Interpretation:
Price above all MAs: strong uptrend.
Price below all MAs: strong downtrend.
Crossovers (e.g., EMA 9 crossing above EMA 20) signal possible momentum shifts.
MAs also act as dynamic support and resistance zones.
Advantages:
A clean, minimalist trend-following tool that adapts to any asset (stocks, crypto, forex) and timeframe.
Perfect for traders who prefer uncluttered charts with clear trend structure.

MMM1this framework useful to show R1, R2, R3 and S1 , S2 , S3 and get more flexibility also work in all time fame.

Seasonality Indicator 1DA seasonality indicator that draws vertical lines on the chart for each selectable start and end date for each year, i.e., the current year and all previous years.

RSI(14) CrossUp >= 60 📈 RSI14 CrossUp ≥ 60 (Daily, Live) + BB Width Screener
Author: Rayan Selim / Torpedo Labs
Version: 1.0
Category: Momentum + Volatility Visualization
🧠 Overview
This indicator combines RSI-based momentum confirmation with Bollinger Band Width (BBW) expansion tracking — designed for traders who want to visually and quantitatively detect daily strength shifts and volatility expansions across multiple symbols.
It highlights candles when the daily RSI(14) crosses above 60, signaling bullish continuation, and displays daily Bollinger Band Width data to assess volatility expansion or contraction.
You can also use the built-in Screener plots as custom columns in TradingView’s Watchlist or Stock Screener for quick scanning of multiple symbols.
⚙️ Core Features
✅ Daily RSI(14) Cross-Up Highlight
Automatically colors candles when RSI crosses above 60 (updates live, no need to wait for daily close).
✅ Bollinger Band Width (BBW) Display
Shows BBW values for the highlighted and previous candles.
✅ Dynamic Label Coloring
Expanding BBW → Green label, Contracting → Red label (toggleable).
✅ Grouped Input Panels
Organized configuration panels for clarity:
Graphic / Highlight
BBW Labels (Global / Green / Red / Fonts)
Screener Outputs
✅ Screener-Compatible Output Plots
Adds hidden plots for Watchlist columns:
RSI Prev (D)
RSI Today (D)
BBW Prev (D)
BBW Today (D)
CrossUp≥60 (0/1)
BBW Expanding (0/1)
✅ Live & Non-Repainting
Uses lookahead_on for live RSI updates while maintaining daily context.
📊 Use Case Examples
Detect momentum confirmation (RSI crossing 60) with simultaneous volatility expansion.
Screen for tickers where daily BBW is widening while RSI shows strength.
Build Watchlist columns to sort stocks by RSI conditions and BBW expansion.
Identify early breakout conditions during accumulation phases.
⚡ Technical Notes
All calculations use daily data, even on lower timeframes.
RSI cross-up events include the current (in-progress) daily candle.
Screener columns are hidden by default but can be toggled visible for debugging.
The indicator is non-repainting, as it reads daily RSI and BBW in real time.
📢 Alerts
Built-in alert for “RSI(14) Crossed Above 60 (Live)” so you never miss a setup.

Info de Vela 1m1-Minute Candle Info Dashboard (Real-Time)
Overview
This is a lightweight, real-time dashboard designed specifically for 1-minute (1m) scalping. It provides critical, non-lagging data about the current 1-minute candle, helping you make split-second decisions on stop-loss placement and risk assessment.The table updates on every tick without flickering or repainting.
Key Features (Real-Time Table)
The dashboard displays three key metrics about the current 1m candle:Time Remaining: A simple countdown timer showing the exact seconds remaining until the current candle closes (e.g., "00:34").Dist. to Extreme (Ticks): This is the core function for scalping. It calculates the distance (in ticks) from the current price to the furthest extreme of the candle (i.e., max(high - close, close - low)). This is ideal for traders who base their stop-loss on the current candle's range.Total Candle Range (Ticks): Displays the full high-to-low range of the current candle in ticks, giving you an instant read on volatility.
How to Use
This tool is designed to solve one problem: speed.Instead of manually measuring the distance for your stop-loss on every candle, you can instantly read the exact tick value from the table. This allows you to calculate your position size (lotage) much faster, which is essential in a fast-moving 1m environment.
REQUIREMENT:This indicator is designed to work ONLY on the 1-minute (1m) timeframe. It will display an error and show no data on any other chart.

VSA No Supply by MashrabNo Supply Signal created by Mashrab
Hi everyone! This indicator helps you find low-risk entry points during an existing uptrend.
Its main job is to spot "quiet" pauses in a stock's advance, right before it's ready to continue its upward move.
What's the Big Idea?
Think of a stock in an uptrend like someone climbing a staircase. They can't sprint to the top all at once! Eventually, they need to pause, catch their breath, and then continue climbing.
This indicator helps you find that "catch your breath" moment. It looks for a specific signal that shows all the sellers are gone (what we call "No Supply"). When there's no one left to sell, the stock is much more likely to go up.
How It Works (The Signals)
The indicator gives you two simple signals on your chart:
1. The "Get Ready" Signal (Grey Dot)
The indicator is always checking to make sure the stock is in a general uptrend. When it spots a Grey Dot, it's telling you: "Hey, the stock just had a quiet pullback day. Pay attention!"
This dot only appears if the bar meets four conditions:
It's a "down" bar (closed lower than it opened).
It has low volume (this is key! It shows sellers aren't interested).
It has a narrow range (it was a quiet, low-volatility bar).
It closed in the top half of its range (buyers easily stepped in).
When you see a Grey Dot, you don't buy yet. You just add the stock to your watchlist.
2. The "Go" Signal (Blue Triangle)
This is your entry trigger! A Blue Triangle appears on the next bar only if it confirms the upward move. This bar must be:
An "up" bar (closed higher than it opened).
It has high volume (showing that buyers and "big money" are now back and pushing the price up with conviction).
How to Use This Indicator
Grey Dot: See this? The setup looks good. Time to watch this stock.
Blue Triangle: See this? This is your entry confirmation. The move is now "on."
Red Line: This is your safety net. The indicator automatically draws your Stop-Loss at the low of the "Grey Dot" bar. This helps you define your risk on the trade right from the start.
Settings
Uptrend MA Period: (Default: 50) This is just the moving average used to make sure the stock is in an uptrend.
Volume/Range Lookback: (Default: 20) This is how many bars the indicator looks back at to decide what "average" volume or "average" range is.
That's it! I hope this tool helps you find great setups. As always, this isn't a magic crystal ball. It's a tool to help you react to the market. Test it out, and happy trading!

Stoch PRO + Dynamic EMA (EMA cross)Stoch PRO + Dynamic EMA Documentation
Overview:
- Pine Script v6 overlay indicator combining a trend-colored EMA with a Stochastic oscillator to highlight midline momentum shifts.
- Designed for TradingView charts (Indicators → Import) as a visual aid for timing entries within trend-following setups.
- Crafted and optimized around BTCUSDT on the 4h timeframe; adapt inputs before applying to other markets or intervals.
Inputs:
- EMA Length (default 50): smoothing window for the dynamic EMA; lower values respond faster but whipsaw more.
- Stochastic K Length (20): lookback for the raw %K calculation.
- Stochastic K Smoothing (3): SMA applied to %K to reduce noise.
- Stochastic D Smoothing (3): SMA over %K to produce the companion %D line.
Visual Elements:
- EMA plotted on price with linewidth 3; teal when close > EMA, fuchsia otherwise.
- Background tinted teal/fuchsia at high transparency (≈92) to reinforce the current trend bias without obscuring price bars.
Oscillator Logic:
- %K = ta.stoch(high, low, close, kLength); smoothed with ta.sma(kRaw, kSmooth).
- %D = ta.sma(k, dSmooth).
- Focus is on the midline (50) rather than traditional 20/80 extremes to emphasize rapid momentum flips.
Signals:
- Buy: %K crossing above 50 while close > EMA (teal state). Plots tiny teal circle below the bar.
- Sell: %K crossing below 50 while close < EMA (fuchsia state). Plots tiny purple circle above the bar.
Trading Workflow Tips:
- Use EMA/background color for directional bias, then confirm with %K 50-cross to refine entries.
- Consider higher-timeframe trend filters or price-action confirmation to avoid range chop.
- Stops often sit just beyond the EMA; adjust thresholds (e.g., 55/45) if too many false positives occur.
- Always plan risk/reward upfront—define TP/SL levels that fit your strategy and backtest them thoroughly before trading live.
Alerts & Extensions:
- Wrap crossUp/crossDown in alertcondition() if TradingView alerts are needed.
- For automation/backtesting, convert logic to a strategy() script or add position management rules.

Hindenburg OmenThe Hindenburg Omen highlights periods of internal market stress — when both new 52-week highs and new lows expand while the NYSE remains in an uptrend.
This condition often precedes major corrections or volatility spikes by revealing divergence beneath the surface of an advancing market.
The indicator triggers when four classic breadth rules align: elevated highs and lows, a positive trend, a negative McClellan Oscillator, and a highs-to-lows ratio under 2:1.
Use it on broad indices (NYSE, S&P 500) as an early-warning context tool, NOT a standalone sell signal.

NQ - 4MAvg + CompositeNDFD, NDFI, NDOH, NDTH - 4 Nasdaq Moving Average indicators + a combined composite
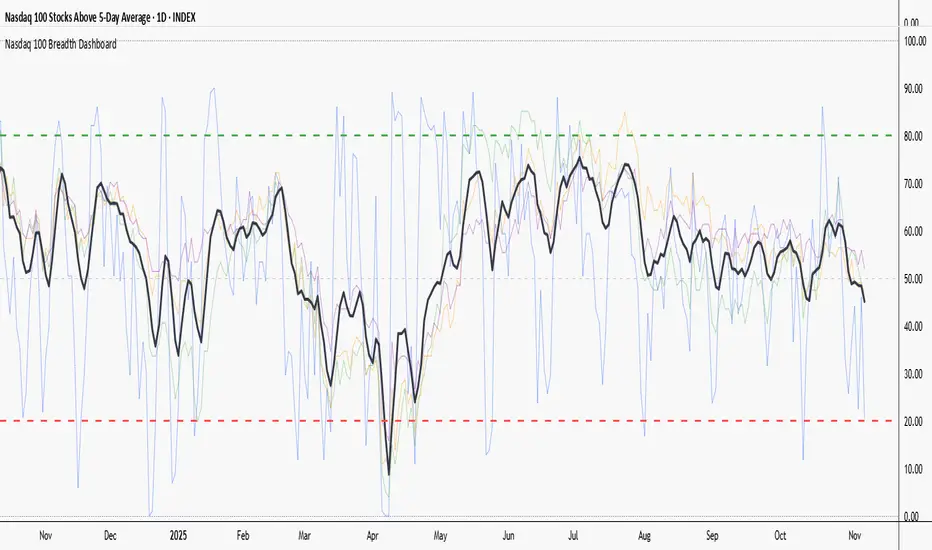
Nasdaq 100 Breadth Composite (sjmccormick)Small indicator combining NDFD, NDFI, NDOH, NFTH into a composite indicator with overbought and oversold areas

RMBS Smart Detector - Multi-Factor Momentum System v2# RMBS Smart Detector - Multi-Factor Momentum System
## Overview
RMBS (Smart Detector - Multi-Factor Momentum System) is a proprietary scoring method developed by Ario, combining normalized RSI and Bollinger band positioning into a single composite metric.
---
## Core Methodology
### Buy/Sell Logic
Marker (green or red )appear when **all four filters** pass:
**1. RMBS Score (Momentum Strength)**
From the formula Bellow
Combined Range: -10 (extreme bearish) to +10 (extreme bullish)
Signal Thresholds:
• BUY: Score > +3.0
• SELL: Score < -3.0
2. EMA Trend Filter
BUY: EMA(21) > EMA(55) → Uptrend confirmed
SELL: EMA(21) < EMA(55) → Downtrend confirmed
3. ADX Strength Filter
Minimum ADX: 25 (adjustable 20-30)
ADX > 25: Trending market → Signal allowed
ADX < 25: Range-bound → Signal blocked
4. Alternating Logic
Prevents signal spam by requiring alternation:
✓ BUY → SELL → BUY (allowed)
✗ BUY → BUY → BUY (blocked)
________________________________________
Mathematical Foundation
RMBS Formula: scoring method developed by Ario
RMBS = (RSI – 50) / 10 + ((BB_pos – 50) / 10)
where:
• RSI = Relative Strength Index (close, L)
• BB_pos = (Close – (SMA – 2 σ)) / ((SMA + 2 σ) – (SMA – 2 σ)) × 100
• σ = standard deviation of close over lookback L
• SMA = simple moving average of close over lookback L
• L = rmbs_length (period setting)
This produces a normalized composite score around zero:
• Positive → bullish momentum and upper band dominance
• Negative → bearish momentum and lower band pressure
• Near 0 → neutral or transitional zone
Input Parameters
ADX Threshold (default: 25)
• Lower (20-23): More signals, less filtering
• Higher (28-30): Fewer signals, stronger trends
• Recommended: 25 for balanced filtering
Signal Thresholds
• BUY: +3.0 (adjustable)
• SELL: -3.0 (adjustable)
Visual Options
• Marker colors
• Background highlights
• Alert settings
________________________________________
Usage Guidelines
How to Interpret
• 🟢 Green Marker: All conditions met for Bull condition
• 🔴 Red Marker: All conditions met for Bear condition
• No Marker: Waiting for confirmation
________________________________________
Important Disclaimers
⚠️ Educational Purpose Only
• This tool demonstrates multi-factor technical analysis concepts
• Not financial advice or trade recommendations
• No guarantee of profitability
⚠️ Known Limitations
• Less effective in ranging/choppy markets
• Requires proper risk management (stop-loss, position sizing)
• Should be combined with fundamental analysis
⚠️ Risk Warning
Trading involves substantial risk of loss. Past performance does not indicate future results. Always conduct your own research and consult professionals before trading.
________________________________________
Open Source
Full Pine Script code available for educational study and modification. Feedback and improvement suggestions welcome.
“All logic is presented for research and educational visualization.”

God of Scalping BTCUnleash divine precision in the chaotic realm of BTC scalping with the God of Scalping BTC—a bespoke, price-action powerhouse crafted for lightning-fast entries and exits on 1-5 minute charts. Forged from raw momentum velocity (no recycled RSI or MACD here), this indicator detects micro-trend accelerations to pinpoint surge moments where BTC's volatility bends to your will.Core Mechanics:Velocity Engine: Calculates fast (default: 3-bar) and slow (default: 8-bar) price speeds, then derives normalized acceleration using ATR (14-bar) to filter noise in BTC's wild swings.
Surge Detection: Smoothed signal line confirms crossovers—bullish when acceleration surges above signal with positive bias; bearish on the downside.
Volume Guardian: Triggers only on 20%+ volume spikes above its EMA (10-bar), ensuring conviction behind the chaos.
Visual Oracle:Blue/Red Lines: Fast (EMA close, 3-bar) and slow (EMA close, 8-bar) velocity trends for trend context.
Background Glow: Subtle green/red tint for real-time momentum bias.
Divine Arrows: Green triangles below bars for BUY surges; red above for SELL—your scalp signals from the heavens.
Scalping Ritual:Optimal Altar: Load on BTCUSD/USDT (1m-5m). Tune lengths for your broker's feed.
Invocation: Enter long on green arrow (target 0.1-0.3% gains), short on red. Tight stops at recent swings; exit on opposite signal or threshold breach (1.5x mult).
Alerts: Built-in notifications—"God Surge Buy: BTC Scalp Entry!"—to summon you mid-prayer (er, trade).
Backtested for BTC's fury, this isn't a holy grail, but a scalper's Excalibur: pure, adaptive, and unyielding. Trade wisely—markets are mortal, your edge is eternal.

TMA BUY TMA buy mometum indiactor , which helps you to identify mometum traders very simple . it gfives buy signal when you price croses 50 ema .

BlackScrum Swing Boxes 1/2/3 After seeing influencers selling their indicator suite's online, I decided to start making replicas of them, maybe mine are better, maybe they are worse. I use them in my day to day trading and they help me make money, hopefully they help you make money.
Not financial advice, Do Your Own Research.
Everything provided without warranty or liability. If you stuff up, learn from it, get better, we all make mistakes.
// BlackScrum — 1/2/3-Bar Swing Boxes (auto timeframe)
//
// DESCRIPTION
// This indicator displays three swing-direction boxes (1B, 2B, 3B) in the top-right corner of the chart.
// The boxes automatically adapt to the chart's timeframe (15m, 1H, 4H, 1D, etc.).
// Each box represents the direction of the most recently confirmed swing pivot:
// • 1B → 1-bar swing (fastest, most sensitive)
// • 2B → 2-bar swing (medium confirmation)
// • 3B → 3-bar swing (slowest, strongest confirmation)
//
// COLORS
// • GREEN = last confirmed swing pivot was a higher low (up swing)
// • RED = last confirmed swing pivot was a lower high (down swing)
// • GREY = no clear swing yet (fresh/transition area)
//
// CONFLUENCE
// • ALL GREEN = bullish alignment across 1B, 2B, 3B → strong trend continuation signal
// • ALL RED = bearish alignment across all three → strong downtrend continuation signal
//
// HOW TO USE (TRADEPLAY)
//
// 1) ENTRIES
// • Aggressive entry → enter when ALL GREEN prints on your timeframe.
// • Safer pullback entry → wait for 1B to briefly turn red during a green 2B/3B,
// then flip back to green. Enter on the re-flip.
// • Multi-timeframe filter:
// Take longs only when higher TF (e.g., 1H/4H) boxes are at least neutral-to-green.
//
// 2) EXITS
// • Weakness exit → when 1B flips against your position while 2B is neutral/red.
// • Full exit → when ALL RED prints.
// • Time stop → if price hasn’t moved after several bars of your execution timeframe.
//
// 3) STOP-LOSS / RISK
// • Place stops beyond the latest opposite swing used by 2B or 3B.
// • Add 0.5–1× ATR buffer if your market has stop-hunt volatility.
// • Always size position based on the distance to the swing stop.
//
// 4) WHEN TO IGNORE SIGNALS
// • Chop zones → 1B flipping repeatedly while 2B/3B disagree.
// • News candles → wait for pivots to confirm on the *closed* bar.
//
// 5) USING WITH OTHER TOOLS
// • With a trend ribbon (e.g., Larsson-style):
// Only take ALL GREEN longs when the ribbon is UP, and ALL RED shorts when ribbon is DOWN.
// • With a Fear & Greed index:
// Prefer longs when F&G > 60,
// Avoid longs when F&G < 40 unless countertrend scalping.
//
// 6) TIMEFRAME GUIDANCE
// • Scalping: 5m / 15m, confirmed by 1H or 4H boxes.
// • Swinging: 1H / 4H with daily filter.
// • Positioning: 1D with weekly confirmation.
//
// 7) INTERPRETATION CHEATSHEET
// • 1B green, 2B grey, 3B red → short-term bounce inside higher timeframe downtrend.
// • 1B/2B green, 3B grey → early trend reversal forming.
// • All grey → fresh swing area; wait for direction.
//
// 8) CUSTOMIZATION
// • len1 / len2 / len3 control sensitivity (higher = slower & cleaner).
// • Can add a timeframe header box (e.g., “15m / 4H / 1D”).
// • Can add a multi-timeframe grid (e.g., 15m | 1H | 4H | 1D each with 1B/2B/3B).
//
// ====================================================================================================

Adil Hoca - US Market Score Only NasdaqMarket Score & Crash Detector Indicator
User Guide & Usage Instructions
This TradingView indicator provides a comprehensive market risk assessment, combining multiple financial metrics to detect potential market crashes, recessions, and overall trend regimes. It is especially designed to alert traders and investors about early warning signals before significant market downturns, enabling proactive decision-making.
Key Features
Multi-Metric Market Sentiment: Uses volatility indices, currency strength, yield spreads, breadth, and bond ratios to evaluate market health.
Crash Detection System: Monitors various conditions such as VIX spikes, breadth collapse, momentum cliffs, high-yield spread surges, and hidden market weaknesses.
Reccession Indicator: Incorporates the Sahm Rule, a proven recession indicator based on employment data.
Alert System: Sends real-time alerts for critical market conditions, including crashes, recession signals, and spreads alerts.
Visual Elements: Includes histograms, trend lines, threshold lines, and shape signals to visually interpret market states.
Customizable Parameters: Adjust weights, sensitivity, thresholds, and alert preferences to suit your trading style.
How it Works
1. Data Collection
The indicator fetches data from multiple sources:
Market volatility: VIX index
Currency strength: DXY index
Interest rates: SOFR, PCE inflation
Yield spreads: High Yield Credit Spread, Investment Grade Spread
Market Breadth: Ratio of QQQ to TLT (tech vs. bonds)
Bond Ratios: TMF/TMV (long-term bonds)
Employment Data: The Sahm Rule (monthly unemployment data)
2. Normalization
Data is normalized via z-score calculations over defined periods to standardize the metrics, making them comparable regardless of their original scale.
3. Composite Score Calculation
Each metric is weighted according to user-defined parameters, and a composite score is generated to represent the overall market sentiment, smoothed with an EMA for trend clarity.
4. Crash & Recession Detection
Crash System: Looks for conditions like VIX spikes, breadth collapse, momentum drops, high yield spread surges, and hidden weaknesses. If multiple conditions meet thresholds, alerts trigger.
Recession Indicator: Uses the Sahm Rule, which compares the current unemployment rate's three-month average to the lowest point over the past 12 months. When it exceeds a certain threshold, a recession signal is generated.
5. Alerts & Visualization
Sound & Shape Alerts: Signals like warning triangles, cross icons, and color changes.
Threshold Lines: Indicate levels like "Strong Bullish," "Strong Bear," and critical zones.
Dual Confirmation: Combines crash and recession signals for high-confidence alerts.
Usage & Customization
Placing the Indicator
Copy and paste the Pine Script code into TradingView's Pine Editor.
Save and add the script to your chart. Adjust inputs like weights, sensitivity mode, thresholds, and alert preferences via the input panel.
Key Inputs
Weights: Customize the importance of each metric.
Sensitivity Mode: Changes alert thresholds for early warnings.
Crash Sensitivity: Defines how many indicators need to trigger before issuing a crash alert.
Recession Thresholds: Set the unemployment level that signals recession.
Interpreting Visuals
Histogram: Shows the composite score; green means bullish, red indicates bearish.
Momentum Line: Highlights trend acceleration/deceleration.
Threshold Lines: Dotted/dashed lines showing critical zones.
Shape Shapes: Triangles or crosses appear for early signals or critical events.
Alerts
Crash Alerts: Warn of imminent market crashes.
Recession Alerts: Indicate economic downturns based on Sahm Rule.
Spread Alerts: Show high-yield credit spread surges signaling stress.
Double Confirmation: High-confidence signals when crash and recession conditions align.
Best Practices
Use on multiple timeframes for confirmation.
Combine with other technical analysis tools for better accuracy.
Adjust thresholds according to your risk appetite.
Follow alert signals for early warning but always consider overall context.
Final Notes
This indicator synthesizes a variety of leading and lagging indicators to give a holistic view of market health. It is designed to provide early warnings, especially in volatile or stressed environments, helping traders avoid severe drawdowns or position ahead of major downturns.
Feel free to modify input parameters for your preferences, or integrate additional data sources for further refinement.
This detailed explanation can be directly included as a description or documentation within your TradingView script, helping users grasp its full capabilities and optimal usage.

Session ParmezanForex Session Range Boxes (Asia, Europe, US) — visual intraday session tracker for Forex and metals.
This indicator automatically marks the three major Forex trading sessions — Asian (Tokyo), European (London), and American (New York) — directly on your chart using dynamic colored boxes.
Each box represents the full price range (High–Low) formed during that session, helping traders visualize how volatility and liquidity evolve across the global trading day.
The script is built for intraday traders and session-based strategies, especially those who monitor breakouts from the Asian range or reactions during London–New York overlaps.
⚙️ Features
• Accurate session timing (UTC+3 / Moscow Time) — Asia: 03:00–12:00, Europe: 11:00–20:00, US: 16:00–01:00.
• Dynamic range boxes: each box expands in real time as new highs and lows are set during the session.
• Clear visual separation: each session is shown in its own color (blue for Asia, orange for Europe, green for US).
• Automatic daily reset — new boxes start every new session.
• Intraday focus only — visible up to the 1-hour timeframe (M1–H1) for clarity.
• Transparent design — semi-transparent fills keep candles readable even when sessions overlap.
• Lightweight performance — optimized use of box.new() and var variables avoids lag on lower timeframes.
🧭 Typical Use-Cases
• Identify Asian session ranges and watch for London breakouts or New York reversals.
• Visually align your intraday strategy with session volatility cycles.
• Combine with VWAP, liquidity zones, or market profile indicators for deeper confluence.
• Spot overlapping sessions — often the most active periods of the day.

Crypto Breadth Engine [alex975]
A normalized crypto market breadth indicator with a customizable 40 coin input panel — revealing whether rallies are broad and healthy across major coins and altcoins or led by only a few.
📊 Overview
The Crypto Breadth Engine measures the real participation strength of the crypto market by analyzing the direction of the 40 largest cryptocurrencies by market capitalization.
⚙️ How It Works
Unlike standard breadth tools that only count assets above a moving average, this indicator measures actual price direction:
+1 if a coin closes higher, –1 if lower, 0 if unchanged.
The total forms a Breadth Line, statistically normalized using standard deviation to maintain consistent readings across timeframes and volatility conditions.
🧩 Dynamic Input Mask
All 40 cryptocurrencies are fully editable via the input panel, allowing users to easily replace or customize the basket (Top 40, Layer-1s, DeFi, Meme Coins, AI Tokens, etc.) without touching the code.
This flexibility keeps the indicator aligned with the evolving crypto market.
🧭 Trend Bias
The indicator classifies market structure as Bullish, Neutral, or Bearish, based on how the Breadth Line aligns with its moving averages (10, 20, 50).
💡 Dashboard
A compact on-chart table displays in real time:
• Positive and negative coins
• Participation percentage
• Current trend bias
🔍 Interpretation
• Rising breadth → broad, healthy market expansion
• Falling breadth → narrowing participation and structural weakness
Ideal for TOTAL, TOTAL3, or custom crypto baskets on 1D,1W.
Developed by alex975 – Version 1.0 (2025).
-------------------------------------------------------------------------------------
🇮🇹 Versione Italiana
📊 Panoramica
Il Crypto Breadth Engine misura la partecipazione reale del mercato crypto, analizzando la direzione delle 40 principali criptovalute per capitalizzazione.
Non si limita a contare quante coin sono sopra una media mobile, ma calcola la variazione effettiva del prezzo:
+1 se sale, –1 se scende, 0 se invariato.
La somma genera una Breadth Line normalizzata statisticamente, garantendo letture coerenti su diversi timeframe e fasi di volatilità.
🧩 Mascherina dinamica
L’indicatore include una mascherina d’input interattiva che consente di modificare o sostituire liberamente i 40 ticker analizzati (Top 40, Layer-1, DeFi, Meme Coin, ecc.) senza intervenire nel codice.
Questo lo rende sempre aggiornato e adattabile all’evoluzione del mercato crypto.
⚙️ Funzionamento e Trend Bias
Classifica automaticamente il mercato come Bullish, Neutral o Bearish in base alla relazione tra la breadth e le medie mobili (10, 20, 50 periodi).
💡 Dashboard
Una tabella compatta mostra in tempo reale:
• Numero di coin positive e negative
• Percentuale di partecipazione
• Stato attuale del trend
🔍 Interpretazione
• Breadth in crescita → mercato ampio e trend sano
• Breadth in calo → partecipazione ridotta e concentrazione su pochi asset
Ideale per analizzare TOTAL, TOTAL3 o panieri personalizzati di crypto.
Funziona su timeframe 1D, 4H, 1W.
Sviluppato da alex975 – Versione 1.0 (2025).

💎 Trend Master Pro Scalping MTFTrend Master Pro Scalping MTF is a professional-grade indicator designed for intraday trading and scalping, optimized for 1M, 5M, and 15M timeframes. It combines multiple technical filters to provide high-confidence breakout and trend signals with visual clarity.
Key Features:
Multi-indicator analysis: EMA, RSI, ATR, SuperTrend, and volume.
Multi-Timeframe (MTF) filter: signals are validated only if the higher timeframe trend is aligned.
Clear visual signals: colored triangles and dynamic labels showing signal strength: A++, A+, A, B.
Confirmation dashboard: instantly see EMA trend, RSI strength, volume, ATR activity, SuperTrend direction, and final signal on your chart.
Reliable alerts: fixed alert messages compatible with TradingView, avoiding Pine Script errors.
Customizable parameters: adjust EMA, RSI, ATR, volume, and SuperTrend settings to match your scalping or day trading style.
How to Use:
Select your desired timeframe: 1M, 5M, or 15M.
Look for signals rated A++ or A+ for maximum probability.
Confirm trends using labels and the dashboard before entering trades.
Receive real-time notifications via alerts when confirmed signals occur.
Benefits:
Ideal for quick scalping and intraday strategies.
Reduces false signals with MTF trend filtering.
Professional visualization for fast and confident decision-making.
Recommendations:
Test on a demo account before trading live.
Adjust parameters to fit your asset and timeframe.
Combine with proper risk management strategies.

DD RatioThe DD Ratio (“Directional Distribution Ratio”) is a breadth indicator that shows, in real time, how many of the selected stocks (e.g., S&P 500 components) are bullish vs. bearish relative to today’s open.
The DD Ratio tells you what’s really happening under the hood of the index:
Futures may mislead: An index future (like ES or NQ) can rise on a few heavy-weighted stocks even while most components fall.
The DD Ratio exposes that divergence.
Breadth confirmation: When the futures are up and DD Ratio ≥ 0.5 → healthy rally.
When futures are up but DD Ratio < 0.5 → weak, narrow advance.
Intraday sentiment gauge: It updates live with each bar, reflecting “who’s winning” since the open.

