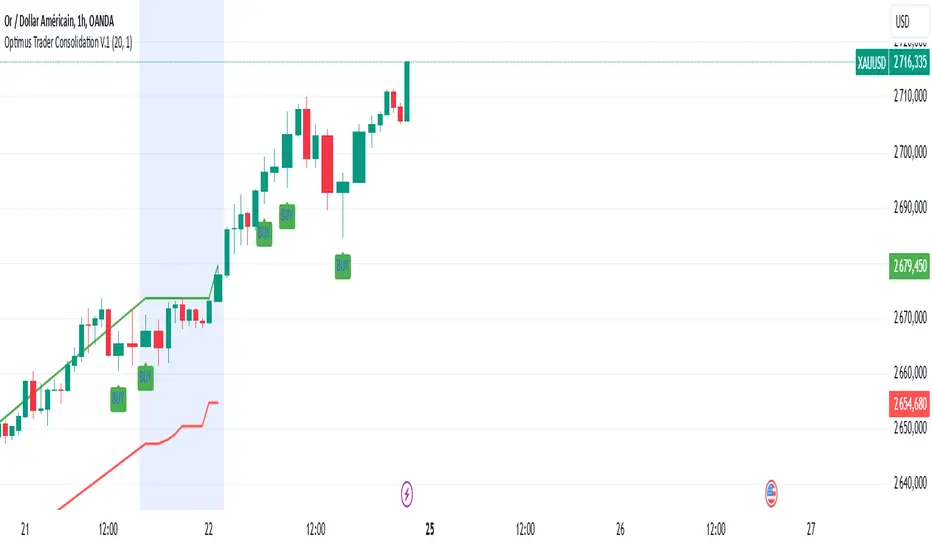
Optimus Trader Consolidation V.1 Indicator Description: "Optimus Trader Consolidation V.1"
This Pine Script indicator is designed to assist traders by identifying key market conditions, including **trend direction**, **volume dynamics**, **liquidity zones**, and **consolidation periods**, alongside candlestick patterns like **Pin Bars** and **Inside Bars**. It provides clear buy and sell signals based on a confluence of these factors. Here’s a detailed breakdown of its functionality:
---
Key Features:
1. **Moving Average (MA) and VWAP Integration**:
- The indicator uses a 50-period Simple Moving Average (SMA) and VWAP (Volume Weighted Average Price) to identify the market trend.
- **Uptrend**: Price is above both the MA and VWAP.
- **Downtrend**: Price is below both the MA and VWAP.
2. **Volume Threshold**:
- A dynamic volume threshold is calculated based on the 20-period SMA of volume, multiplied by a factor of 1.2.
- This ensures signals are filtered to consider only significant volume spikes, avoiding noise from low-volume periods.
3. **Pin Bar Detection**:
- Identifies bullish and bearish Pin Bars based on candlestick characteristics:
- **Bullish Pin Bar**: Large wick above the body, small lower wick, and a green body.
- **Bearish Pin Bar**: Large wick below the body, small upper wick, and a red body.
4. **Inside Bar Detection**:
- Detects Inside Bars, where the current candle’s high and low are fully contained within the previous candle’s range.
- Indicates a period of indecision or potential breakout zones.
5. **Liquidity Zone Identification**:
- Uses recent 20-period highs and lows to approximate liquidity zones.
- Highlights areas where price is near these zones, indicating potential support or resistance.
6. **Buy and Sell Signal Generation**:
- **Buy Signal**: Triggered when a bullish Pin Bar or Inside Bar occurs in an uptrend, with high volume, and near liquidity zones.
- **Sell Signal**: Triggered when a bearish Pin Bar or Inside Bar occurs in a downtrend, with high volume, and near liquidity zones.
- Signals are visually plotted with green (BUY) and red (SELL) markers.
7. **Consolidation Zone Detection**:
- Identifies periods of low price range volatility using a user-defined period (`length`) and range threshold (`range_threshold` in %).
- Highlights periods where the price range is less than the threshold, visually marking consolidation zones.
- Upper and lower boundaries of consolidation zones are plotted with green and red lines, respectively.
8. **Visual Enhancements**:
- Consolidation zones are shaded with a blue background to make them easily recognizable.
- Clear markers for buy and sell signals help traders quickly spot opportunities.
---
Use Cases:
- **Trend Confirmation**: By integrating MA, VWAP, and volume analysis, this indicator helps confirm trends before entering trades.
- **Liquidity Zone Trading**: Identifies price areas where support or resistance may lead to significant price movement.
- **Consolidation Breakouts**: Highlights consolidation zones, which often precede explosive moves, allowing traders to anticipate breakouts.
- **Candlestick Reversal Patterns**: Pin Bars and Inside Bars are powerful patterns that provide early indications of potential reversals or continuation setups.
---
Customizable Parameters:
- **MA Period**: Length of the moving average (default: 50).
- **Volume Threshold**: Sensitivity to volume spikes (default: 20-period SMA × 1.2).
- **Consolidation Period**: Lookback period for identifying consolidation (default: 20).
- **Consolidation Range Threshold**: Maximum percentage range considered as consolidation (default: 1%).
---
Visualization:
- **Green BUY Signals**: Bullish opportunities based on confluence of patterns, trends, and volume.
- **Red SELL Signals**: Bearish opportunities under similar conditions.
- **Consolidation Zones**: Marked by shaded blue backgrounds and clear horizontal lines for high and low boundaries.
- **Dynamic Levels**: Liquidity zones (highs and lows) plotted for added context.
---
Advantages:
- **Confluence of Factors**: Combines trend, volume, and candlestick analysis for robust signal generation.
- **Market State Detection**: Effectively identifies consolidation and breakout conditions.
- **Customizable**: Users can fine-tune parameters for different instruments or trading styles.
---
This indicator is ideal for traders seeking a comprehensive tool to navigate market conditions with precision, leveraging multiple layers of analysis in a single, easy-to-use overlay.
Breakouts
Candle Flip System - CFSCandle Flip System - CFS
The Candle Flip System checklist table is a tool designed for traders seeking a structured approach to decision-making. This indicator provides a visual checklist to validate critical conditions before entering a trade. It includes:
1. Previous D1 Candle Analysis:
Displays whether the previous daily candle closed bullish or bearish, indicated by intuitive markers.
2. 4-Hour Alignment Check:
Confirms if the bias of the previous 4-hour candle aligns with the previous daily candle's bias.
Outputs "YES" in green for alignment or "NO" in red for misalignment.
This indicator simplifies multi-timeframe analysis and ensures a systematic evaluation of key trading conditions, enabling traders to make more confident and disciplined decisions.
How to Use:
1. Apply the indicator to your chart.
2. Observe the table displayed in the top-right corner.
3. Use the information to validate your trading strategy before entering a trade.

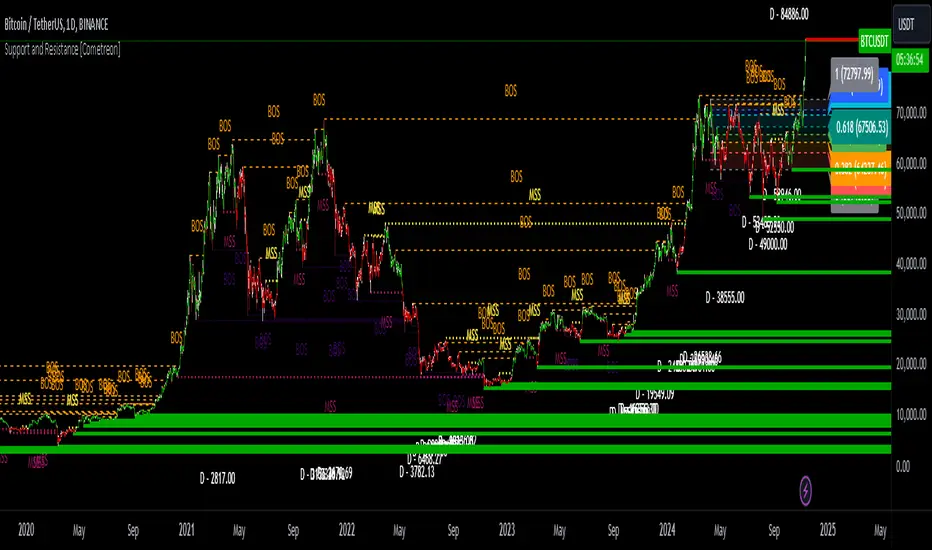
Support and Resistance MTF [Cometreon]The Support and Resistance MTF elevates your technical analysis by automatically identifying and plotting critical support and resistance levels across any symbol and timeframe—even higher ones. Powered by advanced algorithms, this tool continuously analyzes market structure and updates in real time, saving you hours of manual analysis.
If you're looking for a smart, dynamic, and highly customizable S&R solution, this is the tool for you.
🔷 Key Features & Improvements
🟩 Automatic Level Detection
The indicator automatically plots all support and resistance levels, providing a clear map of key points on the chart.
🟩 Historical Level Display
Shows historical support and resistance levels, providing a comprehensive view of the market over time.
🟩 Dynamic Trend Creation
Automatically identifies and updates trends based on levels, simplifying the understanding of market directions.
🟩 Automatic Fibonacci
Generates Fibonacci levels based on the last two support and resistance levels, offering additional reference points for potential price retracements or extensions.
🟩 Customizable Alerts
Offers a series of configurable alerts to keep you informed about breakouts, new confirmed levels, and price bounces on active levels.
🔷 Technical Details and Customizable Inputs
1️⃣ Line Types - Select the type of lines to display: active, broken, both, or none.
2️⃣ Left Length - Determines the number of candles to calculate the previous high or low point.
3️⃣ Right Length - Defines the number of candles needed to confirm a level as Support or Resistance.
4️⃣ Timeframe - You can modify the timeframe of supports and resistances to view levels of a higher timeframe. It's also possible to add additional support and resistance levels using a second timeframe.
5️⃣ Breakout Source - Change the source needed to break support and resistance levels between Close or High/Low.
6️⃣ Delete at Timeframe - Allows removing levels based on the current chart resource instead of using that of the higher timeframe.
7️⃣ Session Range - Choose a period of distance from the last candle to define how far back in the past the indicator should look for Supports or Resistances.
8️⃣ Style Valid Level - Customize the appearance of active levels, including the color of the level itself, Liquidity fill, text color, line style and thickness, extension, as well as the size, position, and values to display in the level text.
9️⃣ Liquidity - This option displays the liquidity associated with each support and resistance level, with three modes: "Wick" which goes from the high/low to the upper/lower body, "Body" instead goes from the level to the lower/upper body of the candle and "Full Range" which extends from the high to the low of the candle.
1️⃣0️⃣ Style Break Level - Allows modifying color, style, and thickness of lines, as well as text width, for two types of breakouts: "MSS" and "BOS".
" MSS " stands for " Market Structure Switch " and indicates a level breakout opposite to the previous breakout, signaling a trend reversal.
" BOS ", on the other hand, means " Break of Structure" and occurs when a level is broken in the same direction as the previous one, confirming trend continuation.
1️⃣1️⃣ Fibonacci Trend Line - Add up to 8 Fibonacci levels based on the last two identified support and resistance levels. Customize the different levels by modifying colors, thickness, style, and extension of lines. You also have the option to add a transparent background between each level.
1️⃣2️⃣ Use Only Confirmed Levels - Activate this option if you want the system to use only the last two confirmed levels, excluding potential levels not yet confirmed.
1️⃣3️⃣ Reverse - Used to reverse the direction of Fibonacci lines.
1️⃣4️⃣ Use Higher / Lower - This option allows using the currently active maximum and minimum levels of Support and Resistance. The indicator will update each Support level until it encounters another active Resistance, and vice versa.
1️⃣5️⃣ Trend Style - Activate/deactivate two types of indicator Trends: "Bar Color" based on level breakouts and "Background Color" based on the last active unconfirmed level.
1️⃣6️⃣ Signal Style - Activate or deactivate the various breakout and bounce signals. Bounces present three options:
Total Rejection(TR) : occurs when the price exceeds the high or low and closes below the liquidity level.
Internal Rejection(IR) : the price closes in the liquidity zone.
Liquidity Rejection(LR) : the price does not exceed the high or low, but only the liquidity level, closing below it.
1️⃣7️⃣ Customized Alerts - Set alerts to be notified in case of breakouts, bounces, or formation of new levels.
These options allow you to optimize the indicator for different trading styles and market conditions, ensuring accurate and tailored technical analysis.
🔍 How to Use Support and Resistance MTF Pro
📌 Using Critical Levels
Consider all levels on the chart as "magnetic points" for the price. These represent critical areas where the market tends to react.
📈 Signal Interpretation
Use the indicator's signals to interpret market movements. A level breakout can indicate a trend reversal or continuation. Bounces can suggest the holding of a level or signal a possible breakout.
🛠 Strategy Integration
Leverage the trend of support and resistance levels, breakouts, and bounces as key elements to develop and refine your trading strategies.
☄️ Support and Resistance simplifies your market analysis, saving you time and improving the accuracy of your decisions. Thanks to clearly visualized and customizable levels, you'll have a clearer and more immediate view of market dynamics.
Don't wait any longer: discover how Support and Resistance can enhance your market analysis, offering you clear indications for faster and more precise trading decisions.
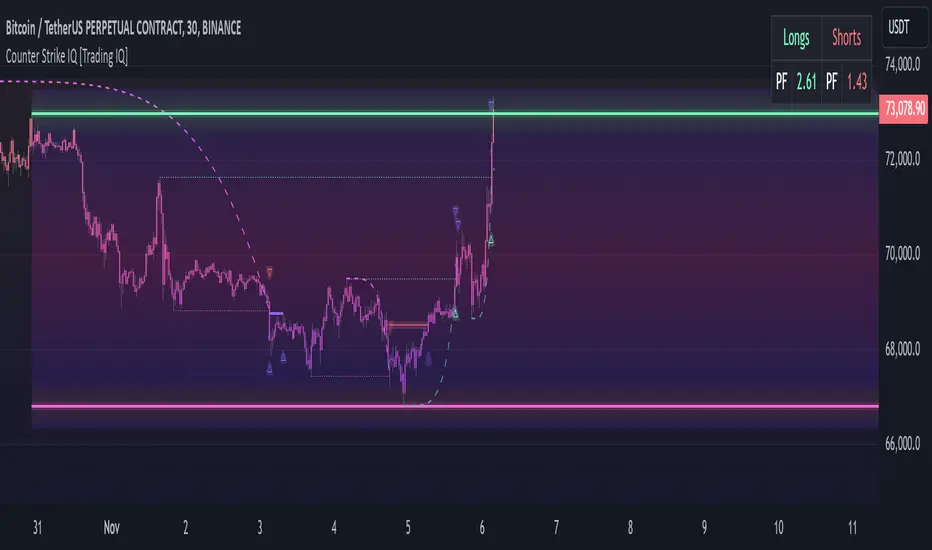
TradingIQ - Counter Strike IQIntroducing "Counter Strike IQ" by TradingIQ
Counter Strike IQ is an exclusive trading algorithm developed by TradingIQ, designed to trade upside/downside breakouts of varying significance. By integrating artificial intelligence and IQ Technology, Counter Strike IQ analyzes historical and real-time price data to construct a dynamic trading system adaptable to various asset and timeframe combinations.
Philosophy of Counter Strike IQ
Counter Strike IQ operates on a single premise: Support and resistance levels cannot hold forever. At some point either side must break for the underlying asset to exhibit trends; otherwise, prices would be confined to an infinitely narrowing range.
Counter Strike IQ is designed to work straight out of the box. In fact, its simplicity requires just four user settings to manage output, making it incredibly straightforward to manage.
Minimum ATR Profit, Minimum ATR Stop, EMA Filter and EMA Filter Length are the only settings that manage the performance of Counter Strike IQ!
Traders don’t have to spend hours adjusting settings and trying to find what works best - Counter Strike IQ handles this on its own.
Key Features of Counter Strike IQ
Self-Learning Breakout Detection
Employs AI and IQ Technology to identify notable breakouts in real-time.
AI-Generated Trading Signals
Provides breakout trading signals derived from self-learning algorithms.
Comprehensive Trading System
Offers clear entry and exit labels.
Performance Tracking
Records and presents trading performance data, easily accessible for user analysis.
Self-Learning Trading Exits
Counter Strike IQ learns where to exit positions.
Long and Short Trading Capabilities
Supports both long and short positions to trade various market conditions.
Strike Channel
The Strike Channel represents what Counter Strike IQ considers a tradable long opportunity or a tradable short opportunity. The Strike Channel is dynamic and adjusts from chart to chart.
IQ Graph Gradient
Introduces the IQ Graph Gradient, designed to classify extreme values in price on a grand scale.
How It Works
Counter Strike IQ operates on a straightforward heuristic: go long during significant upside price moves that break established resistance levels and go short during significant downside price moves that break established support levels.
IQ Technology, TradingIQ's proprietary AI algorithm, defines what constitutes a “significant price move” and what’s considered a tradable breakout. For Counter Strike IQ, this algorithm evaluates all historical support/resistance breaks and any subsequent breakouts. For instance, the price move following up to a breakout is measured and learned from, including the significance of the identified support/resistance level (how long it’s been active, how far price moved away from it, etc). By analyzing these patterns, Counter Strike IQ adapts to identify and trade similar future breakout sequences.
In simple terms, Counter Strike IQ learns from violations of historical support/resistance levels to identify potential entry points at currently established support/resistance levels. Using this knowledge, it determines the optimal, current support/resistance price level where a breakout has a higher chance of occurring.
For long positions, Counter Strike IQ places a stop-market order at the AI-identified resistance point. If price violates this level a market order will be placed and a long position entered. Of course, this is how the algorithm trades, users can elect to use a stop-limit order amongst other order types for position entry. After the position is entered TP1 is placed (identifiable on the price chart). TP1 has a twofold purpose:
Acts as a legitimate profit target to exit 50% of the position.
Once TP1 is closed over, the initial stop loss is converted to a trailing stop, and the long position remains active so long as price continues to uptrend.
For short positions, Counter Strike IQ places a stop-market order at the AI-identified support point. If price violates this level a market order will be placed and a short position entered. Again, this is how the algorithm trades, users can elect to use a stop-limit order amongst other order types for position entry. Upon entry TP1 is placed (identifiable on the price chart). TP1 has a twofold purpose:
Acts as a legitimate profit target to exit 50% of the position.
Once TP1 is closed over, the initial stop loss is converted to a trailing stop, and the short position remains active so long as price continues to downtrend.
As a trading system, Counter Strike IQ exits TP1 using a limit order, with all stop losses exited as stop market orders.
What Classifies As a Tradable Upside Breakout or Tradable Downside Breakout?
For Counter Strike IQ, tradable price breakouts are not manually set but are instead learned by the system. What qualifies as a significant upside or downside breakout in one market might not hold the same significance in another. Counter Strike IQ continuously analyzes historical and current support/resistance levels, how far price has extended from those levels, the raw-dollar price move leading up to a violation of those levels, their longevity, and more, to determine which future levels have a higher chance of breaking out when retested!
The image above illustrates the Strike Channel and explains the corresponding prices and levels
The green upper line represents the Long Breakout Point.
The pink lower line represents the Short Breakout Point.
Any price between the two deviation points is considered “Acceptable”.
The image above shows a long position being entered after the Upside Breakout Point was reached.
Green arrows indicate that the strategy entered a long position at the highlighted price level.
Blue arrows indicate that the strategy exited a position, whether at TP1, the initial stop loss, or at the trailing stop.
Blue lines indicate the TP1 level for the current trade. Red lines indicate the initial stop loss price.
If price closes above TP1, the initial stop loss will be replaced with a trailing stop. A blue line (similar to the blue line shown for TP1) will trail price and correspond to the trailing stop price of the trade.
The image above shows the trailing stop price, represented by a blue line, used for the long position!
You can also hover over the trade labels to get more information about the trade—such as the entry price and exit price.
The image above shows a short position being entered after the Downside Breakout Point was reached.
Red arrows indicate that the strategy entered a short position at the highlighted price level.
Blue arrows indicate that the strategy exited a position, whether at TP1, the initial stop loss, or at the trailing stop.
Blue lines indicate the TP1 level for the current trade. Red lines indicate the initial stop loss price.
If price closes below TP1, the initial stop loss will be replaced with a trailing stop. A blue line (similar to the blue line shown for TP1) will trail price and correspond to the trailing stop price of the trade.
The image above shows the trailing stop price, represented by a blue line, used for the short position!
You can also hover over the trade labels to get more information about the trade—such as the entry price and exit price.
IQ Gradient Graph
The IQ Gradient Graph provides a macro characterization of extreme prices.
The lower macro extremity of the IQ Gradient Graph is colored green, while the upper macro extremity is colored red.
Minimum Profit Target And Stop Loss
The Minimum ATR Profit Target and Minimum ATR Stop Loss setting control the minimum allowed profit target and stop loss distance. On most timeframes users won’t have to alter these settings; however, on very-low timeframes such as the 1-minute chart, users can increase these values so gross profits exceed commission.
After changing either setting, Counter Strike IQ will retrain on historical data - accounting for the newly defined minimum profit target or stop loss.
AI Direction
The AI Direction setting controls the trade direction Counter Strike IQ is allowed to take.
“Trade Longs” allows for long trades.
“Trade Shorts” allows for short trades.
EMA Filter
The EMA Filter setting controls whether the AI should implement an EMA trading filter. Simply, if the EMA Filter is active, long trades can only initiate if price is trading above the user-defined EMA. Conversely, short trades can only initiate if price is trading below the user-defined EMA.
The image above shows the EMA Filter in action!
Verifying Counter Strike IQ’s Effectiveness
Counter Strike IQ automatically tracks its performance and displays the profit factor for the long strategy and the short strategy it uses. This information can be found in the table located in the top-right corner of your chart showing.
This table shows the long strategy profit factor and the short strategy profit factor.
The image above shows the long strategy profit factor and the short strategy profit factor for Counter Strike IQ.
A profit factor greater than 1 indicates a strategy profitably traded historical price data.
A profit factor less than 1 indicates a strategy unprofitably traded historical price data.
A profit factor equal to 1 indicates a strategy did not lose or gain money when trading historical price data.
Using Counter Strike IQ
While Counter Strike IQ is a full-fledged trading system with entries and exits - manual traders can certainly make use of its on chart indications and visualizations.
The hallmark feature of Counter Strike IQ is its ability to signal a breakout near its origin point. Long entries are often signaled near the start of a large upside price move; short entries are often signaled near the start of a large downside price move.
For live analysis, the Strike Channel serves as a valuable tool for identifying breakout points.
The further price moves toward the Upside Breakout Point (green), the stronger the indication that price might breakout to the upside. Conversely, the deeper price reaches toward the Downside Breakout Point (red), the stronger the indication that price might breakout to the downside.
Of course, should buying or selling pressure stall, price may fail to breakout at the identified breakout level. This is a natural consequence of any breakout trading strategy!
With this information at hand, traders can quickly switch between charts and timeframes to identify optimized areas of interest.
Paid script
Salman Indicator: Multi-Purpose Price ActionSalman Indicator: Multi-Purpose Price Action Tool for Pin Bars, Breakouts, and VWAP Anchoring
This indicator provides a comprehensive suite of price action insights, designed for active traders looking to identify key market structures and potential reversals. The script incorporates a Quarterly VWAP for trend bias, marks pin bars for possible reversal points, highlights outside bars for volatility signals, and indicates simple breakouts and pivot-level breaks. Customizable settings allow for flexibility in various trading styles, with default settings optimized for daily charts.
Outside Bars : Represented by an ⤬ symbol on the chart, these indicate bars where the current high is greater than the previous bar’s high, and the low is lower than the previous bar’s low, signaling high volatility and potential market reversals.
Pin Bars : Denoted by a small dot at the top or bottom of a candle’s wick, these are crucial signals of potential reversal areas. Pin bars are identified based on the percentage length of their shadows, with adjustable strictness in settings.
Quarterly VWAP : The light blue line on the chart represents the VWAP (Volume-Weighted Average Price), which is anchored to the Quarterly period by default. The VWAP acts as a directional bias filter, helping you to determine underlying market trends. This period, source, and offset are fully adjustable in the script’s settings.
Simple Breaks : Hollow candles on the chart indicate "simple breaks," defined when the current bar closes above the previous high or below the previous low. This is an effective way to highlight directional momentum in the market.
Bonus Pivot Breaks : The tilde symbol ~ appears when the price closes above or below prior pivot high/low levels, helping traders spot significant breakout or breakdown points relative to recent pivots.
Alerts
Simple Breaks : Alerts you when a breakout occurs beyond the previous bar’s high or low. Pin Bars : Notifies you of potential reversal points as indicated by bullish or bearish pin bars. Outside Bars : Triggers an alert whenever an outside bar is detected, indicating possible volatility changes.
How to Use
VWAP for Trend Bias : Use the Quarterly VWAP line to gauge overall market trend, with settings that allow adjustment to daily, weekly, monthly, or even larger time frames.
Pin Bars for Reversal Potential : Look for the dot markers on candle wicks, where the strictness of the pin bar detection can be adjusted via settings to match your trading preference.
Simple and Pivot Breaks for Momentum : Watch for hollow candles and the tilde symbol ~ as indicators of potential breakout momentum and pivot break levels, respectively.
This script can serve traders on multiple timeframes, from daily to weekly and beyond. The flexible configuration allows for adjustments in VWAP anchoring and pin bar criteria, providing a tailored fit for individual trading strategies.

Advanced Volume-Driven Breakout SignalsThe "Advanced Volume-Driven Breakout Signals" indicator is a cutting-edge tool designed to help traders identify high-potential trading opportunities through sophisticated volume analysis techniques. This indicator integrates volume flow analysis, moving averages, and Relative Volume (RVOL) to provide a comprehensive view of market conditions, going beyond traditional Volume Spread Analysis (VSA) methods.
Key Features:
Volume Flow Analysis: Distinguishes bullish and bearish volume flows with distinct colors, making it easier to visualize market sentiment and potential breakout points.
Volume Flow Moving Averages: Calculates moving averages for volume using various methods (SMA, EMA, WMA, HMA, VWMA), accommodating different trading strategies. This includes settings for adjusting the type of moving average and its period, as well as thresholds for high, medium, and low volume levels.
Volume Spikes Detection: Identifies significant volume spikes based on user-defined multipliers and moving averages, highlighting unusual trading activity.
Volume MA Cloud Settings: Computes general moving averages of volume to track trends and detect deviations. This feature includes options to select different moving average types and adjust thresholds for detecting high volume activity.
Relative Volume (RVOL): Measures current volume relative to historical averages, triggering signals when RVOL exceeds predefined thresholds, indicating notable changes in trading activity.
Entry Conditions: Provides clear long and short entry signals based on combined volume flow conditions and RVOL, offering actionable trading opportunities.
Volume Visualization:
— Bullish Volume Flow: Light and dark green bars indicate bullish volume flow.
— Bearish Volume Flow: Light and dark red bars denote bearish volume flow.
— High Volume Bars: Highlighted in yellow, and extreme volume bars in orange for additional context. These bars are plotted for visual aid and do not directly influence trade signals, focusing instead on the quality and strength of the volume flow.
Alerts: Allows users to create alert notifications for long and short entry signals when the criteria are met, enabling traders to respond promptly to trading opportunities.
Usage:
Overlay: Apply the indicator directly to your price chart to visualise real-time signals and volume conditions.
Customisable: Adjust settings for moving averages, RVOL, and other parameters to match your trading strategy and preferences.
Comparison to VSA Scripts: The "Advanced Volume-Driven Breakout Signals" indicator extends beyond traditional VSA scripts by incorporating a wider range of analytical features. While VSA primarily focuses on volume spread patterns and price action, this indicator offers enhanced functionality with advanced RVOL metrics, customizable moving averages, and detailed volume spike detection, making it a more versatile tool for identifying breakout opportunities and managing trades. It is particularly effective when used alongside key levels and order blocks.
Acknowledgements: Special thanks to @oh92 and @goofoffgoose for their invaluable scripts, which served as inspiration in the development of this advanced trading indicator.
Notes: The script is continually evolving, with ongoing refinements aimed at enhancing accuracy and performance.

Opening Range with Breakouts & Targets [LuxAlgo]Opening Range with Breakouts & Targets is based on the long-standing Opening Range Breakout strategy popularized by traders such as Toby Crabel and Mark Fisher.
This indicator measures and displays the price range created from the first period within a new trading session, along with price breakouts from that range and targets associated with the range width.
🔶 USAGE
The Opening Range (OR) can be a powerful tool for making a clear distinction between ranging and trending trading days. Using a rigid structure for drawing a range, provides a consistent basis to make judgments and comparisons that will better assist the user in determining a hypothesis for the day's price action.
NOTE: During a suspected "Range Day", the Opening Range can be used for reversion strategies, typically targeting the opposite extreme of the range or the mean of the range. However, more commonly the Opening Range is used for breakouts on suspected "Trend Days", targeting further upward or downward market movement.
The common Opening Range Breakout Strategy (ORB) outlines a structure to enter and exit positions based on rigid points determined by the Opening Range. This methodology can be adjusted based on markets or trading styles.
Determine Opening Range High & Low: These are the high and low price within a chosen period of time after the market opens. This can be customized to the user's trading style and preference. Common Ranges are from 5-60 mins.
Watch for a Breakout with Volume: A Breakout occurs when price crosses the OR High (ORH) or OR Low (ORL), an increase in volume is typically desired when witnessing these breakouts to confirm a stronger movement.
Manage Risk: Based on user preference and the appropriately determined amount of risk, multiple ways can be determined to manage risk by using Opening Range.
For Example: A stop-loss could be set at OR Mean (ORM) or the opposite side of the range, while a profit target could optionally be set at the first price target generated by the script.
Alternatively, a user might want to use a Moving Average (MA) as an adaptive stop-loss and use price targets to scale out. These are just 2 examples of the possible options, both capable with this tool.
🔹 Signals
Signals will fire based on the break of the opening range, this is indicated by arrows above and below the range boundaries.
Optionally, a bias can be added to these signals to aid in mitigating false signals by using a directional filter based on the current day's OR relative to the previous day's OR.
Regardless of the signal bias being enabled, the Opening Range Zone will always be colored directionally according to this.
If the current day's OR is above the previous day's OR, the Zone will be Green.
If the current day's OR is below the previous day's OR, the Zone will be Red.
By enabling the signal bias, signals in the opposite direction of the daily bias will fire on the cross of the first target in that direction.
🔹 Targets
In this indicator, targets are not limited and will generate infinitely based on a % width of the Opening Range.
Additionally, there are 2 display methods for these targets.
Extended: Extends the targets to the current bar and displays all targets that have been crossed so far within the session.
Adaptive: Extends only the 2 closest targets surrounding price, allowing for a display consisting of fewer lines at one time.
🔶 DETAILS
🔹 Historical Display
This indicator can be utilized in multiple ways, for use in real-time, and for historical analysis to form methods. Because of this, the indicator has an option to display only the current day's data or the entire historical data. This can also help clean up the chart when it is in use.
🔹 Time Period
The specific time period to create the opening range is entirely up to each user's preference, by default it is set to 30 mins; however, this time period can be edited with full control if desired.
Simply toggle on the "Custom Range" and input a range of time to create the range.
🔹 Session Moving Average
The Session Moving Average is a common Moving Average, which resets at the beginning of a new session. This allows for an unbiased MA that was created entirely from the current session's price action.
Note: The start of the session is determined by the start of the Opening Range if using a custom range of time.
🔶 SETTINGS
Show Historical Data: Choose to display only the current session's data or the full history of data.
Opening Range Time Period: Select the time period to form the opening range from. This operates on Session Start, so it will change with the chart.
Custom Range: Opt for a custom Range by enabling this and inputting your range times as well as your needed timezone.
Breakout Signal Bias: Select if the Breakout Signals will use a Daily Directional Bias for firing.
Target % of Range: Sets the % of the Range width that will be used as an increment for the Targets to display in.
Target Cross Source: Choose to use the Close price or High/Low price as the crossing level for Target displays. When this source crosses a target it will generate more targets.
Target Display: Choose which style of display to use for targets.
Session Moving Average: Optionally enable a Moving average of your choice that resets at the beginning of each session (start of opening range).

First Candle High Low LevelsDescription
The "First Candle High Low Levels" Pine Script indicator is designed to highlight the high and low levels of the first candle of the day on your TradingView chart. It works across different timeframes and specifically handles the Indian stock market trading hours (9:15 AM to 3:30 PM IST). The script draws a box from the start to the end of the trading session, visually marking the price range defined by the first candle of the day. Traders can customize the box's border color, fill color, and line width.
Features
Customizable Timeframe: Users can select the desired timeframe for the first candle (e.g., 5-minute, 15-minute, etc.).
Custom Box Appearance: Options to adjust the border color, fill color, and line width of the drawn box.
Auto Reset for Each New Day: The high and low of the first candle are reset daily to mark the start of the next trading day.
Accurate Market Session Handling: The box is drawn from the start of the first candle to the end of the trading session (3:30 PM IST).
Usage
Adding to Chart: Apply the script by copying it into the Pine Script editor in TradingView. Once added, the script will automatically draw a box representing the high and low of the first candle of the day.
Select Timeframe: You can adjust the First Candle Timeframe input to define which timeframe candle will be used for marking the high and low. For example, if you choose a 5-minute timeframe, the high and low of the first 5-minute candle will be used.
Customization:
Adjust the Border Color and Box Fill Color through the input settings to match your chart's style.
Modify the Box Line Width to make the box lines more or less prominent.

Swing Points [CrossTrade]The "Swing Points" indicator is designed to help identify key swing points, trends, and potential support and resistance areas on a trading chart. This indicator overlays on the price chart and offers several features for enhanced market analysis.
Swing Point Identification: The indicator identifies swing highs and lows (pivot points) over a user-defined period. These points are crucial in understanding market reversals and momentum.
Swing Points Display: Users have the option to visually display these pivot points on the chart. Swing highs are marked with a red "H" above the bar, and swing lows with a green "L" below the bar, aiding in quick visual identification.
Center Line Calculation and Display: A dynamic center line is calculated using the pivot points, providing a baseline that adapts to market movements. The center line's appearance changes based on its position relative to the current price, making it a useful trend indicator.
Support and Resistance Levels: The indicator plots horizontal support and resistance lines based on the swing lows and highs, respectively. This feature helps traders identify potential areas of price consolidation or breakout.
Customization Options: Users can customize the period for swing point calculation and choose whether to display the pivot points, center line, and support/resistance levels.
Alert Features
Swing High Break Alert: An alert is triggered when a new swing high is detected, signaling a potential upward momentum shift.
Swing Low Break Alert: This alert activates when a new swing low is formed, possibly indicating a downward momentum shift.
Center Line Trend Color Change Alert: Alerts users when the center line changes its trend color, which could signify a change in overall market trend direction.

[1] Dynamic Support and Resistance with breakout [Dr Future]This script appears to be designed to identify and visualize dynamic support and resistance levels on a price chart, along with potential breakout signals.
Key Components & Functionality (Inferred):
Dynamic Support and Resistance: The script likely employs algorithms to calculate and plot support and resistance levels that adjust in real-time as price action evolves.
Breakout Detection: The script probably incorporates logic to recognize when the price breaks out of these dynamic support or resistance zones. This could trigger alerts or visual cues on the chart.
Dr Future's Approach: It's worth noting the " " tag, suggesting the script might be based on specific methodologies or insights associated with a trader or analyst known as "Dr Future." Without more context on their strategies, it's difficult to pinpoint the exact techniques used.
Potential Benefits:
Adaptive Levels: Dynamic support and resistance can offer a more responsive approach compared to static levels, as they account for changing market conditions.
Breakout Opportunities: Identifying breakouts can help traders spot potential entry or exit points.
Visual Clarity: Plotting these levels directly on the chart can provide a clearer picture of the current market structure and potential turning points.
Caveats:
False Signals: Like any technical tool, dynamic support and resistance can generate false signals. Breakouts might not always lead to sustained trends.
Parameter Sensitivity: The script's effectiveness likely depends on how its parameters are configured. Fine-tuning might be required to suit different markets or timeframes.
"Dr Future" Factor: The script's performance could be tied to the specific strategies of "Dr Future," which might not be universally applicable.
Important Note:
Without access to the actual code and a deeper understanding of "Dr Future's" methods, this description is based on inference and general knowledge of technical analysis.
Recommendation:
If you're considering using this script, it would be prudent to:
Backtest Thoroughly: Test the script on historical data to assess its performance and identify potential pitfalls.
Understand the Parameters: Familiarize yourself with the script's settings and how they impact the plotted levels and breakout signals.
Combine with Other Tools: Use this script in conjunction with other technical indicators and risk management strategies for a more holistic trading approach.

False Breakouts [TradingFinder] Fake Breakouts Failure🔵 Introduction
Technical indicators are essential tools for analysts and traders in financial markets, helping them predict price movements and make better trading decisions. One of the key concepts in technical analysis that should be carefully considered is the "False Breakout."
This phenomenon occurs when a price temporarily breaks through a significant support or resistance level but fails to hold and quickly returns to its previous range. Understanding this concept and applying it in trading can reduce risks and increase profitability.
🟣 What is a False Breakout?
A Fake Breakout, as the name suggests, refers to a breakout that appears to occur but fails to sustain, leading the price to quickly revert back to its previous range. This situation often happens when inexperienced or non-professional traders, under psychological pressure and eager to enter the market quickly, initiate trades.
This creates opportunities for professional traders to take advantage of these short-term fluctuations and execute successful trades.
🟣 The Importance of Recognizing False Breakouts
Recognizing False Breakouts is crucial for any trader aiming for success in financial markets. False Breakouts typically occur when the market approaches a critical support or resistance level.
In these situations, many traders are waiting to see if the price will break through this level. However, when the price quickly returns to its previous range, it indicates weakness in the movement and the inability to sustain the breakout.
🟣 How to identify False Breakouts?
To identify Fake Breakouts, it is important to carefully analyze price charts and look for signs of a quick price reversal after breaking a key level.
Here are some chart patterns that may help you identify a False Breakout :
1. Pin Bar Pattern : The Pin Bar is a candlestick pattern that indicates a price reversal. This pattern usually appears near support and resistance levels, showing that the price attempted to break through a key level but failed and reversed.
2. Fakey Pattern : This pattern, which consists of several candlesticks, indicates a False Breakout and a quick price return to the previous range. It usually appears near key levels and can signal a trend reversal.
3. Using Multiple Timeframes : One way to identify False Breakouts is by using charts of different timeframes. Sometimes, a breakout on a one-hour chart may be a False Breakout on a daily chart. Analyzing charts across multiple timeframes can help you accurately identify this phenomenon.
🔵 How to Use
Once you identify a False Breakout, you can use it as a trading signal. For this, it is best to look for trading opportunities in the opposite direction of the False Breakout. In other words, if a False Breakout occurs at a resistance level, you might consider selling opportunities, and if it happens at a support level, you might look for buying opportunities.
Here are some key points for trading based on False Breakouts :
1. Patience and Discipline : Patience and discipline are crucial when trading with False Breakouts. Wait for the False Breakout to clearly form before entering a trade.
2. Use Stop Loss : Setting an appropriate stop loss is vital when trading based on False Breakouts. Typically, the stop loss can be placed near the level where the False Breakout occurred.
3. Seek Confirmations : Before entering a trade, look for additional confirmations. These can include other analyses or technical indicators that show the price is likely to return to its previous level.
🔵 Settings
🟣 Logical settings
Swing period : You can set the swing detection period.
Max Swing Back Method : It is in two modes "All" and "Custom". If it is in "All" mode, it will check all swings, and if it is in "Custom" mode, it will check the swings to the extent you determine.
Max Swing Bac k: You can set the number of swings that will go back for checking.
🟣 Display settings
Displaying or not displaying swings and setting the color of labels and lines.
🟣 Alert Settings
Alert False Breakout : Enables alerts for Breakout.
Message Frequency : Determines the frequency of alerts. Options include 'All' (every function call), 'Once Per Bar' (first call within the bar), and 'Once Per Bar Close' (final script execution of the real-time bar). Default is 'Once per Bar'.
Show Alert Time by Time Zone : Configures the time zone for alert messages. Default is 'UTC'.
🔵Conclusion
False Breakouts, as a key concept in technical analysis, are powerful tools for identifying sudden price changes and using them in trading. Understanding this phenomenon and applying it can help traders perform better in financial markets and avoid potential losses.
To benefit from False Breakouts, traders need to carefully analyze charts and use the appropriate analytical tools. By leveraging this strategy, traders can achieve lower-risk and higher-reward trades.

Historical Swing High-Low Gann IndicatorThe Historical Swing High-Low Gann Indicator is a powerful tool designed to track and visualize key market swing points over time. This indicator identifies significant swing highs and lows within a specified time frame and draws connecting lines between these points, allowing traders to observe the natural ebb and flow of the market.
What sets this indicator apart is its ability to maintain all previously drawn swing lines, creating a comprehensive historical view of market movements. Additionally, the indicator projects Gann-style lines from the most recent swing highs and lows, providing traders with potential future support and resistance levels based on the geometric progression of price action.
Features:
Swing Detection: Automatically detects significant swing highs and lows over a user-defined period (default is 3 hours).
Persistent Historical Lines: Keeps all previously drawn lines, offering a complete visual history of the market's swing points.
Gann-Style Projections: Draws forward-looking lines from the latest swing points to help predict possible future market levels.
Customizable Parameters: Allows users to adjust the swing detection period to suit different trading styles and time frames.
This indicator is ideal for traders who rely on price action, support and resistance levels, and Gann theory for their analysis. Whether used in isolation or as part of a broader strategy, the Historical Swing High-Low Gann Indicator provides valuable insights into the market's behavior over time.

Pivot Channel Breaks [BigBeluga]Pivot Channel Break
The Pivot Channel Break indicator identifies key pivot points and creates a dynamic channel based on these pivots. It detects breakouts from this channel, providing potential entry and exit signals for traders.
🔵 How to Use
Channel Identification:
- Upper and lower channel lines drawn based on pivot highs and lows
- Channel width dynamically adjusted using ATR-like calculation
Breakout Signals:
- Upward breakout: Price closes above upper channel line
- Downward breakout: Price closes below lower channel line
- Signals shown as X marks on the chart
Pivot Points:
- High pivots marked with "H" triangles
- Low pivots marked with "L" triangles
Support & Resistance:
- Optional signals when price touches but doesn't break channel lines
Trend Visualization:
- Optional bar coloring based on the most recent breakout direction
🔵 Customization
• Pivot Right: Lookback period for pivot detection (default: 10)
• Pivot Left: Forward period for pivot confirmation (default: 40)
• Channel Width: Multiplier for channel width calculation (default: 1.0)
• Support & Resistance Signals: Toggle additional touch signals
• Bar Color: Enable/disable trend-based bar coloring
Calculation:
Detect pivot highs and lows using specified lookback periods
Calculate channel basis using 10-period SMA of close prices
Determine channel width using ATR-like calculation: RMA(high - low, 10) * width multiplier
Set channel lines based on pivot points and calculated deviations
Identify breakouts when price crosses beyond channel lines
The Pivot Channel Break indicator offers a dynamic approach to identifying potential trend changes and breakout opportunities. It combines pivot point analysis with a flexible channel calculation, providing traders with a visual tool for market structure analysis. Use this indicator in conjunction with other technical analysis methods to confirm signals and manage risk effectively.

Consolidation Range Detector [Pt]█ Author's Note:
After extensively reviewing the existing consolidation detection tools in the TradingView library, I found that none fully met my expectations. Some tools were overly sensitive, producing too many invalid ranges, while others lacked the necessary sensitivity. Consequently, I decided to develop my own tool. I hope that you, fellow traders, find it valuable and enjoy using it.
█ Description:
The Consolidation Range Detector is a sophisticated TradingView tool designed to identify and visualize periods of price consolidation on any financial chart. This indicator employs advanced algorithms to detect ranges where price movements are confined, helping traders spot potential breakout zones and make informed trading decisions.
█ Key Features:
► Customizable Detection Sensitivity: Adjust the sensitivity of the detection algorithm to suit your trading strategy, ensuring a precise fit within the consolidation range.
► Dynamic Coloring: Choose between random or fixed colors for the consolidation ranges, with options to match different background color schemes (Dark, Light, Neutral).
► Visual Clarity: Highlight detected consolidation ranges directly on the chart with customizable color schemes to enhance visibility and provide clear visual cues.
► ATR-Based Validation: Ensures detected consolidation ranges are significant and reliable by using the Average True Range (ATR) for validation.
█ User-Defined Inputs:
► Minimum Detection Bars: Set the minimum number of bars required to detect a consolidation range.
► Max Range Multiplier: Define the maximum range for detection as a multiple of the ATR.
► Detection Sensitivity: Adjust the sensitivity of the detection algorithm. Higher values mean a tighter fit within the consolidation range.
► Color Options: Choose the color for the consolidation range boxes and decide whether to use random colors.
► Color Scheme (Background): Select a color scheme for the chart background (Dark, Light, Neutral).
█ How It Works:
► Range Detection: The indicator scans the chart for potential consolidation ranges based on user-defined parameters. It calculates the average price and ATR to determine the significance of the range.
► Validation: Each detected range is validated based on criteria such as ATR threshold, range validity, average price comparison, and the number of touches at the range boundaries.
► Visualization: Validated ranges are highlighted on the chart with colored boxes, providing a clear visual cue of potential consolidation zones.
█ Usage Examples:
► Example 1:
The image below showcases the Consolidation Range Detector in action on a chart of S&P 500 E-mini Futures. The indicator highlights several consolidation ranges with different colors, demonstrating its ability to adapt to varying market conditions and visually emphasize key areas of price consolidation. The annotations for breakouts and price reactions are manually marked to illustrate the practical application of the tool in identifying potential trading opportunities based on these key areas.
█ Practical Applications:
► Identify Breakout Zones: Use the detected consolidation ranges to identify potential breakout zones, helping to anticipate significant price movements.
► Identify Key Price Levels: The tool helps in pinpointing key price levels where there is a high probability of significant price reactions, providing crucial insights for trading strategies.
► Enhance Technical Analysis: Integrate the Consolidation Range Detector into your existing technical analysis toolkit to improve the accuracy of your trading decisions.
█ Conclusion:
The Consolidation Range Detector is a powerful tool for traders looking to identify periods of price consolidation and potential breakout zones. With its customizable settings and advanced detection algorithms, it provides a reliable and visual method to enhance your trading strategy. Whether you're a beginner or an experienced trader, this indicator can add significant value to your technical analysis.
█ Cautionary Note:
While the Consolidation Range Detector is a powerful tool, it's important to combine it with other indicators and analysis methods for comprehensive trading decisions. Always consider market context and external factors when interpreting detected consolidation ranges.

DTFX Algo Zones [LuxAlgo]DTFX Algo Zones are auto-generated Fibonacci Retracements based on market structure shifts.
These retracement levels are intended to be used as support and resistance levels to look for price to bounce off of to confirm direction.
🔶 USAGE
Due to the retracement levels only being generated from identified market structure shifts, the retracements are confined to only draw from areas considered more important due to the technical Break of Structure (BOS) or Change of Character (CHoCH).
The simple action that causes a market structure shift occurs is price breaking above or below a specific swing point. When a market structure shift happens, a retracement is drawn from the point of break to the highest or lowest point since that point. Due to the price action necessary for a market structure shift, these retracements will not always be immediately actionable.
These retracement levels are intended to be used as points to watch for price to retrace to and bounce from, confirming the current direction of price.
In the example below, after the retracement is initiated, by bouncing off of the retracement levels formed from the previous market structure shift it would further confirm the bias of the market structure shift. A break going through these levels would display a weakness from the current market structure shift, implying that it could simply be noise.
🔶 DETAILS
The script uses standard SMC Market structure identification to determine Break of Structures (BOS) and Change of Characters (CHoCH). The specific swing points can be identified by the shapes placed above or below the specific swing high/low candle.
By unchecking the "Display All Zones" setting, users are able to specify the exact number of retracement zones to display using the "Show Last" parameter. This is handy for cleaning up the chart to stay focused on the most recent retracements.
Additionally, when displaying multiple zones, the "Clean-Up Level Overlap" setting may be helpful for decluttering as well. This option optimizes the display of retracement levels to minimize their overlap on other adjacent zones.
The script allows for up to 5 Fib levels to be displayed from each zone, with options for display, value, line style, and color for each of the 5.
The calculation for Fib Levels changes depending on the direction of market structure shifts. When an upwards (Bullish) zone is generated, the retracement is drawn with the bottom of the zone being 0 and the top of the zone being 1. This is reversed for downwards (Bearish) zones.
🔶 SETTINGS
Structure Length: Sets the SMC structure length to use for finding MMS.
Show Last: Displays this number of retracement zones. (Display All Zones Must be Unchecked)
Display All Zones: Ignores "Show Last" number and displays all historical MMS Retracement Zones.
Zone Display: Choose which zones to display, only bearish, only bullish, or both.
Clean-Up Level Overlap: Minimizes overlap between adjacent zones and levels.
Fib Levels: Settings to display and customize up to 5 Fib levels for each zone.

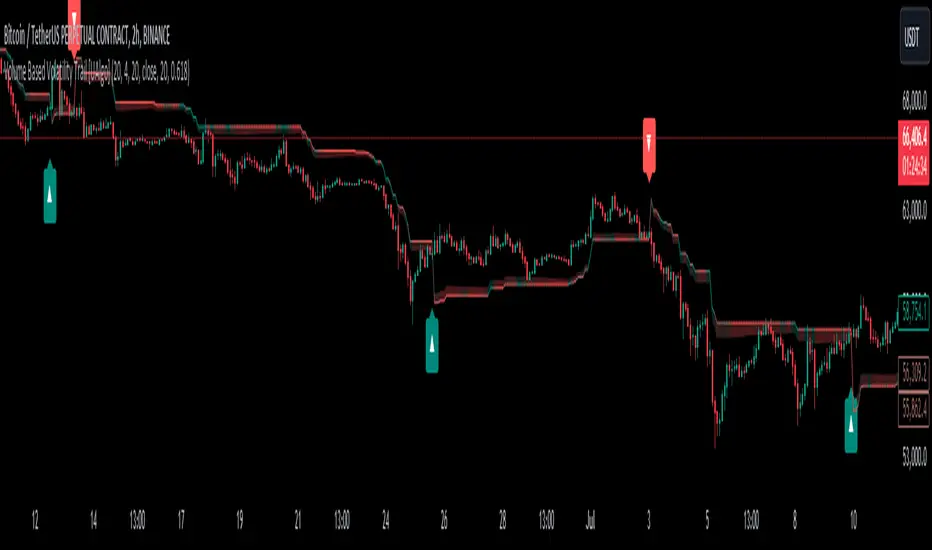
Volume Based Volatility Trail [UAlgo]"Volume Based Volatility Trail ", is designed to identify potential trading opportunities based on volatility and volume analysis. It calculates the Average True Range (ATR) to gauge market volatility and uses a volume-based multiplier to dynamically adjust a trailing stop level. The indicator also incorporates volume analysis to identify high volume periods that might signal potential breakouts.
🔶 Key Features
Volume-Based Volatility Trail: The indicator calculates a trailing stop level based on the ATR, which is then adjusted based on volume. Higher volume periods can lead to a wider trailing stop to account for increased volatility.
Price Source: Users can select the price source (e.g., close, open) for volume calculations.
Customizable Inputs: Users can adjust various parameters like the ATR period, multiplier, smoothing period, volume SMA period, ATR adjustment factor, and colors for buy/sell signals and the trailing stop area.
Buy/Sell Alerts: The indicator generates alerts for potential buy and sell opportunities based on the trailing stop crossing the price.
🔶 Usage
Look for buy signals (▲ marker) when the price crosses above the trailing stop level, potentially indicating a bullish trend.
Conversely, sell signals (▼ marker) appear when the price falls below the trailing stop, suggesting a bearish trend.
The shaded area around the trailing stop represents a buffer zone that might offer some protection against price fluctuations, but it can also indicate areas of potential pullbacks. During volatile periods or after strong price movements, the price might retrace back towards the trailing stop before continuing its trend. This shaded area can help visualize these potential retracement zones.
High volume periods (highlighted by the indicator) can be used in conjunction with other technical analysis to confirm potential breakouts. Analyze these high volume periods alongside price action and other indicators to assess the strength of the breakout and the likelihood of the price continuing its upward move.
🔶 Disclaimer:
Use with Caution: This indicator is provided for educational and informational purposes only and should not be considered as financial advice. Users should exercise caution and perform their own analysis before making trading decisions based on the indicator's signals.
Not Financial Advice: The information provided by this indicator does not constitute financial advice, and the creator (UAlgo) shall not be held responsible for any trading losses incurred as a result of using this indicator.
Backtesting Recommended: Traders are encouraged to backtest the indicator thoroughly on historical data before using it in live trading to assess its performance and suitability for their trading strategies.
Risk Management: Trading involves inherent risks, and users should implement proper risk management strategies, including but not limited to stop-loss orders and position sizing, to mitigate potential losses.
No Guarantees: The accuracy and reliability of the indicator's signals cannot be guaranteed, as they are based on historical price data and past performance may not be indicative of future results.
Market Structure Targets Model [LuxAlgo]The Market Structure Targets Model indicator provides an algorithmic approach to setting targets from market structure shifts (MSS) and market structure breaks (MSB), two popular Smart Money Concept (SMC) concepts. Depending on the target % settings, they can be used as take profit, confirmation levels, or potential reversal points.
🔶 USAGE
Our Market Structure Targets Model scripts provide automated and customizable targets from MSS and MSB. Each displayed target can be used in several ways described in the sub-sections below:
🔹 Take Profit
The targets can be used as take profit levels, where the target distance can be set separately for bullish/bearish MSS/MSB respectively.
🔹 Confirmation Levels
Alternatively, targets can be used as an additional confirmation level of a trend reversal when set at a lower percentage, filtering out fake signals that might be given from market structures. In this way, targets can be used as potential entry levels.
🔹 Potential Reversal Points
In some circumstances, targets being reached can be indicative of trend reversals. The percentage of the targets would be typically set higher to allow for trend exhaustion.
The above examples highlight this usage for bearish reversal scenarios, while the image below highlights it for bullish reversal scenarios.
🔹 Support/Resistance Levels
The targets, being horizontal levels, can also serve as potential support/resistances, with breakouts potentially confirming new trends. It is important to remain observant of the market structure. An MSS or MSB in the opposite direction provides essential information to be included in future decisions.
Using multiple timeframes can help detect longer-term trends. Depending on the user's preference, they can choose the appropriate timeframe for their needs.
Note that Target lines will only be drawn when the Target Level exceeds the close value when it is drawn.
🔹 Maximum Target Duration
The Maximum Target Duration setting removes unreached target levels when the amount of bars since the associated market structure of that target exceeds the user set limit. This effectively allows the removal of any target that might no longer be relevant to newer trends.
🔹 Type: Switch/Hold
This setting is another way to control unreached target levels.
Switch: When a new MSS/MSB is found, the previous target level associated with a market structure with the same direction (bullish/bearish) is deleted if it hasn't been reached.
Hold: Target levels are retained and continuously evaluated when a new MSS/MSB is formed.
The target level will be removed in both cases when the Maximum Target Duration condition is applied.
The above example shows the case when the Type setting is set to Switch , while in the example below, it is set to Hold .
🔶 DETAILS
🔹 Market Structure
Market structures are commonly classified as follows:
Market Structure Shift (MSS), also referred to as Change of Character (CHoCH)
Market Structure Break (MSB), also referred to as Break of Structure (BOS)
MSS indicates a shift in the market trend, confirming trend reversals. Conversely, MSB occurs once a trend is already determined, confirming new higher highs/lower lows.
🔹 Targets
A: Highest/lowest between the extremities of the MSS/MSB line
B: Price value of the MSS/MSB line
The distance between A and B is projected on the opposite side of the MSS/MSB line, adjusted with a percentage that can be set by the user. The above example used 100% of the distance between A and B.
The Target Percentage of MSS and MSB can be set separately for bullish or bearish market structures.
🔶 SETTINGS
Swings: Period used for the swing detection, with higher values returning longer-term Swing Levels.
Type: the Switch/Hold setting controls unattained target levels
Maximum Target Duration: removes the target lines when the amount of bars since the drawing of the target exceeds the limit and the target has not been reached
🔹 Market Structure Shift (MSS)
Bullish: Toggle, color setting, % Target
Bearish: Toggle, color setting, % Target
🔹 Market Structure Break (MSB)
Bullish: Toggle, color setting, % Target
Bearish: Toggle, color setting, % Target

Volume Surge Analysis [UAlgo]The "Volume Surge Analysis " indicator is designed to detect significant volume surges in the market. By analyzing volume relative to its moving average and incorporating a comparison of the true range of price movements, this script highlights potential bullish and bearish volume spikes. Traders can utilize these signals to identify moments of heightened market activity that may indicate strong buying or selling pressure.
🔶Features
Volume Multiplier: Customizable setting to define the threshold for what constitutes a volume surge.
Volume SMA Length: Adjustable length for the Simple Moving Average (SMA) of volume.
Price Movement Analysis
Enhances the volume analysis by adding an additional layer of context, helping to confirm whether a volume surge is associated with buying or selling pressure.
True Range Calculation: Measures the range of price movement to understand volatility.
Positive Movement (DM+): Calculated when the current high minus the previous high is greater than the previous low minus the current low. This helps identify strong upward movements.
Negative Movement (DM-): Calculated when the previous low minus the current low is greater than the current high minus the previous high. This helps identify strong downward movements.
Integration with Volume Analysis: By combining the volume analysis with price movement analysis, the script can more accurately determine whether a volume surge is likely driven by bullish or bearish sentiment. This integration helps filter out false signals and provides more reliable indications of market activity.
Median Volume Comparison: Compares the current volume against the median volume multiplied by the volume multiplier to identify significant volume spikes.
Bullish and Bearish Surge Signals: Plots circles above or below bars where significant volume surges occur, indicating potential bullish or bearish movements.
Color Customization: Options to set specific colors for bullish and bearish signals to enhance visual clarity.
Bar Coloring: Optional feature to change the color of bars based on detected volume surges.
Alerts: Configurable alerts for bullish and bearish volume spikes to notify traders in real-time.
🔶Interpretation:
Bullish Volume Surges ( Teal Circles ): These circles appear above the bar when the current volume exceeds the median volume by the specified Volume Multiplier, and the smoothed Positive Directional Index (PDI) is greater than the smoothed Negative Directional Index (NDI). This suggests a potential uptrend with strong buying pressure.
Bearish Volume Surges ( Red Circles ): These circles appear below the bar when the current volume exceeds the median volume by the specified Volume Multiplier, and the smoothed NDI is greater than the smoothed PDI. This suggests a potential downtrend with strong selling pressure.
Overall, the "Volume Surge Analysis " indicator serves as a valuable tool for traders seeking to identify potential trend reversals or strong continuations based on with an above-average rise in volume and directional momentum.
🔶Disclaimer
This indicator is intended for informational and educational purposes only and should not be construed as financial or investment advice. Trading involves substantial risk, and it is essential to conduct your own research and consult with a qualified financial advisor before making any trading decisions.

[Support and Resistance with Trend Lines] with Backtest (TSO) with Backtest (TSO)
===========================================================================
===========================================================================
This indicator serves as a comprehensive full-cycle trading system, providing alerts at each stage of the trade, from opening to closure. The algorithm uses most recent and historical S&R (Support and Resistance) levels with most recent and historical Trend Lines, generating signals for trades when Breaks/Bounces occur (Trade Open Signal triggers can be configured via very customizable indicator Input "Signal Trigger Matrix" settings). With signal for trade open, TP (Take Profit and SL (Stop Loss) levels are calculated as well and marked on the chart including alerts for each action of the trade. The indicator offers a variety of automated approaches for TP (Take-Profit) and SL (Stop-Loss) settings. These include static current/historical S&R (Support and Resistance) levels or S&R/Trend Lines dynamic breaks for TP (Take-Profit) and various SL (Stop-Loss) approaches, including ATR Trailing SL, opposite S&R (Support and Resistance) levels SL, opposite Trend Lines SL and more. This diverse set of tools ensure flexibility in tailoring TP (Take-Profit) and SL (Stop-Loss) parameters to different market conditions, contributing to a more adaptive and robust trading system. Additionally, a series of signal analysis tools, including market sentiment, candle bar analysis, divergence, and volume, enhance the precision of trading signals.
* Works with popular timeframes: 1M, 3M, 5M, 15M, 30M, 45M, 1H.
* Works well with Futures and Indices, can be used to trade Stocks, Crypto and FOREX.
* Includes LIVE alert/labels Breakouts and Bounces signal trigger feature, which can be used for scalping (NOTE: This approach cannot be backtested).
* Every action of the trade is calculated on a confirmed closed candle bar state (barstate.isconfirmed), so the indicator will never repaint.
==============================================================
Indicator examples:
---------------------------------------------------------------------------
Strategy Config: SRTL_MES_15M3Y_EODoff_ALL
Here is a nice example of MES (Micro E-Mini S&P 500 Index Futures) configuration, which uses S&R (Support and Resistance) breakouts as signal trigger with Elliot Wave confirmation and previous S&R historical levels for TP (Take-Profit).
---------------------------------------------------------------------------
An example of an intraday Tesla trade. Also the green arrows will be displayed IMMEDIATELY when Breakout/Reverse Bounce occurs (same an Alert will be triggered immediately).
===========================================================================
Trading open/close/TP/SL labels, plots and colors explanations:
---------------------------------------------------------------------------
>>> S&R (Support and Resistance) levels/lines: orange - support, blue - resistance (can be hidden).
>>> Trend Lines: yellow - support, green - resistance (can be hidden).
>>> Blue labels show resistance breakouts and bounces, light-blue - bullish, dark-blue - bearish
>>> Yellow labels show resistance breakouts and bounces, light-yellow - bullish, dark-yellow - bearish
>>> Green/Red arrows on top/bottom of candle bar will show LIVE breakouts (if turned on)
>>>>> LONG open: green "house" looking arrow below candle bar.
>>>>> SHORT open: red "house" looking arrow above candle bar.
>>>>> LONG/SHORT take-profit target: green/red circles (multi-profit > TP2/3/4/5 smaller circles).
>>>>> LONG/SHORT stop-loss target: green/red + crosses.
>>>>> LONG/SHORT take-profit hits: green/red diamonds.
>>>>> LONG/SHORT stop-loss hits: green/red X-crosses.
>>>>> LONG/SHORT EOD (End of Day | Intraday style) close (profitable trade): green/red squares.
>>>>> LONG/SHORT EOD (End of Day | Intraday style) close (loss trade): green/red PLUS(+)-crosses.
===========================================================================
STATS TABLE ///////////////////////////////////////////////////////////////
---------------------------------------------------------------------------
>>> Trading STATS table on the chart showing current trade direction, Last TP (Take-Profit) Taken, Current Trade PL (profit/loss in price difference from trade open to the very current state).
---------------------------------------------------------------------------
CUSTOM TRADING DATE RANGE /////////////////////////////////////////////////
---------------------------------------------------------------------------
>>>>> This feature can be used to manually set indicator trading range from and to a specific date and time. NOTE: This is not intended for a very long date range backtesting, utilize TradingView Strategy Tester for that.
* Use TradingView “Strategy Tester” to see Backtesting results
NOTE: If Strategy Tester does not show any results with Date Ranged fully unchecked, there may be an issue where a script opens a trade, but there is not enough TradingView power to set the Take-Profit and Stop-Loss and somehow an open trade gets stuck and never closes, so there are “no trades present”. In such case - manually check “Start”/“End” dates or use “Deep Backtesting” feature!
---------------------------------------------------------------------------
INTRADAY ACTIVE TRADING SESSION CONFIGURATION /////////////////////////////
---------------------------------------------------------------------------
>>> Regional Active Trading Session Hours Schedule: If selected - trades will only open during regional active trading session, if 'OFF', there will be no trading schedule and trades will open 24/7.
>>> EOD(End of Day) Close - On/Off: Close the trade if it's still open at the end of active trading session (on the very last candle bar). NOTE: If no region is selected at 'Regional Active Trading Session Schedule' - there will be no EOD(End of Day) Close and trades will run overnight until either SL(Stop-Loss) or TP(Take-Profit) is hit!
>>>>> EOD(End of Day) Close - 1 candle bar before last: This is specifically for stocks as while usually indices can be closed 15minutes after the market closes, for stocks - the last candle bar closes at the same time with the market active trading session, which if closed - trades can't be closed until next day/session! Enable this setting for the trade to close/alert 1 candle bar before the last one, so there is still time to close the trade at the Broker (NOTE: depending on the timeframe, 1 candle bar can be: 15sec, 30sec, 1min, 3min, 5min, 15min, 30min, 45min, 1h).
---------------------------------------------------------------------------
SIGNAL TRIGGER MATRIX ////////////////////////////////////////////////
---------------------------------------------------------------------------
>>> Trading Engine: This setting turns on TradingView Strategy trading engine for backtesting.
>>> Market Session Only: With this setting turned on, all signal trigger Breaks/Bounces will be hidden during Pre/Post market time.
>>> Plot S&R Levels/Lines: Plot S&R (Support and Resistance) on chart. Note: historical levels/lines will only be plotted if hit (Break/Bounce).
>>> Plot Trend Lines Levels/Lines: Plot Trend Lines levels/lines on chart. Note: historical levels/lines will only be plotted if hit (Break/Bounce).
>>> Use S&R Current Levels | Use S&R Historical Levels | Use Trend Lines Current Levels | Use Trend Lines Historical Levels |: Choose which levels should be used for Breaks/Bounces to be captured on. If all triggers are turned on/checked - whatever happens 1st wins the trigger.
>>> Breaks | Bounces: 'Breaks': Turn on Breaks through levels/lines signal trigger. | 'Bounces': Turn on Bounces off levels/lines signal trigger.
>>> Signal: Regular | Signal: S&R Combo | Signal: TL Combo | Signal: S&R + TL Combo | Signal: Repeat Action |: Trade open signal trigger execution approach MATRIX (If 1 or more turned on at the same time - whatever comes first will be the trade signal trigger). 'Regular': A single Break/Bounce must occur on a closed bar for signal trigger. 'S&R Combo': A combination of 2 Current + Historical S&R (Support and Resistance) Break/Bounce must happen in the same direction on same bar for signal trigger. 'TL Combo': A combination of 2 Current + Historical Trend Lines Break/Bounce must happen in the same direction on same bar for signal trigger. 'S&R + TL Combo': a combination of ANY S&R and Trend Line Break/Bounce must happen in the same direction on same bar for signal trigger. 'Repeat Action': Initial and then confirmation (2nd/3rd/etc. consecutive occurence) Break/Bounce must occur on same level/line for signal trigger.
>>> Historical - Look Back (# of days): How far back (in # of days) will historical S&R/Trend Lines will be used for Trade Open signals/TP/SL/etc.
>>> Historical - Look Back Invalidation (# of days): IF THERE IS TOO MUCH HISTORICAL LEVELS/LINES ON CHART - LOWER THIS SETTING + MAKE SURE IT'S SMALLER THAN 'Historical - Look Back (# of days)'. With big Look back period (5+ days) - it can become very messy with too many historical levels/lines. To clear oldest historical levels/lines - set Look Back Invalidation # of days to less than Historical Look Back # of days. (After X # of Look Back Invalidation days - older levels/lines will become invalidated and no longer used for opening trades/TP (Take-Profit)/SL (Stop-Loss), while newer levels/lines will still be discovered.
>>> S&R/Trend Lines - Support/Resistance combined into 1 entity: Every level or a line becomes simply a level or a line, regardless if it originally was a support or resistance. By default, depending on the level/line originally being support or resistance - the signal direction will be such as: Resistance is broken > LONG / bounced > SHORT; Support is broken > SHORT / bounced > LONG; with this setting on, either level or line can be both broken or bounced off in ANY direction, trade open direction will depend on current market sentiment only.
---------------------------------------------------------------------------
S&R CONFIGURATION ////////////////////////////////////////////////
---------------------------------------------------------------------------
>>> S&R Search - Left Bars (current): This setting is for calculating optimal S&R (Support and Resistance) levels (in combination with below - Right Bars).
>>> S&R Search - Right Bars (current): This setting is for calculating optimal S&R (Support and Resistance) levels (in combination with above - Left Bars).
>>> S&R Search - Custom Resolution (current): This is a custom timeframe setting specifically for S&R Search, it disregards current chart timeframe. This is great to use for scalping, for example: with main chart set to 1min and the custom timeframe set to 3min or 5min - there will be stronger support/resistance levels with more detailed price action.
>>> S&R Search - Left Bars (historical): This setting is for calculating optimal S&R (Support and Resistance) levels (in combination with below - Right Bars).
>>> S&R Search - Right Bars (historical): This setting is for calculating optimal S&R (Support and Resistance) levels (in combination with above - Left Bars).
>>> S&R Search - Custom Resolution (historical): This is a custom timeframe setting specifically for S&R Search, it disregards current chart timeframe. This is great to use for scalping, for example: with main chart set to 1min and the custom timeframe set to 3min or 5min - there will be stronger support/resistance levels with more detailed price action.
>>> S&R - Historical S&R Levels - Extend to the right: Extend all S&R lines to the right.
>>> S&R (Current/Historical) - Live Breakout/Bounce - ALERT/SHOW: NOTE: Alert wlil trigger immediately at price Breaking thru or Bouncing off level/line and an arrow above /below the bar will show the direction of breakout/bounce. If on that same live bar - price comes back causing the Breakout/Bounce become no longer valid - the arrow will disappear as the condition of the Break/Bounce will no longer be valid.
---------------------------------------------------------------------------
TREND LINES CONFIGURATION ////////////////////////////////////////////////
---------------------------------------------------------------------------
>>> Show: Trend Line development (where it 'did not exist' yet): It takes 2 pivots to develop a trend line, pivot is established at least 3 candle bars later from where the pivot is. With this setting turned on - it will plot dashed lines where trend lines originated connecting the 1st and 2nd pivot point up to where the trend line became established (where in reality you would now be able to draw a certain trend line). Established already generated trend line are plotted with a solid line.
>>> Trend Lines - Line Slope Confirmation: LONG breakout will only be shown if trend line is goind downslope \. SHORT breakout will only be shown if trend line is goind upslope /.
>>> Trend Lines - Search - Left Bars (current): This setting is for calculating optimal Trend Lines.
>>> Trend Lines - Search - Right Bars (current): This setting is for calculating optimal Trend Lines.
>>> Trend Lines - Custom Resolution (current): This is a custom timeframe setting specifically for S&R Search, it disregards current chart timeframe. This is great to use for scalping, for example: with main chart set to 1min and the custom timeframe set to 3min or 5min - there will be stronger support/resistance levels with more detailed price action.
>>> Trend Lines - Search - Left Bars (historical): This setting is for calculating optimal Trend Lines.
>>> Trend Lines - Search - Right Bars (historical): This setting is for calculating optimal Trend Lines.
>>> Trend Lines - Custom Resolution (historical): This is a custom timeframe setting specifically for S&R Search, it disregards current chart timeframe. This is great to use for scalping, for example: with main chart set to 1min and the custom timeframe set to 3min or 5min - there will be stronger support/resistance levels with more detailed price action.
>>> Trend Lines - Historical Trend Lines - Extend to the right: Extend all Trend Lines to the right.
>>> Trend Lines (Current/Historical) - Live Breakout/Bounce - ALERT/SHOW: NOTE: Alert will trigger immediately at price Breaking thru or Bouncing off level/line and an arrow above /below the bar will show the direction of breakout/bounce. If on that same live bar - price comes back causing the Breakout/Bounce become no longer valid - the arrow will disappear as the condition of the Break/Bounce will no longer be valid.
---------------------------------------------------------------------------
TAKE-PROFIT/STOP-LOSS CONFIGURATION ///////////////////////////////////////
---------------------------------------------------------------------------
>>> TP (Take-Profit) System: 'S&R Static Current/Historical': TP (Take-Profit) is calculated using current/historical S&R (Support & Resistance) levels at trade open and remains static. 'S&R/Trend Lines Dynamic Breaks': TP (Take-Profit) is fully dynamic and will be trigger at price above trade open price and with Breakout occurence (S&R or Trend Line current/historical breakout).
>>> TP (Take-Profit) # of targets: It is wise to divide the trade into several profit targets. With this setting - up to 5 TP (Take-Profit) targets can be approached. The trade will be equally divided up by the selected # of TP (Take-Profit) targets.
>>> SL (Stop-Loss) System: 'ATR-Trailing-SL': SL (Stop-Loss) is trail-following the ATR (Average True Range) line, NOTE: If at signal trigger, ATR will be against the trade direction - trade open signal will be skipped; 'S&R-Static-SL': SL (Stop-Loss) is set at trade open per optimal most recent S&R level and remains there until trade closes; 'TrendLines-Static-SL': SL (Stop-Loss) is set at trade open per optimal most recent trend line and remains there until trade closes; 'TrendLines-Dynamic-SL': SL (Stop-Loss) will be set per current opposite trend line and follow it until trade is open.; 'Oppos-Sig-Trd-in-Loss': SL (Stop-Loss) will trigger at opposite signal with trade currently at loss.
>>> SL (Stop-Loss) - On/Off: Without SL (Stop-Loss), unless EOD (End of Day) Close is turned on - there will be no SL (Stop-Loss) at all!
---------------------------------------------------------------------------
MARKET SENTIMENT CONFIRMATION ///////////////////////////////////////
---------------------------------------------------------------------------
>>> Market Sentiment: Signal is confirmed per Market Sentiment direction. If Market Sentiment is turned off - whatever signal comes 1st will be the trade open trigger.
---------------------------------------------------------------------------
SIGNAL ANALYSIS AND CLEANUP ///////////////////////////////////////////////
---------------------------------------------------------------------------
>>> Signal Cleanup - Bar Color: Include Bar Color (bullish/bearish) confirmation, LONG signal will only be opened if signal bar is green/bullish, SHORT if red/bearish.
>>> Signal Cleanup - Bar Directional Structure: Skip opposite bar structure types signals (For example: bearish green hammer).
>>> Signal Cleanup - Bar Doji Skip: Skip doji (indecisive) candles signals.
>>> Signal Cleanup - EWO (Elliott Wave Oscillator): Include EWO (Elliott Wave Oscillator), LONG will only be opened if EWO is bullish / SHORT if EWO is bearish.
>>> Signal Cleanup - VWAP (Volume-Weighted Average Price): Include VWAP (Volume-Weighted Average Price), LONG will only be opened if price is above VWAP / SHORT if price is below VWAP.
>>> Signal Cleanup - MA (Moving Average) Confirmation: Include MA (Moving Average), LONG will only be opened if MA is bullish / SHORT if MA is bearish.
>>> Signal Cleanup - ATR (Average True Range): Include ATR (Average True Range) confirmation, LONG will only be opened if ATR is bullish / SHORT if ATR is bearish.
>>> Signal Cleanup - Divergence(RSI + MACD): Include Divergence (RSI + MACD ) confirmation, LONG will only be opened if Divergence is bullish / SHORT if Divergence is bearish.
>>> Signal Cleanup - Volume % Strength: Include Volume strength/percentage confirmation, LONG/SHORT will only be opened with strong Volume matching the signal direction | By default, strong Volume percentage is set to 150% and weak to 50%.
>>> Signal Cleanup - Volume Above Average: Include Volume Above Moving Average (Volume closing bar closes above volume moving average) confirmation, LONG/SHORT will only be opened with Volume above average - Volume closed bar color must match the closed price color (bullish/bearish direction) + Volume bar must be closed above volume MA line).
---------------------------------------------------------------------------
===========================================================================
||||||||||||||||||||||||||||||||||| *** ||||||||||||||||||||||||||||||||||| *** |||||||||||||||||||||||||||||||||||
||||||||||||||||||||||||||||||||||| *** ||||||||||||||||||||||||||||||||||| *** |||||||||||||||||||||||||||||||||||
TP System - VERY IMPORTANT INFO!
-------------------------------------------------------------------------------------------------------------------
"TP PERCENTAGE" - amount by which current trade/position needs to be reduced/partially closed/sold.
-------------------------------------------------------------------------------------------------------------------
TP System: Dynamic
"TP PERCENTAGE" - will always be the same amount (trade/position size divided by the # of take-profit(TP) targets) and percentage to be closed will always be of the ORIGINAL trade/position.
-------------------------------------------------------------------------------------------------------------------
TP System: Static
"TP PERCENTAGE" - will always be the same amount IF take-profit(TP) targets are hit 1-by-1 (TP1 > TP2 > TP3 > TP4 > TP5), otherwise it will vary and unless it is a 1st take-profit(TP1), the REMAINING trade/position size will always be smaller than original and therefore the percentage to be closed will always be of the REMAINING trade/position and NOT the original one!
-------------------------------------------------------------------------------------------------------------------
"TP PERCENTAGE" CheatSheet (these are the only percentages you may see)
-----------------------------------------------------------------------
TP PERCENTAGE---Close/Sell Amount-------------Example (trade size: 50 stocks)
20%-------------trade size * 0.2--------------50 * 0.2 = 10 stocks
25%-------------trade size * 0.25-------------50 * 0.25 = 12.5(~13) stocks
34%-------------trade size * 0.34-------------50 * 0.34 = 17 stocks
40%-------------trade size * 0.4--------------50 * 0.4 = 20 stocks
50%-------------trade size * 0.5--------------50 * 0.5 = 25 stocks
60%-------------trade size * 0.6--------------50 * 0.6 = 30 stocks
66%-------------trade size * 0.66-------------50 * 0.66 = 33 stocks
75%-------------trade size * 0.75-------------50 * 0.75 = 37.5(~38) stocks
80%-------------trade size * 0.8--------------50 * 0.8 = 40 stocks
100%------------trade size--------------------50 = 50 stocks
-----------------------------------------------------------------------
If for any reason a portion of the current/remaining trade closed at such occurrence was slightly wrong, it is not an issue. Such occurrences are rare and with slight difference in partial TP closed is not significant to overall performance of our algorithms.
||||||||||||||||||||||||||||||||||| *** ||||||||||||||||||||||||||||||||||| *** |||||||||||||||||||||||||||||||||||
||||||||||||||||||||||||||||||||||| *** ||||||||||||||||||||||||||||||||||| *** |||||||||||||||||||||||||||||||||||
===========================================================================
Alert Settings (you don’t have to touch this section unless you will be using TradingView alerts through a Webhook to use with trading bot)
---------------------------------------------------------------------------
Here is how a LONG OPEN alert looks like.
NOTE: Each label , , etc. is customizable, you can change the text of it within indicator Input settings.
ALERT >>>>>>>>>>>>>>>>>>>>>>>>>>>>>>>>>>>>>>>>>>>>>>>
COIN: BTCUSD
TIMEFRAME: 15M
LONG: OPEN
ENTRY: 20000
TP1: 20500
TP2: 21000
TP3: 21500
TP4: 22500
TP5: 23500
SL: 19000
Leverage: 0
---------------------------------------------------------------------------
Here is how a TP1 alert will look with 5 TPs breakdown of the trade.
NOTE1: Next to TP1 taken it will show at which price it was triggered.
NOTE2: Next to "TP Percentage" it shows how much of the CURRENT/ACTIVE/REMAINING trade needs to be closed.
NOTE2: If TP2/3/4/5 comes before TP1 - the alert will tell you exactly how many percent of the trade needs to be closed!
ALERT >>>>>>>>>>>>>>>>>>>>>>>>>>>>>>>>>>>>>>>>>>>>>>>
COIN: BTCUSD
TIMEFRAME: 15M
LONG: TP1
TP1: 20500
TP Percentage: 20%
---------------------------------------------------------------------------
Here is how an alert will look for LONG - STOP-LOSS.
ALERT >>>>>>>>>>>>>>>>>>>>>>>>>>>>>>>>>>>>>>>>>>>>>>>
COIN: BTCUSD
TIMEFRAME: 15M
ENTRY: 20000
LONG: SL
SL: 19000
---------------------------------------------------------------------------
Here is how an alert will look for LONG - EOD (End of Day) In Profit close.
ALERT >>>>>>>>>>>>>>>>>>>>>>>>>>>>>>>>>>>>>>>>>>>>>>>
COIN: BTCUSD
TIMEFRAME: 15M
LONG: EOD-Close (profit)
ENTRY: 20000
EOD-Close: 21900
===========================================================================
Adding Alerts in TradngView
---------------------------------------------------------------------------
-Add indicator to chart and make sure the correct strategy is configured (check Backtesting results)
-Right-click anywhere on the TradingView chart
-Click on Add alert
-Condition: Select this indicator by it’s name
-Immediately below, change it to "alert() function calls only", as other wise there will be 2 alerts for every alert!
-Expiration: Open-ended (that may require higher tier TradingView account, otherwise the alert will need to be occasionally re-triggered)
-Alert name: Whatever you desire
-Hit “Create”
-Note: If you change ANY Settings within the indicator – you must DELETE the current alert and create a new one per steps above, otherwise it will continue triggering alerts per old Settings!
===========================================================================
Good Luck! (NOTE: Trading is very risky, past performance is not necessarily indicative of future results, so please trade responsibly!)
---------------------------------------------------------------------------
NOTE: There seems to be a strange glitch when strategy is running live, it will show "double-take" take-profits labels on the chart. This is not affecting the script logic and backtesting results, if you simply change the timeframe real quick to something else then back - it will no longer show the duplicate orders... this must be some sort of a glitch as every alert was thoroughly tested to make sure everything is working!

Trend Lines with Break Signals [UAlgo]🔶 Description:
The "Trend Lines with Breaks " indicator is designed to identify and visualize trend lines on a price chart, allowing traders to observe potential trend reversals or continuations. This script implements a method to draw trend lines based on pivot points (highs and lows) within a specified sensitivity range. It also provides an option to display breaks in these trend lines, aiding traders in recognizing significant market movements.
🔶 Key Features:
Trend Line Sensitivity Adjustment: Users can adjust the sensitivity of the trend lines using the "Trend Line Sensitivity" parameter, allowing customization based on market conditions and preferences.
Visualization of Trend Lines: The indicator visually represents trend lines on the chart, distinguishing between upward and downward trends. Users can customize the appearance of these trend lines, including color, style, and width.
Detection of Trend Line Breaks: Trend line breaks are identified by comparing the current price with the slope of the trend line. If the price breaks below (for bullish trend lines) or above (for bearish trend lines) the slope of the trend line, indicating a potential reversal, a "B" label is displayed on the chart. Trend line breaks are only displayed if the "showBreaks" parameter is enabled.
Before Bearish Trend Line Break :
If the price "Close" value closes above the trend line :
Before Bullish Trend Line Break :
If the price "Close" value closes below the trend line :
🔶 Disclaimer:
Not Financial Advice: This indicator is intended for educational and informational purposes only. It does not constitute financial advice or recommendations to buy, sell, or hold any financial instruments.
Use at Own Risk: Trading involves substantial risk of loss and is not suitable for all investors. Users of this indicator should exercise caution and conduct their own research and analysis before making any trading decisions.
Performance Not Guaranteed: Past performance is not indicative of future results. While the indicator aims to assist traders in analyzing market trends, there is no guarantee of accuracy or success in trading operations.

Key Levels SetKey Levels Set allows to set key levels as comma separated values, and to detect breaks to the downside and/or upside, taking into account potential gaps between bars.
This indicator can be very handy if you, like me, rely on some key levels that you identified as potential support/resistance from some technical analysis.
Features
+ It allows for key levels to be set as comma separated values.
+ It draws key levels on chart.
+ On close, it identifies highest key level that has been broken to the upside, if any.
+ On close, it identifies lowest key level that has been broken to the downside, if any.
+ In Cross mode, as bar is printing, it also detects highest/lowest key levels being broken to the upside/downside between bar high and low, if any.
+ It plots and labels breaks with current level and next level information.
+ It includes alerts from breaks on close.
+ It includes turn on/off functionality.
Settings
+ {Prices} checkbox: turns on/off entire functionality
+ {Prices} text field: comma separated values for key levels
+ {Breaks on} checkbox: turns on/off breaks detection functionality
+ {Breaks on} options: selects Close or Cross mode
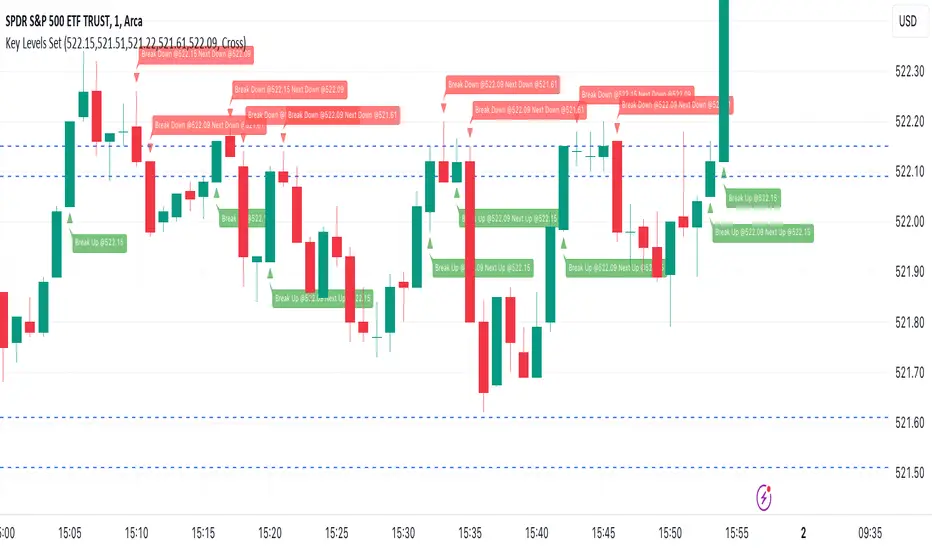
Support and Resistance with Signals [UAlgo]🔶 Description:
"Support and Resistance with Signals ", is designed to identify key support and resistance levels on a trading chart while also signaling potential retests (denoted as "R") and breakouts (denoted as "B"). The indicator dynamically plots support and resistance lines based on pivot points and adjusts them according to price action and sensitivity settings. It aims to assist traders in identifying significant price levels and potential reversal or breakout opportunities.
🔶 Key Features:
Pivot Points: The indicator calculates pivot highs and pivot lows based on a specified period length (Checks Left and Right bars). Adjust the length of the pivot period to control the sensitivity of support and resistance levels according to the your preferences.
Support and Resistance Lines: It plots support and resistance lines at the pivot high and pivot low points, respectively.
Retest and Breakout Signals: Signals are generated based on the sensitivity setting, which adds/subtracts a portion (half) of the Average True Range (ATR) to the pivot points. A retest signal ("R") is generated when the price approaches the support or resistance level within the sensitivity range. A breakout signal ("B") is generated when the price surpasses the support or resistance level.
Sensitivity (ATR Length): Modify the retest-breakout sensitivity length to fine-tune the generation of signals based on price volatility.
Maximum Lines : Limit the number of support and resistance lines displayed on the chart for clarity.
Line Colors and Width: Customize the colors and width of support and resistance lines for better visualization.
More Examples:
Before Retest Signal:
When the price enters the retest range at the specified sensitivity:
Disclaimer:
This indicator is provided for informational purposes only and should not be considered as financial advice. Trading involves risk, and users should conduct their own research and analysis before making any investment decisions. The retest and breakout signals generated by this indicator are based on historical price data and may not guarantee future results. Users should exercise caution and use additional confirmation methods before entering any trades based on the signals provided by this indicator.
Happy Trading !
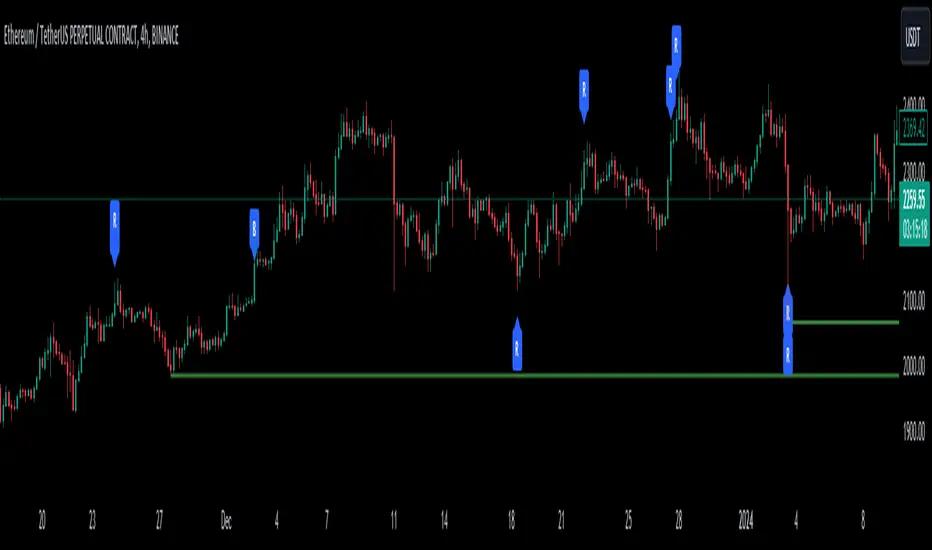
NIFTY POSITION ScannerTracking the real-time intraday position of NIFTY stocks is the utility of this price action based scanner. The number of stocks in this scanner is 40 due to TradingView's script limit.
The script takes present day's price range of the stocks (stocks of the Index being tracked included in this screener) into account, to hint strength or weakness in the underlying Index (for example: NIFTY here).
The day's price range of a stock is gauged on a scale of 0-100, where 0 is Day's price low and 100 is day's price high.
If a stock is in 90-100 price range section the cell with title "90" illuminates hinting the stock is trading near day's high.
Likewise, if a stock is in 0-10 price range section the cell with title "10" illuminates hinting that the stock is trading near day's low.
The price range of 10-25 is represented in the cell titled "25"
The price range of 75-90 is represented in the cell titled "75"
Only one cell from the day's range illuminates at a time for a stock, signaling the present position of that stock in the Day's range at that instant.
The script works best above 10 second time frame.
Idea: If majority of the heavy weight stocks of the Index being tracked are trading near Day's high the underlying Index must be going strong at that very instant and Vice versa.
Disclaimer: Only for studying Index movement ideas intraday, trading is not advised.
Also check out the other scripts by me.
-- Dr. Vats
