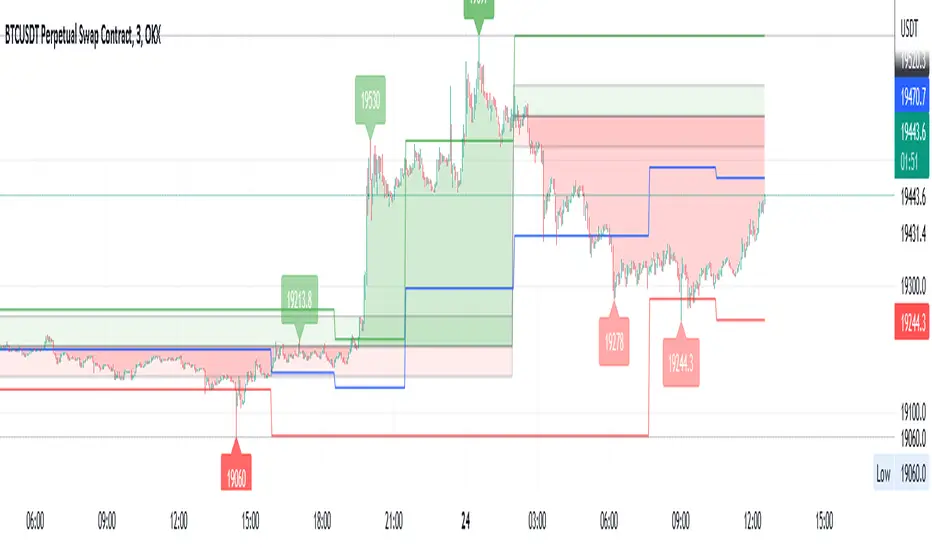
EVA - Daily Candle BoxThis is a very simple indicator who display few information about the LAST daily candle. ( it is possible to change the timeframe to have information about last week or last hour )
The green background zone is the channel between last daily candle close and last daily high.
The red background zone is the channel between last daily candle close and last daily low.
The middle line display the last daily candle close.
You can desactivate some display , and let just what you need.
If you have any idea to improve it , let me a message !
Pine Script® indicator