Buy/Sell IndicatorBased on logic from many top contributors here, the script utilizes LazyBear's WaveTrend Oscillator Indicator along with custom code to plot a few key components for daily trading;
Boundaries for entry and exit points which are based on a 6-day trend in OPEN/HIGH and OPEN/LOW prices.
Daily HIGH and LOW points to establish a good view of stock's movements
Entry and exit points with confidence levels. These can be treated as entry points for short to medium term investments
Entry points come in the colours of White and Lime, where white is slightly confident and lime is extremely confident
Exit points come in the colours of Maroon, and Red, where maroon is slightly confident and red is extremely confident
Each Entry and Exit point also comes without text, or with a M or H above it, where M indicates medium confidence on the point and an O indicates overconfidence.
Use Case:
The best possible use case is to enter a trade on a LIME point with O text, this means that is an overconfident entry point.
The trade should be exited on a RED point with O text, this means that is an overconfident exit point.
But you can do with the indicators as you please.
In addition to LazyBear's code, the following existing models and indicators are taken into account:
RSI of closing price over a period of 25
EMA of RSI
Buysignal

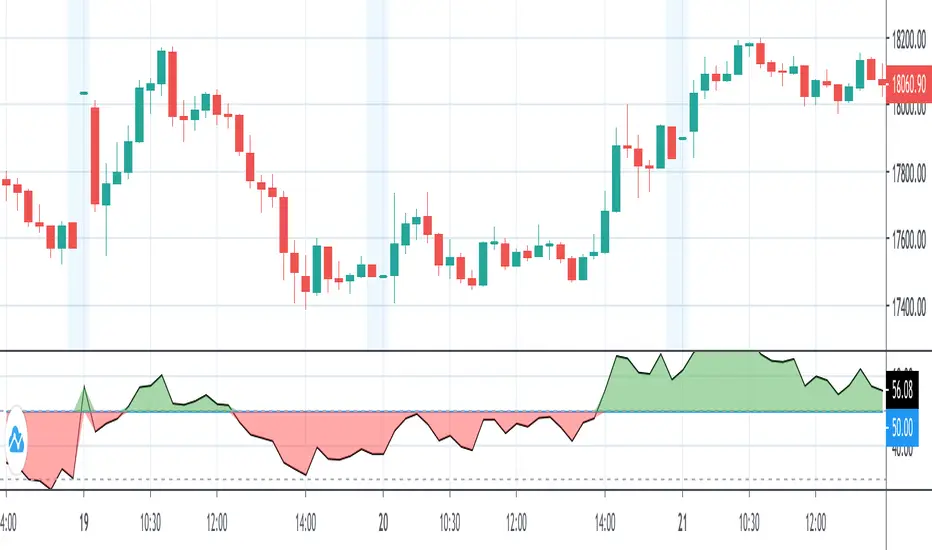
RSI Market trendClear indication of market up and down trend so that you can stick to Buy or Sell strategy based on RSI.
KINSKI Buy-Sell Signal"KINSKI Buy-Sell Signal" is an Average True Range (ATR) based trailing stop indicator.
In this version, you can change the ATR calculation method using the settings. The default method is hlc3. The HLC stands for High, Low, Close and the /3 divides the result by 3 to give you the average.
The indicator calculates the buy and sell signals using HLC3, Simple Moving Average ( SMA ) and the Exponential Moving Average ( EMA ) as soon as they cross. This indicator is useful with time intervals starting at 15m.
Have fun with it and be careful when buying and selling!
Example Chart:

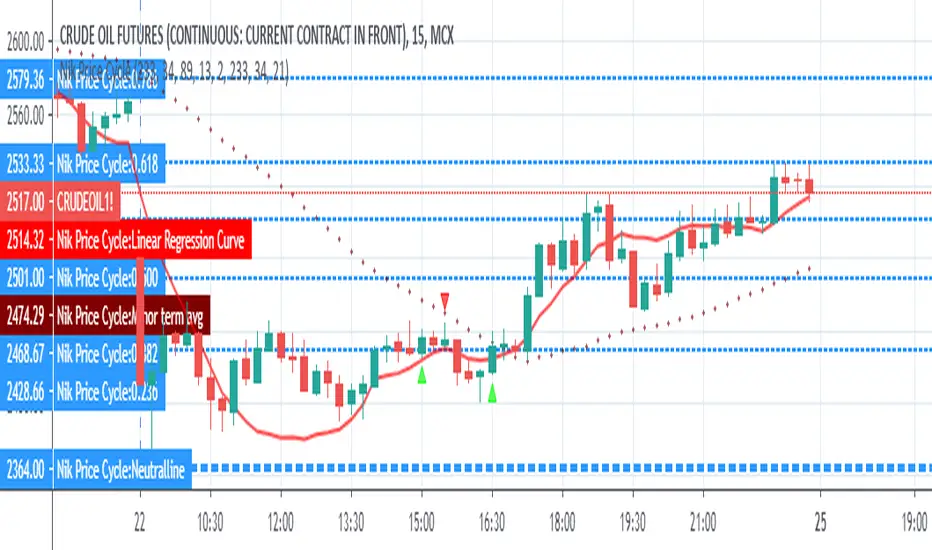
Nik Price CycleEvery script follow a pattern in their price cycle. This can be defined by division of price cycle. Division line will act as pivot point.Above this bar this any price movement is indication of bullish trend while below this line any price movement is indication of bearish trend. This Nik price signal will give great result in combination of magicsignal which is also one of our developed signal. Although we have included various calculation for analysis purpose in this indicator. i suggest to go in setting and uncheck all channel lines and shapes for getting clear picture of trend and entry point. for more details on how to use this indicator people can message us
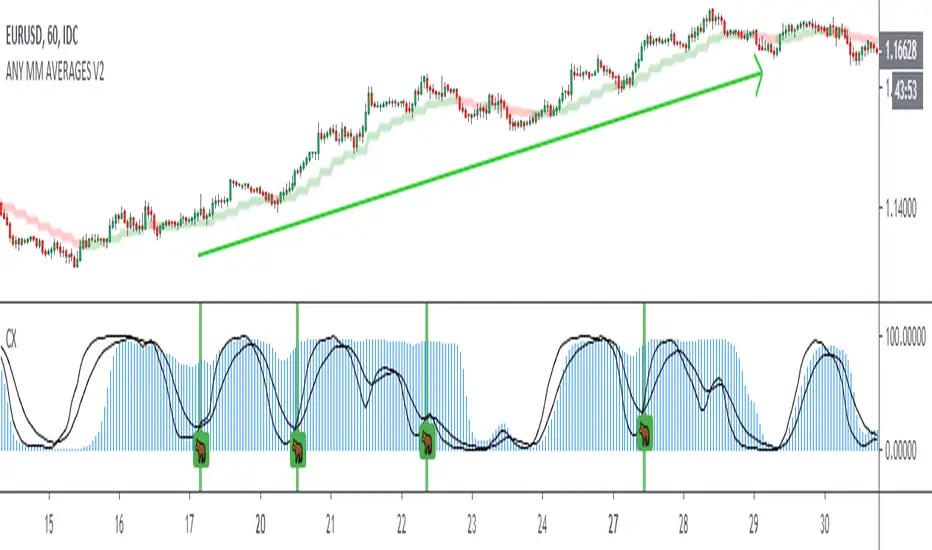
Follow Line MTF Any MM AverageThe original version uses SMA, in this new version you can choose any type of MA and time frame.
- RMA,SMA,EMA,WMA,VWMA,SMMA,KMA,TMA,HullMA,DEMA,TEMA,CTI
- 1 min, 3 min, 5 min, 15 min, 30 min, 45min, 1h, 2h, 3h, 4h, 1d, 1w, 1M
- Alerts
Combine multiple time frames, this will come in handy ¡¡¡¡
Success in your trade ¡¡¡¡
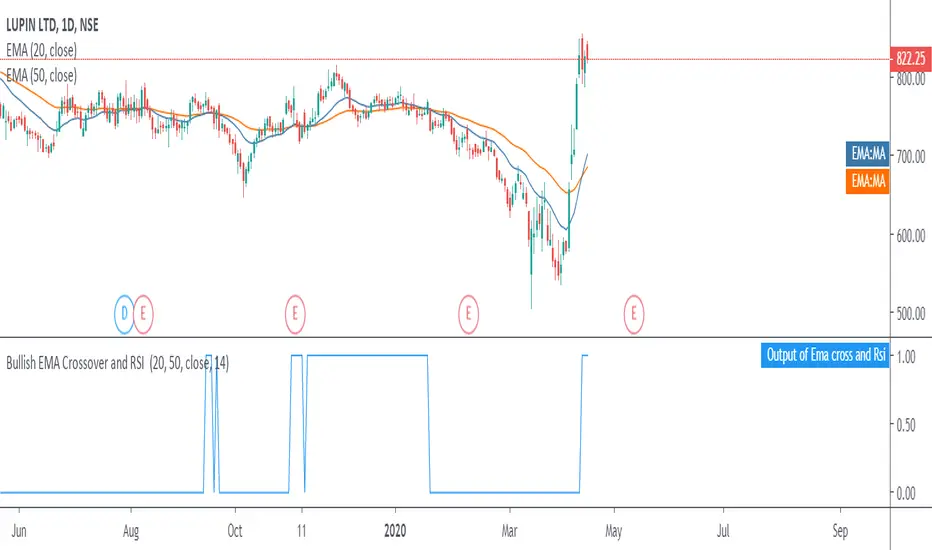
Moving Average Exponential crossover with bullish RSI signalsWhen the market is giving the signals for bullish trend, which shows the shorter period exponential(20) moving average crossing the longer period moving average(50), with a strength shown in the market i.e. RSI greater than 40.
So when all these conditions are met a buy signal is generated in output (Output of Ema cross and Rsi) having value as 1.
So a trader can enter into a long position when the value is 1 and exits a stock when value is 0.
This script is not to be used for selling the stocks in downtrend
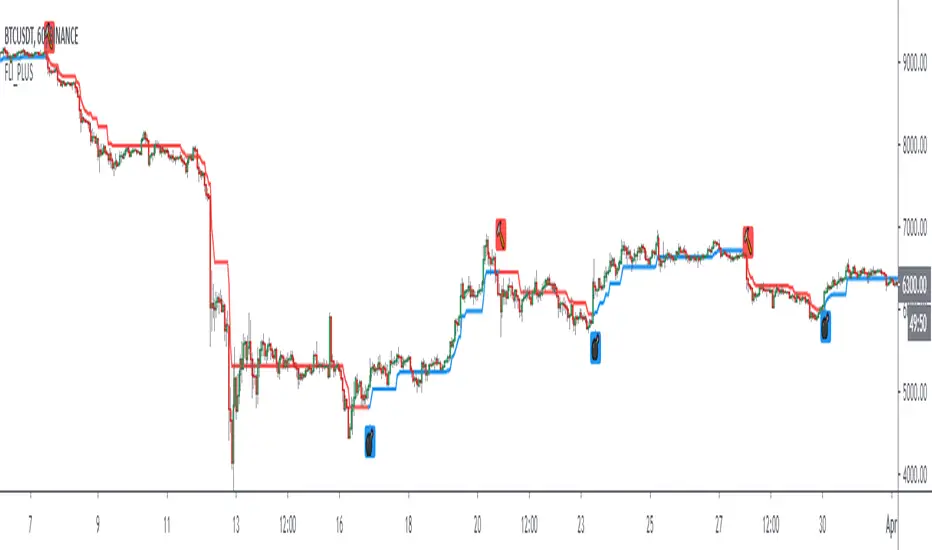
Follow Line IndicatorThe FollowLine indicator is a trend following indicator. The blue/red lines are activated when the price closes above the upper Bollinger band or below the lower one.
Once the trigger of the trend direction is made, the FollowLine will be placed at High or Low (depending of the trend).
An ATR filter can be selected to place the line at a more distance level than the normal mode settled at candles Highs/Lows.
Alerts Added

Simple Reversal PointThis indicator finds possible points of reversion, you can use it to stack positions and get a good average price for when the price changes direction, it is the trader responsibility to manage the position and make a profit.
-Added alerts
Crack XThis indicator looks for cracks (de-correlation of 2 indicators), what you have to do is simple, first look at the trend in a higher frame, there are many indicators for this, then look for cracks as wide as possible (you can configure the size in the configuration) and that they are not close to important supports / resistances. This indicator can be very useful for Swing, Coverages, to increase existing positions.The confirmation of the crack occurs when the black lines cross + bar closure.
- Added Alerts
Premium Stochastic OscillatorThe PSO is a rewired version of a short-period stochastic. Unlike a standard stochastic oscillator, this indicator is normalized to register neutral values at zero while providing greater sensitivity to short-term price moves. This indicator uses a central zero line as a reference point and will oscillate above and below this point as price fluctuates. In addition, the PSO is smoothed by using a double exponential moving average to provide a more even response to turns in the market.
(from TASC magazine, August 2008 issue).
The Premium Stochastic Oscillator was introduced by technical analyst Lee Leibfarth.

Normalized Smoothed MACDMACD normalized with its highest and lowest values over the last “Normalization period”
- includes alerts

KDJ Indicator The KDJ indicator is derived from the Stochastic with the one difference being the addition of the J line. This implies that the KDJ indicator has a total of three lines; %K%D%J. The %J is simply put, the difference between the %K and the %D lines, which is similar to the MACD.
The difference between the %J and that of the MACD is that it is plotted as a histogram and the second being that the value are weighted and as such delivers more emphasis on the shorter term %K line.
What we now have is a line that moves quite slowly and has the knack to move beyond the range of a normal stochastic indicator.

Market ModeThe Market Mode indicator seeks to identify trends and rebounds by identifying “phases” according to the principles of John Ehlers.
- When the oscillator passes above the top line, the market is in an uptrend.
- When the oscillator goes below the bottom line, the market is in a downtrend.
- Between these two levels, the market is calmer and could rebound in the direction of the initial trend and / or phase of trend change.

Quadratic SemaphoreThe quadratic semaphore indicator is an indicator that find confirmed market u-turn with the help of 2 quadratic regression calculated with Highs and Lows over the last “length” periods.
- “p” setting is candlesticks quantity to confirmed the quadratic regression has formed a High or Low parabola, such as Fractals. Consecutive same signals can happen due to the use of different price values for upper and lower semaphore.
- Adjust the settings to your instrument and time frame.
- Alerts included.
Success with your trade¡¡
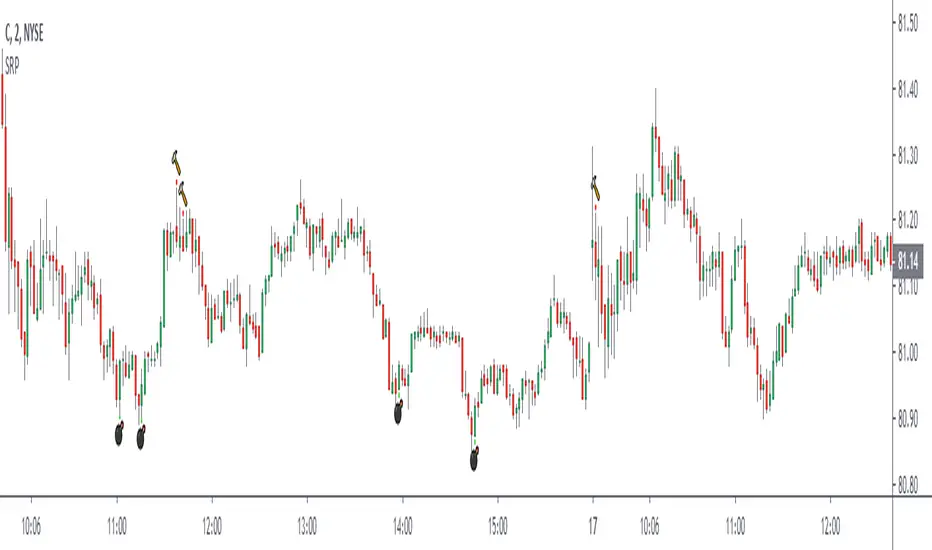
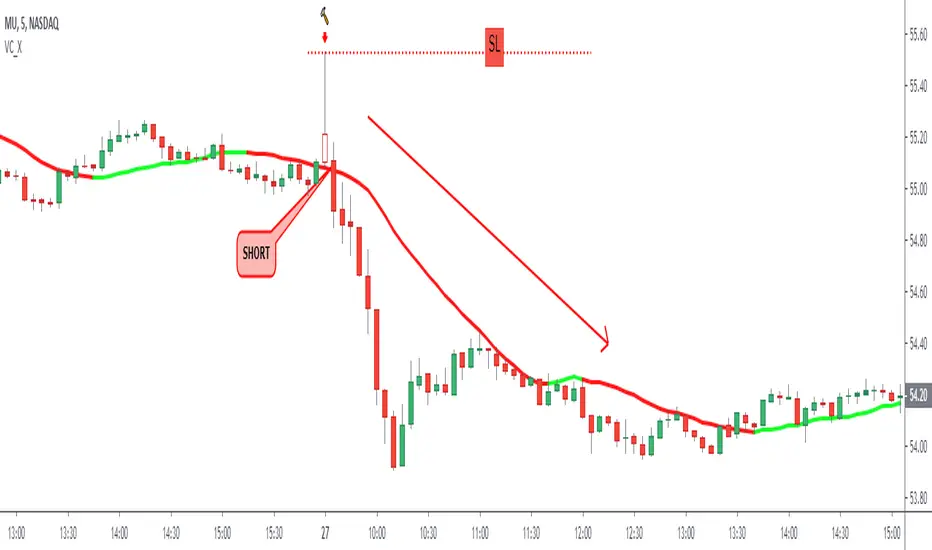
Long Tail Candle by Oliver VelezThis script detects an event created by Oliver Velez, it is a wide-range candle with a small body and a long tail (hammer-type candle), its range is noticeably larger than previous candles, as a rule it can be taken that the body should be maximum of 30% of the total range of the candle with a long tail. The stop goes under the tail and the signal is given when the next candle followed by the long tail candle exceeds its body, do not program this condition so that the alert indicates that a long tail candle was generated and the trader has some Time to visualize the graph and wait for the signal.
The default configuration is very basic, each trader must adjust to their needs.
- Trend filters can be activated.
- Alerts available.
Thumbs up
TMMS OscillatorThe TMMS oscillator (aka “Trading Made More Simpler”) is an indicator made of conditions based on both 2 separated Stochastic and 1 RSI.
Bullish zone is green and bearish one is red. When the histogram is grey, no signals is available at that time.
The indicator has an option to show the current trend of an Hull moving average (ascending or descending curve). When the trend is up, green dots are plotted on the zero line. When the trend is down, the dots are coloured in red.
Greetings, success with your trade!!!

Depth Multiple Time FrameThe price always returns to the average !!!
An important separation of the price with respect to an average, indicates a depth and generally generates a reversion or correction in the trend. Depth detection is a simple and very powerful technique, it is widely used for scalping and pyramid operations, this indicator detects depth in 7 time frames, everything is configurable independently, simultaneous detection of depth in several time frames increases The chances of success in the operation. I personally like pyramidization and it is one of the tools I use to detect depth to average the price of my operations.
thumbs up!!

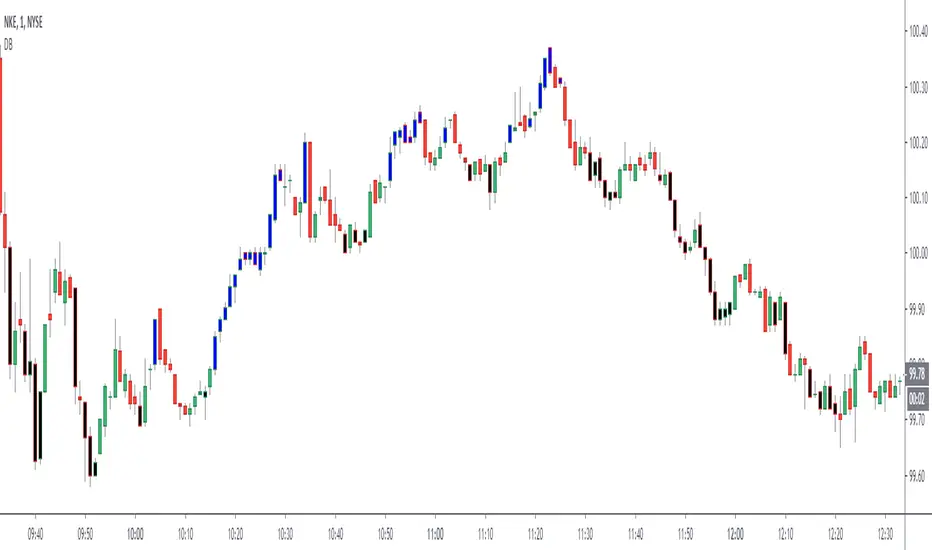
Dreadblitz BarsThese bars can give you good opportunities if you know how to analyze the context.
blue=bullish
black=bearish
thumbs up

ESPECULATOR XNew indicator, I hope you like it.
- If you want to filter more the signals you can activate in MacD Filter in the configuration.
- The use of the indicator is simple, with a simple Trader evaluation you can take good positions.
Note: Volume Required
Thumb up if you think it's a good tool ..
Good energy for everyone.
Regards.


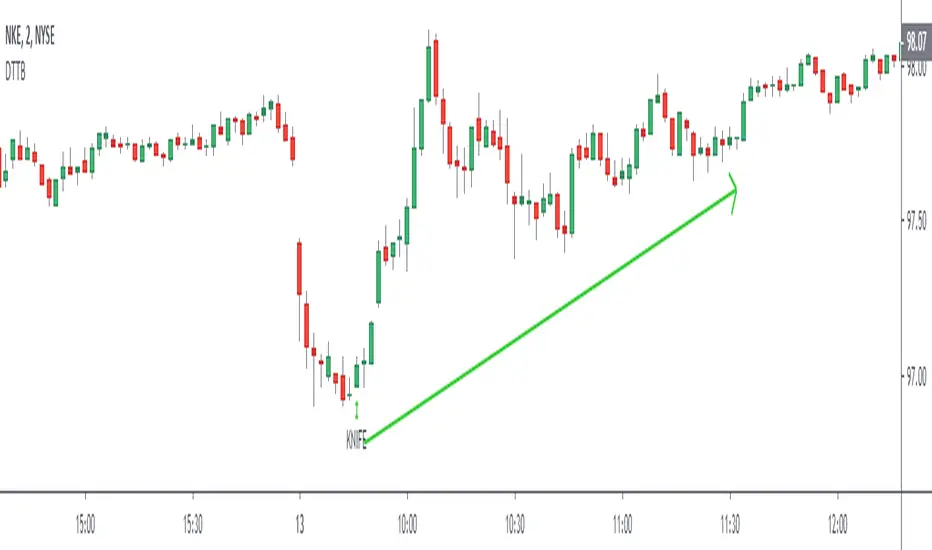
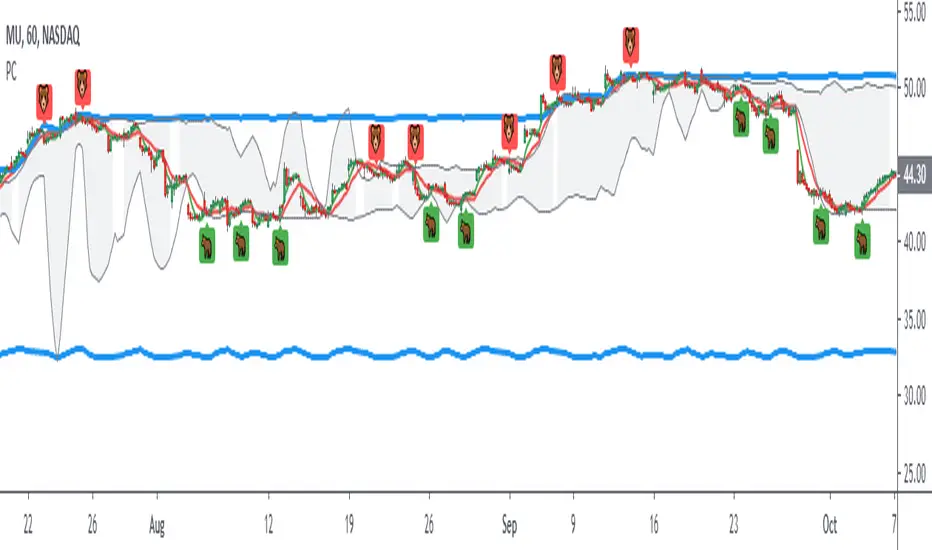
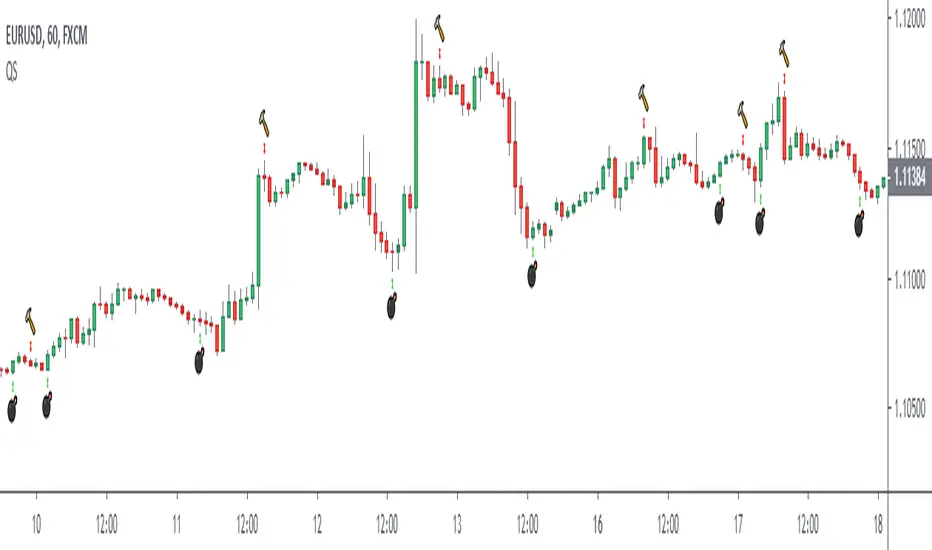
Death To The BearAre you a bear ? RUN!! RUN!! Your life is short here!
Dear friends, I bring you this indicator that you will like, no complexity, just buy signals.
We will try to find possible turning areas, and you will have 6 weapons to use.
Look at the simple configuration:
- BOMB
- KNIFE
- DYNAMITE
- DAGGER
- GUN
- CHEMICAL
- Minimum Level
let's start...
BOMB = high probability of turning
strong bearish trend bombs? it doesn't matter .. does it reach you a 3: 1 ratio? You can make a quick play.
KNIFE = a little more confirmation and excellent weapon to average positions
DYNAMITE = excellent weapon to massively dynamite low areas and also solitary dynamites
DAGGER = excellent weapon to average price
GUN = good shots for patient people who want to average price and look for a more extensive movement
CHEMICAL = I really like this to average the price while I have a nice drink
Minimum Level = you can modify this variable, negative values look for more depth in the market but you will have less signals, positive values look for less depth in the market but you will have more signals, by default = 0
Very simple, without complications!!
aaaa .... but can I activate several weapons at once? of course BOOOOOOMMMM .... poor bears !!!
Anything else? Yes of course....
- All alerts ready to use
LISTEN TO ME ... ADD THE INDICATOR, TAKE YOUR TIME, TEST DIFFERENT CONFIGURATIONS, TEST DIFFERENT TIME FRAMES, TEST DIFFERENT ACTIVE, SEARCH AND FIND, PATIENCE ...... OK READY?
WE WILL MAKE MONEY AND KILL OUR DEAR BEARS!
APPLY A GOOD RISK MANAGEMENT.
NOTE: GOOD INSTRUMENT DATA WITH REAL VOLUME IS REQUIRED
thumbs up!!!!