Overnight vs Intra-day Performance█ STRATEGY OVERVIEW
The "Overnight vs Intra-day Performance" indicator quantifies price behaviour differences between trading hours and overnight periods. It calculates cumulative returns, compound growth rates, and visualizes performance components across user-defined time windows. Designed for analytical use, it helps identify whether returns are primarily generated during market hours or overnight sessions.
█ USAGE
Use this indicator on Stocks and ETFs to visualise and compare intra-day vs overnight performance
█ KEY FEATURES
Return Segmentation : Separates total returns into overnight (close-to-open) and intraday (open-to-close) components
Growth Tracking : Shows simple cumulative returns and compound annual growth rates (CAGR)
█ VISUALIZATION SYSTEM
1. Time-Series
Overnight Returns (Red)
Intraday Returns (Blue)
Total Returns (White)
2. Summary Table
Displays CAGR
3. Price Chart Labels
Floating annotations showing absolute returns and CAGR
Color-coded to match plot series
█ PURPOSE
Quantify market behaviour disparities between active trading sessions and overnight positioning
Provide institutional-grade attribution analysis for returns generation
Enable tactical adjustment of trading schedules based on historical performance patterns
Serve as foundational research for session-specific trading strategies
█ IDEAL USERS
1. Portfolio Managers
Analyse overnight risk exposure across holdings
Optimize execution timing based on return distributions
2. Quantitative Researchers
Study market microstructure through time-segmented returns
Develop alpha models leveraging session-specific anomalies
3. Market Microstructure Analysts
Identify liquidity patterns in overnight vs daytime sessions
Research ETF premium/discount mechanics
4. Day Traders
Align trading hours with highest probability return windows
Avoid overnight gaps through informed position sizing
CAGR

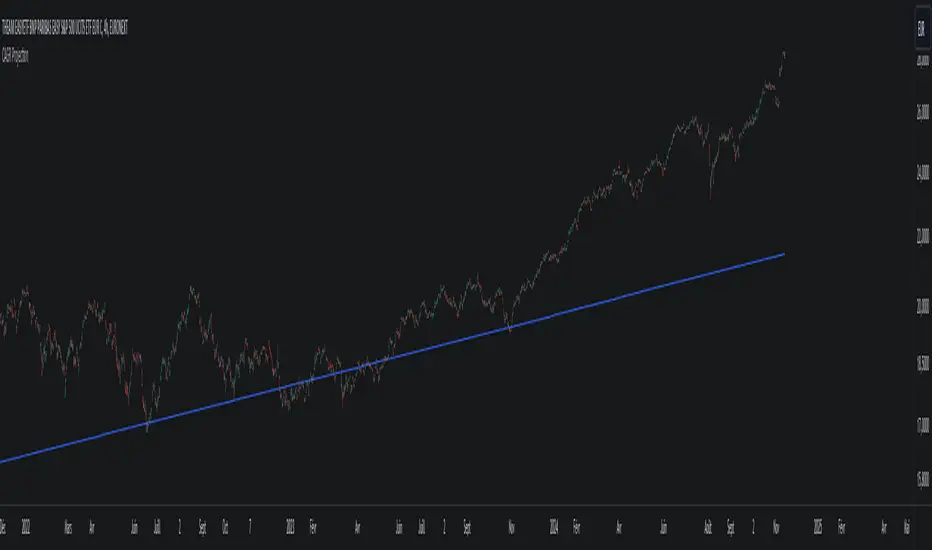
CAGR ProjectionThe CAGR Projection Indicator is a tool designed to visualize the potential growth of an asset over time based on a specified annual growth rate. This indicator overlays a projection line on the price chart, allowing traders and investors to compare actual price movements with a hypothetical growth trajectory.
One of the key features of this indicator is the ability for users to input their expected annual growth rate as a percentage. This flexibility allows for various scenarios to be modeled, from conservative estimates to more optimistic projections. Additionally, the indicator allows users to set a specific start date for the projection, enabling analysis from any chosen point in time.
The projection calculation is dynamic, adjusting for different timeframes and updating with each new bar on the chart. The indicator initializes either at the specified start date or when the first valid price is encountered. Using the initial price as a base, the indicator calculates the projected price for each subsequent bar using the compound growth formula. The calculation accounts for the specific timeframe of the chart, ensuring accurate projections regardless of whether the chart displays daily, weekly, or other intervals.
The projected growth is plotted as a blue line on the chart, providing a clear visual comparison between the actual price movement and the hypothetical growth trajectory. This visual representation makes it easy for users to quickly assess how an asset is performing relative to the expected growth rate.
This tool has several practical applications. Investors can use it to set realistic growth targets for their investments. By comparing actual price movements to the projection line, users can quickly assess if an asset is outperforming or underperforming relative to the expected growth rate. Furthermore, multiple instances of the indicator can be used with different growth rates to visualize various potential outcomes, facilitating scenario analysis.
The indicator also offers customization options, such as displaying a label showing the annual growth rate used for the projection, and the ability to adjust the color of the projection line to suit individual preferences or chart setups.
In summary, this CAGR Projection indicator serves as a valuable tool for both long-term investors and traders, offering a simple yet effective way to visualize potential growth scenarios and assess investment performance over time. It combines ease of use with powerful analytical capabilities, making it a useful addition to any trader's or investor's toolkit.
Rolling CAGR (Compound Annual Growth Rate)Simple and powerful Rolling CAGR (Compound Annual Growth Rate) script.
Works with daily, weekly, and monthly data. Do not work with data of hours, minutes, seconds, or customized time intervals.
You can change the rolling period, from the default (3 years) to any other period of years. Just change one value in the script.

Plots CAGR lines for a given set of ratesPlots CAGR lines for a given set of rates from a specified time. It will be helpful to see how the rate of growth of a security's price is changing over a period of time. It also calculates the current CAGR from the time specified. Works on D, W, M timeframes.
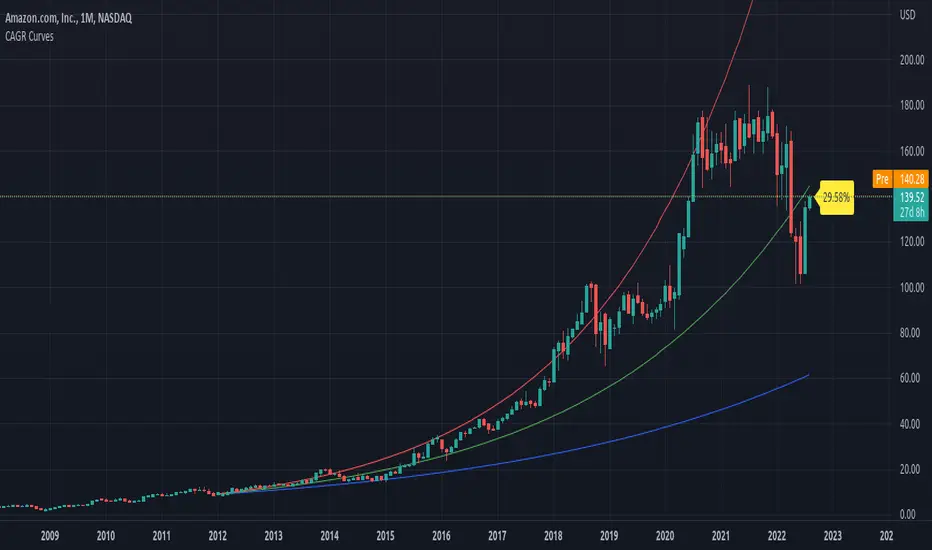
Rolling CAGRCompound Annual Growth Rate
This indicator is the compound annual growth rate to be used on any ticker.
How to use
Add indicator to your chart
Specify a data source (default is the close for the selected ticker)
Specify how many trading days are in a year (252 for stocks & 365 for crypto)
Restrictions
This is only accurate on the daily timeframe. So to avoid confusion, I disabled the plotting of the CAGR on any timeframe other than daily
