Ryan's Candle Comboinside bar breakouts and reversal moves. version 1. use however u like it I cannot guarantee profitability :)
Candle
MTF WatchList Charts [Anan]█ OVERVIEW
I am happy to present this script with a nice idea!
You can now customize a watchlist with your preferred time frame and any symbol from any market.
The main purpose is to be aware of any moves and watch a brief overview of the chart.
█ FEATURES
- 8 customizable symbols with the option to show/hide anyone
- Multi time frame support
- 3 Types of charts (Candles / Heikin Ashi / Line)
- Displaying up to 10 candles for every chart
- Customizable chart colors
- Option to Show/hide Price
- Option to Show/hide Price Line
- Option to change Labels and Text Size
- Show Symbol name and used time frame
- Option to change gaps between charts
- Hover over on the top of any candle to see (Open/High/Low/Close) Prices
█ SCREENSHOTS
-----------------------------------------------
Special thanks to @dgtrd for inspiration and for the amazing framework used here ( HTF Candles by DGT )
Special thanks to Pine Chat @fareidzulkifli @Bjorgum @JohnBaron @fpainchaud

Nunchucks✖ Nunchucks
A new way to display market data
Does not flip color during current candle
Displays Higher and Lower than the previous nunchuck's range
Use it with current price line

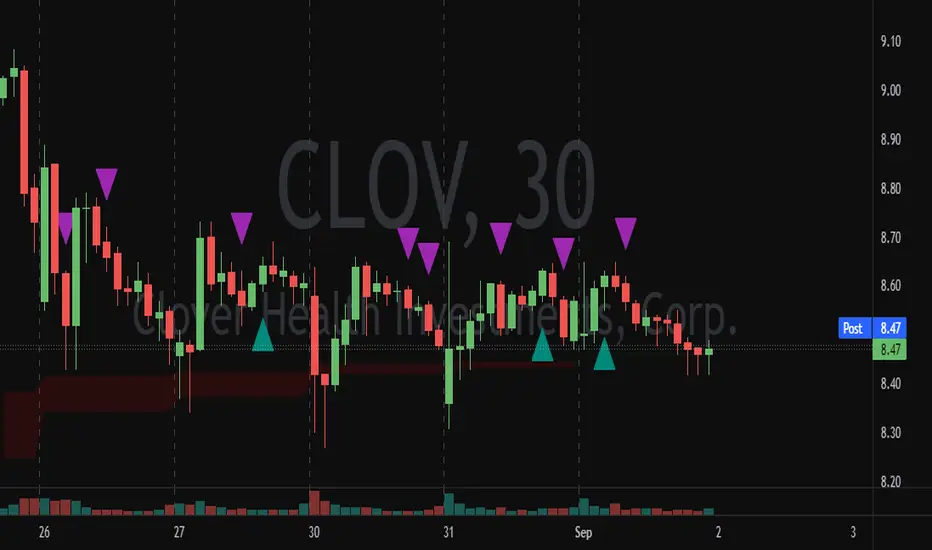
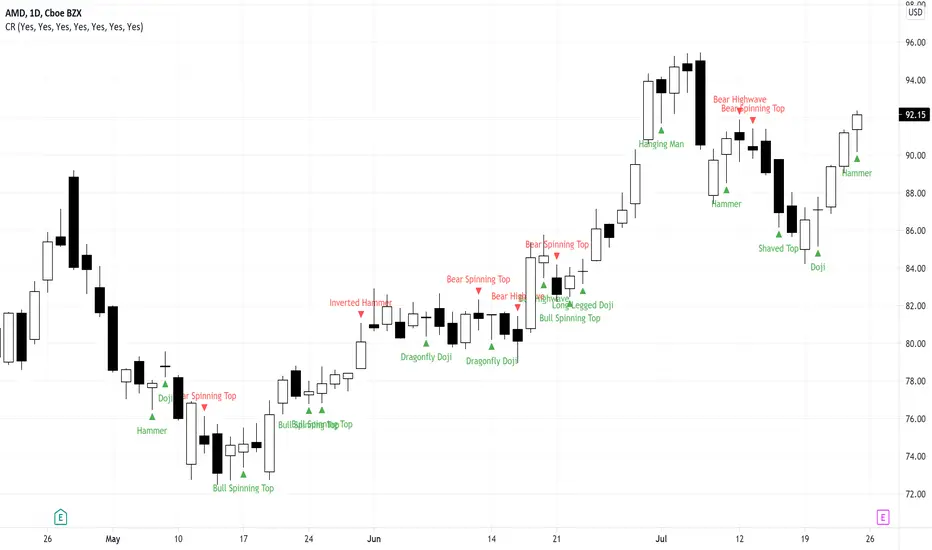
Candlestick RecognitionCandlestick Recognition
Version 1.0
Fun script to recognize and name candlesticks. Hamers and Highwaves and Marubozus oh my!
All candlestick names can be turned on or off in the settings since sometimes they stack close to each other and are hard to read. If you think I mislabeled any please provide me with an example of what you think it should be and I will review it to see if any changes need to be made. Please keep in mind that each stock will be a little different as the Candlestick Recognition uses ATR (Average True Range) for the calculations.
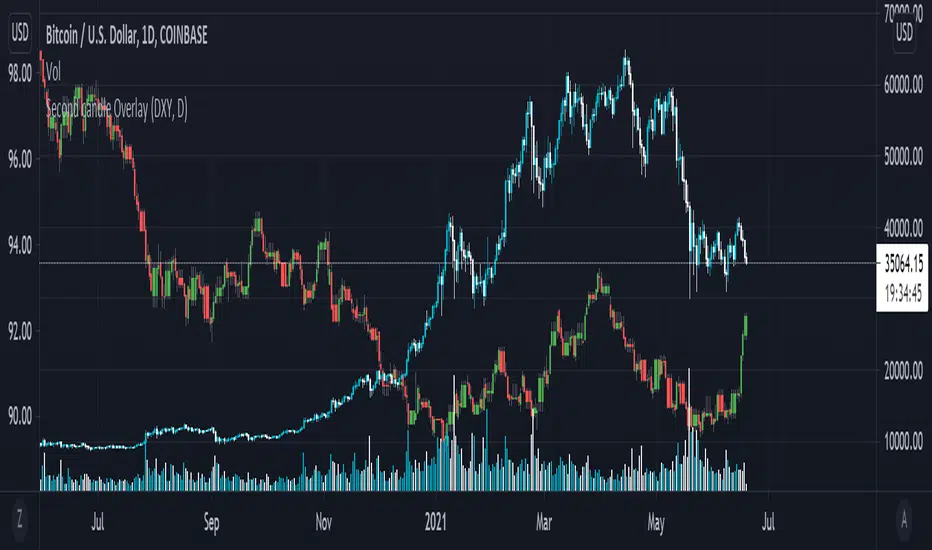
Secondary Candle OverlayThis simple script is meant to allow the user to select another symbol to add onto their chart and plot the candlesticks for that symbol at the selected resolution requested.
Please see the tooltip provided by the 'Secondary Symbol' input for more details with regards to properly using this script on symbols that have vastly different valuations, it will help with getting the symbol requested to scale properly with the primary symbol on the chart.
The user may also input which colors are used for bullish/bearish candles as well as the symbol itself and its resolution.
IMPORTANT NOTE: THIS SCRIPT DOES NOT ACCOUNT FOR SYMBOLS THAT ARE NOT CONTINUOUS (The defval for the symbol is TVC:DXY which closes on weekends whereas a cryptocurrency like Bitcoin does not stop trading ever; candles on these kinds of markets will be repeated when overlaid onto markets that do not have this property.)
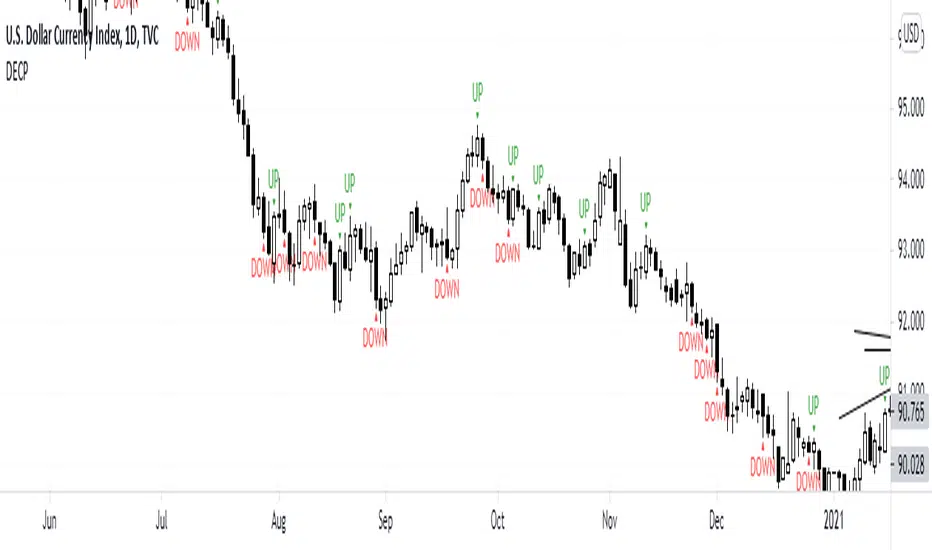
DECPDECP is simple and easy to use!
It detects bullish and bearish engulfing candlestick patterns.
After detecting the patterns I've said, it mentions that the pattern is going to continue its direction to up or down.
But remember candlestick patterns don't determine targets and it's possible that predicted directions fail.
So use it carefully and enjoy it!
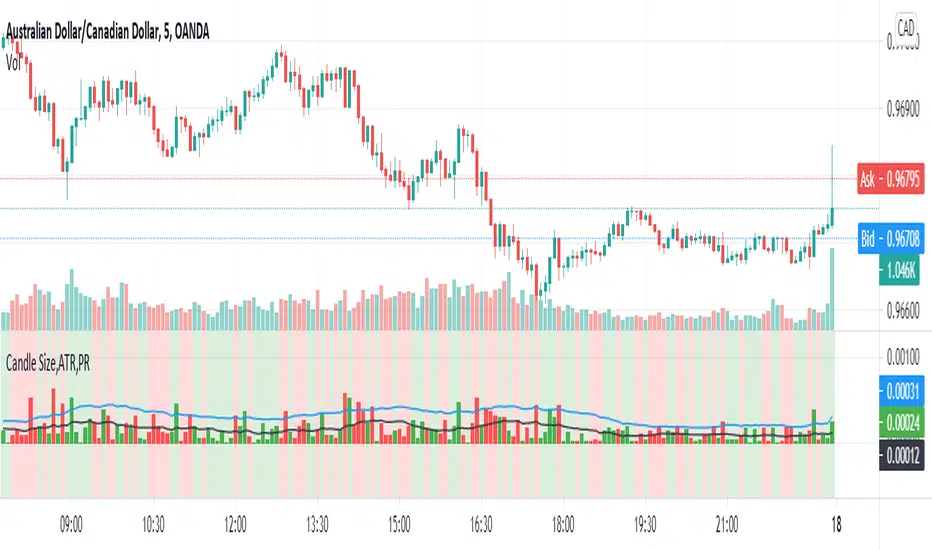
Candle Percent Volatility by AllenlkThis indicator gives you the percentage movement of each candle. Measurements are taken between the candle High point and Low point, and also between the Open and Close and calculated in percent %. From there it smooths out the data with a moving average. This gives you an idea of how much volatility is within each candle given the time resolution of the chart.
I like to use this information as a way to turn off a strategy, or select a proper time resolution for a strategy. If each candle has less than 2.5% Volatility most strategies will typically buy and sell rapidly at prices that are too close together, potentially losing money. During those times it seems best to either temporarily turn off the strategy, change the time resolution or switch to another strategy.

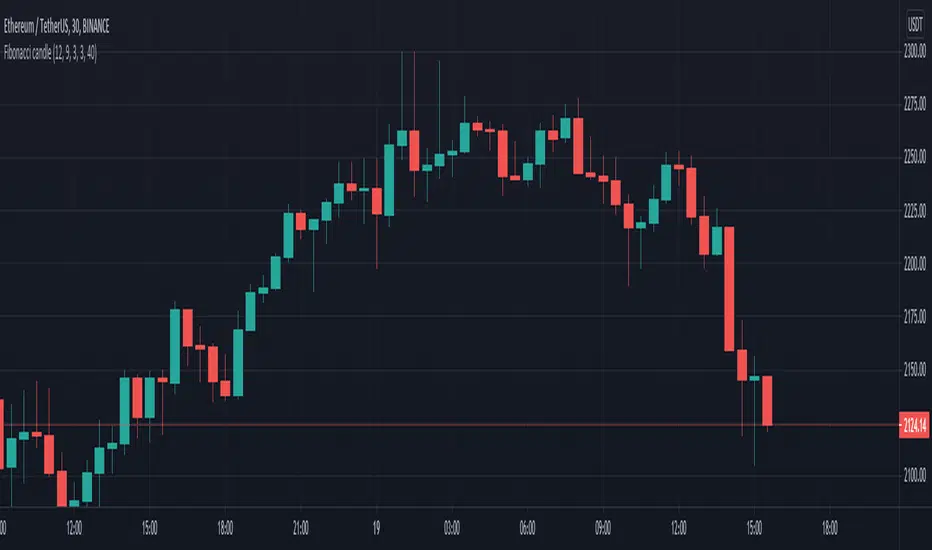
Fibonacci candle with Fibonacci ema strategyFor this strategy I am making use of the fibonacci numbers until 10 sequences and I am using them to make an avg candle and an average ema.
With it, I combine multiple price action rules and I set it up to only go long. When we have a short , we exit from the trade.
From the initial tests, it looks like it performs better on big timeframes.
If you have any questions, let me know !
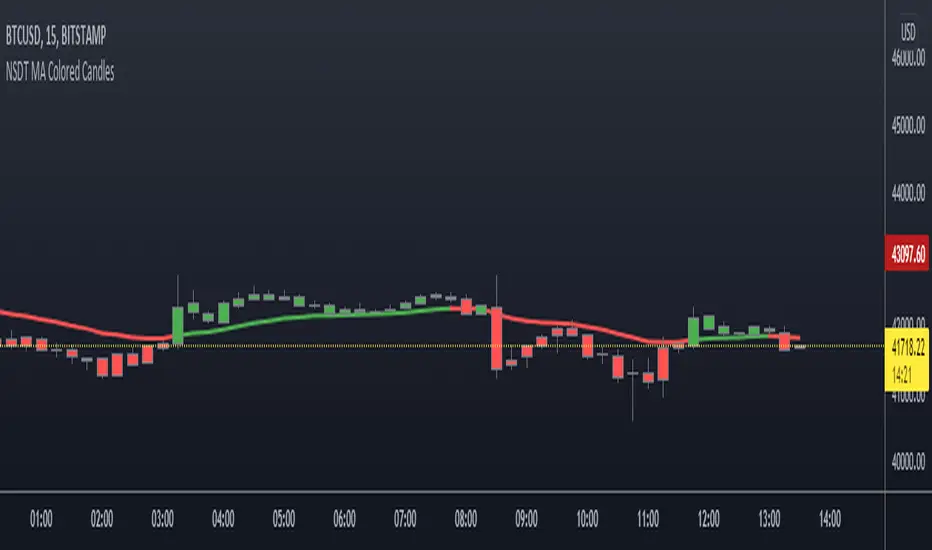
NSDT MA Colored CandlesA simple script that will change the color of the candle if it closes over/under the designated Moving Average. This makes it very easy to identify trends based on your selected Moving Average line length. You can choose EMA, SMA, or WMA and of course the length is adjustable as well. To see these candles, be sure to go into the Chart Settings and uncheck the candle Borders, Colors, and Wicks.
Sentiment analysis combined with multiple MA types for CRYPTOThis is a strategy made from price action combined with multiple moving averages calculations used for the candle histograms.
In this case we calculate the bear and the bull candles based on the next criteria :
Bull candle : ((CLOSE - LOW ) + (HIGH -OPEN) / 2 ) / Candle length
Bear candle: ((HIGH - CLOSE ) + (OPEN-LOW ) / 2 ) / Candle length
Once we have the candle we use moving average to smooth the process, and then we calculate the differece between the bull ma and bear ma.
The result is going to be our histogram.
Once we have the histogram we can start setting up rules for entries and exit.
If you have any question, please let me know!

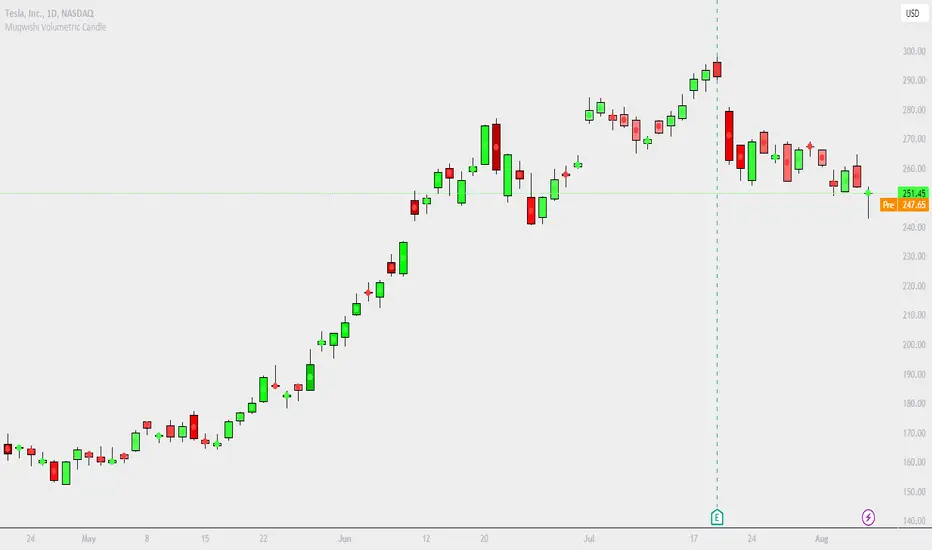
Muqwishi Volumetric CandleIntroduction
Have you ever heard that each candle represents a battle between bulls (buyer) and bears (seller)? If you know the answer, apparently you understand what the price action means. What if I ask you, how much was bloody in each battle between bulls and bears?!. This indicator may give a clear picture of how to identify the candle’s strength by implementing the Standard Deviation on volume and reshape the candle.
The Muqwishi Volumetric Candles indicator works to weigh each candle instantaneously and updates its color level from lightness to darkness based on the rate of the volumetric standard deviation.
Here’s how the idea started with the conceptual design, then improved till achieved to the implemented design of a structured candle.
The conceptual design mentioned for reviewing how the idea started. However, I want you to understand the “implemented design” in which the indicator has been built to address it. As I stated structurally for the implemented design section, wick and border are identified by the user through “Chart Properties” unlike core and body is measured by the indicator.
The candle’s body is ”Dynamic” that colored based on the amount of volume standard deviation in which the low volume standard deviation is a lighter candle’s color and the high volume standard deviation is a darker candle’s color. The core is “Static” color represents zero volume standard deviation which the volume at the average level. In the case where the core is darker than the body means the volume standard deviation is lower than the average volume level, and when the core is lighter than the body mean the volume standard deviation is higher than the average volume level, and when the core’s color has the same body’s color means the volume is in the average level. The image is the best guide to understand the idea.
Rarely seeing a volume standard deviation below -2σ, even though the volume is apparently dead. However, it’s possible to see more than 3.9σ, and mostly it has the same effect as 3.9σ. Personally, any candle above 1.5σ is taking my attention, and more than 2σ I look around seeking for reasons to not take a trade.
§§ Note, if you have misunderstood the standard deviation concept, there are many great sources to understand it such as Wikipedia, YouTube,... etc. In a basic example, How much is your height relative to the height of average people in your city!!?. Similarly, how much is the amount of volume relative to the average volume of a number series of previous bars?!.
Indicator Overview
Before I get into this section, this is NOT meant to be an educational or recommendation. Just showing you how I use this indicator based on an experience.
The chart above has been remarked as an example of how I apply it. Again, it’s a personal preference, and it doesn’t mean this’s an efficient way.
Indicator Setting
➤ Ensure to visualize the indicator to the front for recognition of the candle’s core.
For more information check the image: drive.google.com
➤ Indicator’s title.
Generates two outputs. The first one is the coordinate location for the char “Core”, don’t pay attention to it. The second one colored in blue is referring to the measurement of the volume standard deviation as your cursor point move at any candle on the chart. For more information check the image: drive.google.com
➤ Indicator’s inputs.
■ Length: Number of previous bars covered in the calculation. Prefer between 14-20.
■ Long Candle Color: Choose a color for bullish candles.
■ Short Candle Color: Choose a color for bearish candles.
■ Color Mode: Kinda color style.
● Lightness: From lightness to darkness colored as low volume SD to high volume SD.
● Saturation: From narrow range to wide range colored as low volume SD to high volume SD.
■ Reverse Mode: Yes → Darkness to Lightness colored as low SD to high SD.
■ Show Core: No → Hide cores.
Summarize
■ Users should have a fundamental knowledge of Standard Deviation.
■ The candle’s body is dynamic colored. Got light as low volume standard deviation, and Dark as high volume standard deviation occurred.
■ The Candle’s core is static colored. Represents the average volume which Standard Deviation equals zero.
■ This’s not a trading signal. It works to visualize the level of transactions made per candle.
Final Comments
■ My goal was to achieve the conceptual design, but there’re many obstacles that go beyond the coding ability.
■ Let me know if you have any questions, comments, and any improvements to the project.
■ I hope every time you found this indicator useful and scaled up your trading skills, please present support through PayPal that linked in the signature box below. That will help to get me excited and post many ideas.
■ Trade Safe. ✌
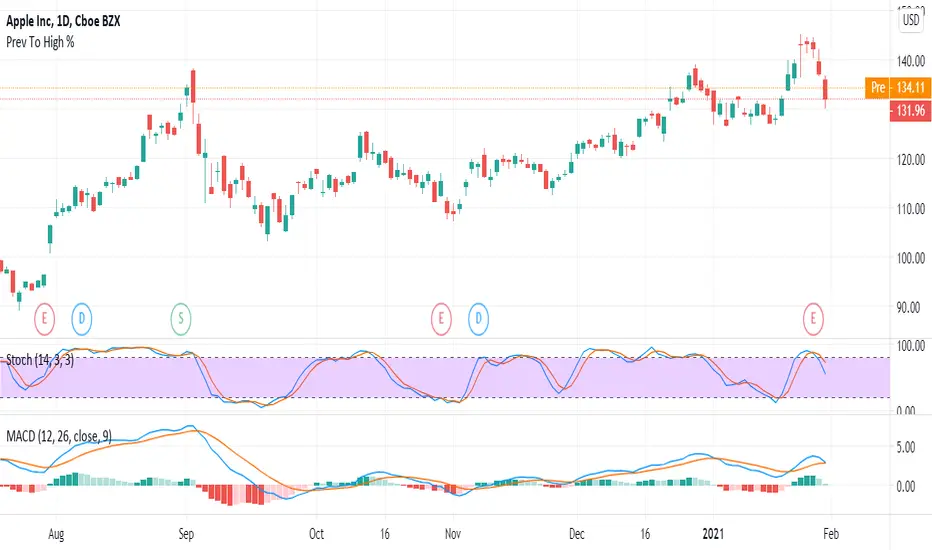
Previous Close To Current High Percentage Per CandleGet the percentage of previous candle price to current high candle price.
This script will make your life easier to get percentage without you calculating it.
Hope you enjoy the tool and let me know if there is any feedback or improvement request.
Thank you very much. :D
--------------------------------
Formula:
Previous To High Percentage Per Candle = (high - previous / previous) * 100%
--------------------------------
Simple Candle Info This script shows the following simple information about the last candle:
- Candle size
- Body size included %
- Top Wick size
- Bottom Wick size
- Top Wick + Body size
- Bottom Wick + Body size
You can change:
- colors and position for labels
- add information for previous candle too
- change language

Candle Color ChangeSimple code for change in Barcolor if the range (high-low) is bigger than the last 5 candles.

Multi Time Frame CandlesHello Traders,
This script can show (upto) 3 candles of another time frames without changing chart time frame realtime . You can choose the time frame and number of candles in the options. You have option to change body and wick colors as well.
in this example number of candles is 2:
You can set body and wick colors:
In this example, weekly candles are shown on 1h chart:
Enjoy!

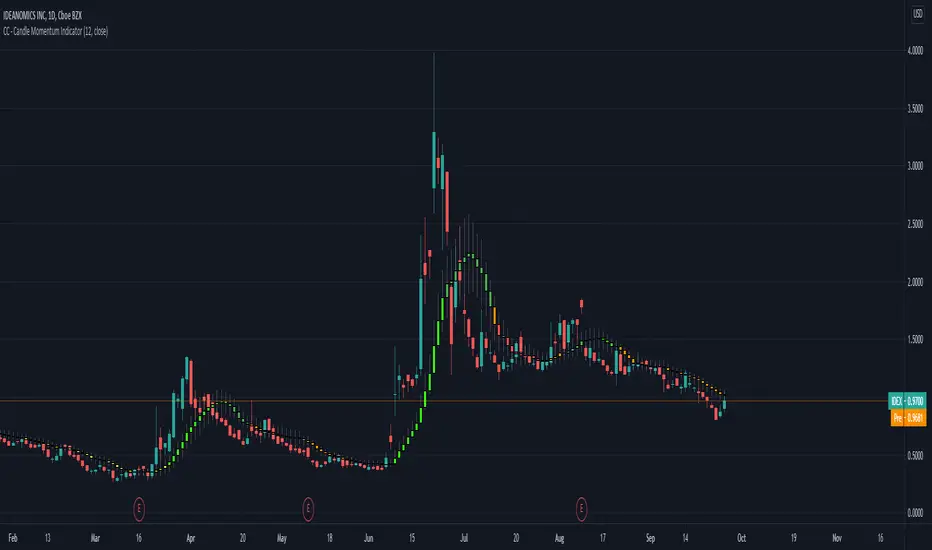
CC - Candle Momentum IndicatorA simple VWAP and SMA smoothing on the candles along with some momentum coloring. Basically, if the "slider" is slid all the way up and it turns red, moving down or losing volume t's probably going down. If it's all the way down and starts turning green, getting bigger and seeing volume, it's probably going up. this is a prototype indicator that I plan to extend using arrays and averages if it is seen as something useful.
Candle-BB-MovesToday I propose a simple indicator to get an idea of market sentiment
Color distinctions are as follows
-White background = Bollinger Band Squeezed
-Purple columns = Total candle length wick to wick
-Lime columns = Green candle body length
-Red columns = Red candle body length
-Yellow columns = Wick to wick size higher than the previous candle by defined %, this si changeable in setting, default value 1.5%
-Lime "-" = Price above Bollinger Band basis
-Red "-" = Price bellow Bollinger Band basis
-Lime "_" = Price above Bollinger Band upper level
-Red "_" = Price below Bollinger Band lower level
As one can tell, this indicator is good at identifying trending and squeezed areas of price action. It can also give you early hint at unusual price movements and if you can get this bias then it is easier to take trade
Please note that this indicator is not meant to trade independently and would work best with combinations of S/R.
Past performance does not indicate future success, this is meant to be an educational purpose only and the author takes no responsibility of your profit or loss.

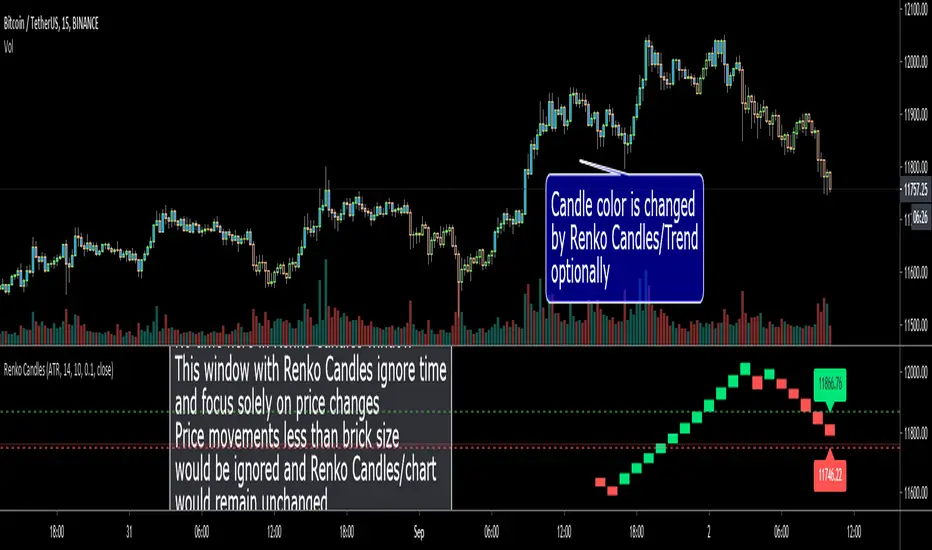
Renko CandlesHello Traders!
This scripts draws Renko Candles in a seperate window dynamically and live. it shows only last 20 Renko candles. there is no time in that window, that means this window with Renko candles ignore time and focus solely on price changes. For Example If the brick value is set at 10 points, a move of 10 points or more is required to draw another brick. Price movements less than 10 points would be ignored and the Renko chart would remain unchanged. If you don't know what Renko Chart/Candle is then you should read some articles about it ;)
"Method" in the option is same as in Renko Chart, two methods: "Traditional" or "ATR ". default value is ATR
if you choose Traditional method then you need to set brick size accordingly. Increasing or decreasing the box size will affect the "smoothness" of the chart.
if you choose ATR mode then brick size will be set by using Average True Range(ATR) indicator
You have option to use Closing Price or High/Low. by default it's "Close"
Optionally it can change candle colors by Renko Bricks/Trend
Optionally it can show the levels for new bricks.
in this example, Mode = Traditional and Brick size: 10
in this example, Mode = Traditional and Brick size: 50
in this example Mode = ATR
Do not forget to click "Donate" button ;)
Enjoy!
renko candle strategy(lirshah)Renko candles strategy has been written based on renko box plots.
the strategy plots renko boxes and levels for trading,
the buy signals trigger when renko is on uptrend and hit the lower box border and similar scenario for sell signal.
the standard parameter are as bellow:
box size: 3.5$
take profit: 1000 pip
stop loss: 200 pip
the below overview is results of strategy on 1sec chart(normal candle) of Nasdaq index, with 1 contract and 0.5 $ commission per order during New york session.
in order to access scripts contact me directly.

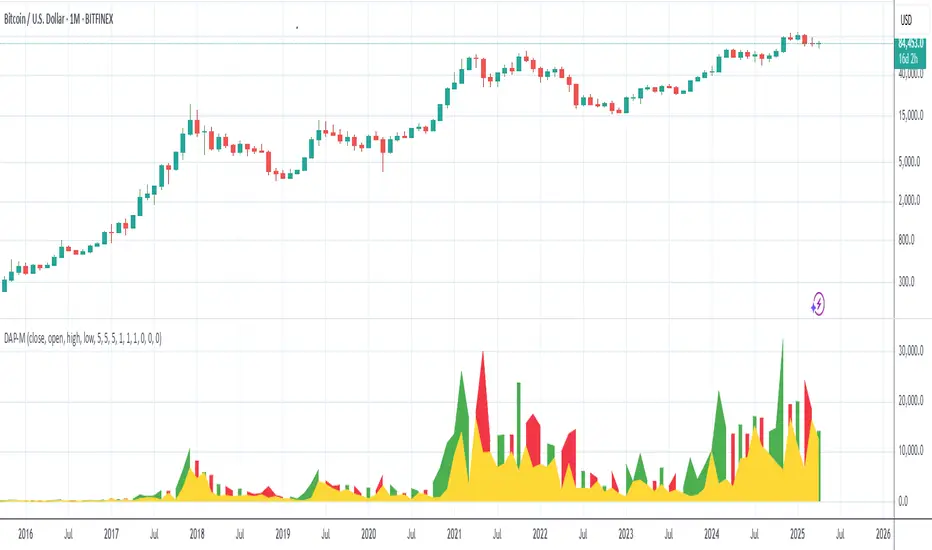
Doubts and Price MovesPrice movement indicator
Useful for indicating high/low levels of price movement
Red - when close is below the open(the actual move)
Yellow - hesitance
Green - when close is above the open(the actual move)
* Highly recommended to set transparency to 50% to all columns when combined is Off(unchecked); 0% otherwise
Candlestick Pattern IdentifierMy script builds upon another user-submitted script by rebuilding the logic used to identify candlestick patterns. The logic in my script is a mix of strict and lax guidelines to mitigate false flags and present valid buy and sell signals.
-To use this indicator, simply add it to any chart. It will identify trends on any time frame although the lower you go, the more signals you'll see and the higher probability of those signals being false flags. You can also disable any candlestick patterns that you feel are not as useful.
- This indicator works best with Stocks and also with Forex markets to a lesser extent.
- This indicator works the best on the Daily chart and also works (with varying degrees of success) on any timeframe at or above 1 hour. I've found that this indicator works the best when used in tandem with the Daily and Hourly charts with the Hourly chart being used to determine an entry point while the Daily chart is used for long term trend analysis.

BoredWoreders GUIDED LIGHTSHello BoredWorkers here.
We've been on a journey to create the most perfectly simple indicator for newbies to profit NO MATTER WHAT and we're ending our journey successfully here soon.
So we will be releasing indicators, apart of or, that were a part of our journey.
The guided lights indicator is a favorite.
This indicator is simple. It displays the current power any candle you're currently watching. No matter the time frame. It only displays strong signals.
Example - You've jumped in a daily trade setup. While watching the daily candle the guided lights indicator will light up the colors of a traffic light.
The green light will display when the candle is in a strong up push.
The yellow light will display when the candle up push is weakening or is weak.
The yellow light will display when the candle down push is weakening or is weak.
The red light will display when the candle is in a strong down push.
- Arrows are added to the yellow lights to help you determine candle directions.
- If the light is lit and turns off. That only means its stop pushing but its not a reversal back to when it lit. New support or new resistance unless the colors say otherwise.
Have fun! We enjoyed it. Latch it directly under your chart. And watch the magic!
PS Unless you're more experienced don't trade during no light phase.
