Antigravity OCC Strategy (MA 5 + Delayed TSL)# OCC Strategy Optimized (MA 5 + Delayed TSL) - User Guide
## Introduction
The **OCC Strategy Optimized** is an enhanced version of the classic **Open Close Cross (OCC)** strategy. This strategy is designed for high-precision trend following, utilizing the crossover logic of Open and Close moving averages to identify market shifts. This optimized version incorporates advanced risk management, multi-timeframe analysis, and a variety of moving average types to provide a robust trading solution for modern markets.
>
> **Special Thanks:** This strategy is based on the original work of **JustUncleL**, a renowned Pine Script developer. You can find their work and profile on TradingView here: (in.tradingview.com).
---
## Key Features
### 1. Optimized Core Logic
- **MA Period (Default: 5):** The strategy is tuned with a shorter MA length to reduce lag and capture trends earlier.
- **Crossing Logic:** Signals are generated when the Moving Average of the **Close** crosses the Moving Average of the **Open**.
### 2. Multi-Timeframe (MTF) Analysis
- **Alternate Resolution:** Use a higher timeframe (Resolution Multiplier) to filter out noise. By default, it uses $3 \times$ your current chart timeframe to confirm the trend.
- **Non-Repainting:** Includes an optional delay offset to ensure signals are confirmed and do not disappear (repaint) after the bar closes.
### 3. Advanced Risk Management
This script features a hierarchical exit system to protect your capital and lock in profits:
- **Fixed Stop Loss (Initial):** Protects against sudden market reversals immediately after entry.
- **Delayed Trailing Stop Loss (TSL):**
- **Activation Delay:** The TSL only activates after the trade reaches a specific profit threshold (e.g., 1%). This prevents being stopped out too early in the trade's development.
- **Ratchet Trail:** Once activated, the stop loss "ratchets" up/down, never moving backward, ensuring you lock in profits as the trend continues.
- **Take Profit (TP):** A fixed percentage target to exit the trade at a pre-defined profit level.
### 4. Versatility
- **12 MA Types:** Choose from SMA, EMA, DEMA, TEMA, WMA, VWMA, SMMA, HullMA, LSMA, ALMA, SSMA, and TMA.
- **Trade Direction:** Toggle between Long-only, Short-only, or Both.
- **Visuals:** Optional bar coloring to visualize the trend directly on the candlesticks.
---
## User Input Guide
### Core Settings
- **Use Alternate Resolution?:** Enable this to use the MTF logic.
- **Multiplier for Alternate Resolution:** How many charts higher the "filter" timeframe should be.
- **MA Type:** Select your preferred moving average smoothing method.
- **MA Period:** The length of the Open/Close averages.
- **Delay Open/Close MA:** Use `1` or higher to force non-repainting behavior.
### Risk Management Settings
- **Use Trailing Stop Loss?:** Enables the TSL system.
- **Trailing Stop %:** The distance the stop follows behind the price.
- **TSL Activation % (Delay):** The profit % required before the TSL starts moving.
- **Initial Fixed Stop Loss %:** Your hard stop if the trade immediately goes against you.
- **Take Profit %:** Your ultimate profit target for the trade.
---
## How to Trade with This Strategy
1. **Identify the Trend:** Look for the Moving Average lines (Close vs Open) to cross.
2. **Wait for Confirmation:** If using MTF, ensure the higher timeframe also shows a trend change.
3. **Manage the Trade:** Let the TSL work. Once the trade hits the activation threshold, the TSL will take over, protecting your runner.
4. **Position Sizing:** Adjust the `Properties` tab in the script settings to match your desired capital allocation (Default is 10% of equity).
---
## Credits
Original Strategy by: **JustUncleL**
Optimized and Enhanced by: **Antigravity AI**
Candlestick analysis

Heikin Ashi Color Flip StrategyManual HA calculation → no repainting
✔ Entry on first green after red
✔ Exit on first red after green
✔ process_orders_on_close = false → orders execute on next bar open
✔ Logic is clean and readable
How to make it your kind of strategy (next step)
Given your past preferences, the best upgrade is:
• Trade only when price > EMA 21
• Or only when SPY > EMA 50 & VIX < 20
• Exit on price close below EMA 21 (your preferred rule)
Consider the following to increase win rate and decrease drawdown:
• Add EMA-21 exit instead of HA red
• Add SPY/VIX regime filter
• Give you real QQQ daily backtest metrics
• Convert this into a scan/alert-only indicator
Disclaimer:
This indicator is provided for educational and informational purposes only and does not constitute financial, investment, or trading advice. The signals generated by this indicator are not guaranteed to be accurate or profitable. Past performance is not indicative of future results. Trading and investing involve substantial risk, and you should perform your own analysis and consult a qualified financial professional before making any trading decisions. The author is not responsible for any financial losses incurred from the use of this indicator.

Trend Pulse Channel StrategyOverview
Trend Pulse Channel Strategy is a long-only trend-following breakout strategy built around an adaptive multi-pole smoothing filter and a volatility-adjusted price channel.
The strategy is designed to participate in sustained directional moves by entering only when price confirms momentum strength beyond a dynamic upper boundary, while avoiding mean-reversion and low-quality consolidation phases.
This script is published as a strategy and includes realistic backtesting assumptions for position sizing, commissions, and slippage.
Core Concept
At the heart of the strategy is a multi-pole adaptive EMA-based filter, inspired by advanced digital signal smoothing techniques.
Using multiple poles allows the filter to reduce noise while preserving responsiveness to genuine trend changes.
To adapt the channel width to changing market conditions, the strategy applies the same filtering logic to True Range, producing a volatility-aware envelope rather than a static or fixed-percentage band.
This combination allows the strategy to:
Track directional bias using a smoothed central filter
Adjust channel width dynamically based on market volatility
Trigger entries only when price expansion confirms trend strength
Entry Logic
A long position is opened when:
Price crosses above the upper channel band
The signal occurs within the user-defined date range
This condition represents a volatility-confirmed breakout aligned with the prevailing directional filter.
Exit Logic
The long position is closed when:
Price crosses back below the upper band
This exit logic aims to stay in trending moves while exiting when upside momentum weakens.
The strategy does not open short positions by design.
Inputs and Defaults
The default inputs are selected to balance smoothness, responsiveness, and stability:
Source (HLC3): Reduces single-price noise by averaging high, low, and close
Period (144): Defines the primary smoothing horizon of the adaptive filter
Poles (4): Controls the smoothness vs. responsiveness trade-off
Range Multiplier (1.414): Scales the volatility envelope using filtered True Range
Reduced Lag (optional): Applies lag compensation to improve responsiveness
Fast Response (optional): Blends multi-pole and single-pole filters for quicker reaction at the cost of smoothness
All inputs are fully configurable and can be adjusted to suit different instruments and timeframes.
Risk Management & Position Sizing
The strategy uses:
Position size: 10% of equity per trade
No pyramiding
Long positions only
This sizing approach is intended to reflect sustainable risk exposure rather than aggressive capital deployment. Users may further adjust position size based on their own risk tolerance.
Backtesting Assumptions
The strategy is tested using :
Initial capital: 10,000
Commission: 0.1%
Slippage: 1 tick
Order fill model: Standard OHLC
These settings are chosen to provide more realistic performance estimates compared to idealized backtests.
This strategy is best suited for :
Trend-oriented markets
Higher timeframes where breakouts are more reliable
Users seeking systematic trend participation rather than frequent scalping
In sideways or range-bound market conditions, price may cross the channel boundaries frequently.
This can result in a higher number of entry and exit signals that do not develop into sustained trends.
For this reason, the strategy should be used with an understanding of basic technical analysis concepts, including market structure, trend identification, and consolidation behavior.
It is intended as a decision-support tool, not a standalone trading system.
Users—whether beginners or experienced traders—should avoid relying solely on this strategy and are encouraged to combine it with broader market context and additional analysis methods.
Disclaimer
This script is provided for educational and analytical purposes only. It does not constitute financial advice. Past performance does not guarantee future results.

ML Adaptive SuperTrend Strategy [trade_crush]# ML Adaptive SuperTrend Strategy - User Guide
## Introduction
The **ML Adaptive SuperTrend Strategy** is a sophisticated trading tool that combines traditional trend-following logic with **Machine Learning (K-Means Clustering)** to dynamically adapt to market volatility. Unlike standard SuperTrend indicators that use a fixed ATR, this strategy analyzes historical volatility to categorize the current market into distinct clusters, providing more precise entries and exits.
>
> **Special Thanks:** This strategy is based on the innovative work of **AlgoAlpha**. You can explore their extensive library of high-quality indicators and strategies on TradingView: (www.tradingview.com).
---
## Machine Learning Engine (K-Means)
The core of this strategy is its ability to "learn" from recent market behavior.
- **K-Means Clustering**: The script takes the last $N$ bars of ATR data and runs an iterative clustering algorithm to find three "centroids" representing **High**, **Medium**, and **Low** volatility.
- **Adaptive ATR**: Based on the current volatility, the strategy selects the nearest centroid to use as the ATR value for the SuperTrend calculation. This ensures the trailing stop tightens during low volatility and widens during high volatility to avoid "noise".
---
## Key Features
### 1. Non-Repainting Signals
- **Confirm Signals**: When enabled, signals are only triggered after a bar closes. This ensures that the arrows and entries you see on the chart are permanent and reliable for backtesting.
### 2. Intelligent Risk Management
- **Multiple SL/TP Types**: Choose between **Percentage** based stops or **ATR** based stops for both Stop Loss and Take Profit.
- **Trailing Stop Loss (TSL)**:
- Supports both Percentage and ATR modes.
- **Activation Offset**: Only activates the trailing mechanism after the price has moved a certain percentage in your favor, protecting early-stage trades.
### 3. Risk-Based Position Sizing
- **Dynamic Quantity**: If enabled, the strategy automatically calculates the trade size based on your **Risk % Per Trade** and the distance to your **Stop Loss**. This ensures you never lose more than your defined risk on a single trade.
---
## User Input Guide
### SuperTrend & ML Settings
- **ATR Length**: The window used to calculate market volatility.
- **SuperTrend Factor**: The multiplier that determines the distance of the trailing stop from the price.
- **Use ML Adaptive ATR**: Toggle between the ML-enhanced logic and standard ATR.
- **Training Data Length**: How many historical bars the ML engine analyzes to find clusters.
### Risk Management
- **Stop Loss Type**: Set to Percentage, ATR, or None.
- **TS Activation Offset**: The profit buffer required before the trailing stop starts following the price.
- **Use Risk-Based Sizing**: Toggle this to let the script manage your position size automatically.
---
## How to Trade with This Strategy
1. **Monitor the Dashboard**: Check the top-right table to see which volatility cluster the market is currently in.
2. **Observe the Fills**: The adaptive fills (green/red) visualize the "breathing room" the strategy is giving the price.
3. **Execution**: The strategy enters on "ML Bullish" (Triangle Up) and "ML Bearish" (Triangle Down) signals.
4. **Exits**: The script will automatically exit based on your SL, TP, or Trailing Stop settings.
---
## Credits
Original Concept: **AlgoAlpha**
Strategy Conversion & Enhancements: **Antigravity AI**


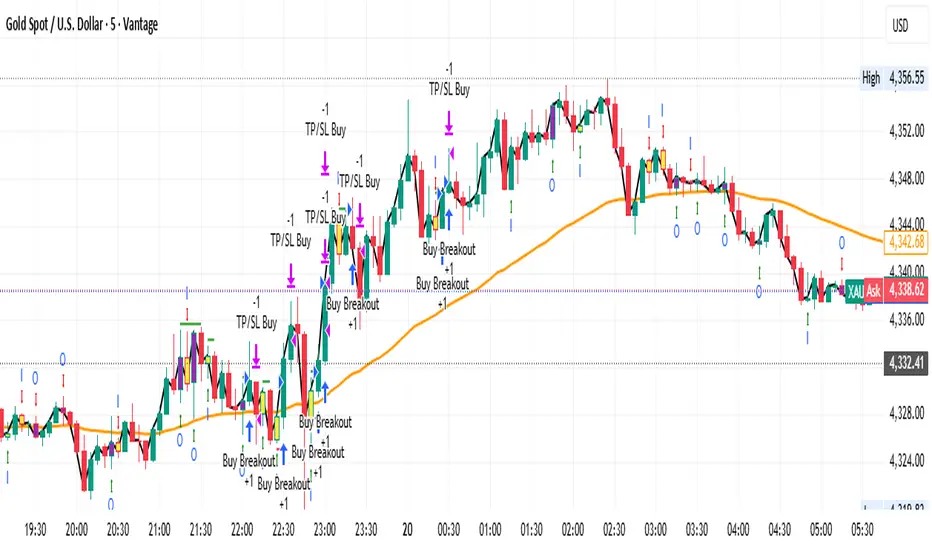
Gold M5 Scalping (Strategy)This is the New Strategy for my new Indicator for M5 Scalping.
Just to test my result.
Will release my indicator soon

Supertrend + EMA + RSI Algo (Low Risk High Accuracy)This is a trend-following + momentum confirmation strategy designed to reduce false signals and control loss.
Supertrend (10,3) → Identifies overall market direction (Buy in uptrend, Sell in downtrend)
EMA 50 & EMA 200 → Confirms strong trend and avoids sideways market
Buy only when EMA 50 is above EMA 200
Sell only when EMA 50 is below EMA 200
RSI (14) → Confirms momentum
Buy when RSI > 55 (strong bullish momentum)
Sell when RSI < 45 (strong bearish momentum)
---
🔹 Entry Logic
BUY: Market is in uptrend + strong momentum
SELL: Market is in downtrend + strong bearish pressure
---
🔹 Risk Management (Most Important)
Stop Loss: Based on ATR (adapts to volatility)
Target: Fixed Risk-Reward ratio (example: 1 : 2.5)
This keeps loss small and profits larger
---
🔹 Best Use Case
Works best in trending markets
Ideal timeframes: 15m, 1h, 4h
Suitable for crypto futures & swing trading
Beginner-friendly if used with low leverage

Gold Smart Scalper AI V21. The "Red Zone" (News Management)
The strategy logic does not "know" when the Federal Reserve is speaking.
Rule: Disable the strategy or stop taking signals 15 minutes before and after high-impact news (CPI, NFP, FOMC).
Why: During these times, Gold can move $30 in seconds. Slippage will cause your $1.50 Stop Loss to execute much further away, leading to massive drawdown.
2. Session Selection
Gold "Scalping" requires high liquidity and tight spreads.
Discretionary Filter: Only trade during the London/New York overlap (13:00 – 17:00 UTC).
Avoid: The late Asian session or Sunday market open. Spreads often widen to $0.50–$1.00, meaning you are already down 30-50% of your Stop Loss the moment you enter.
3. Market "Mood" (Trend vs. Range)
Trend Context: If the 50 EMA (the White line) is completely flat, the market is in a "Bracket." In this state, EMA crossovers generate many false signals.
The Adjustment: Discretionary traders wait for the 50 EMA to show a clear slope (up or down) before trusting the 9/21 crossover signals.

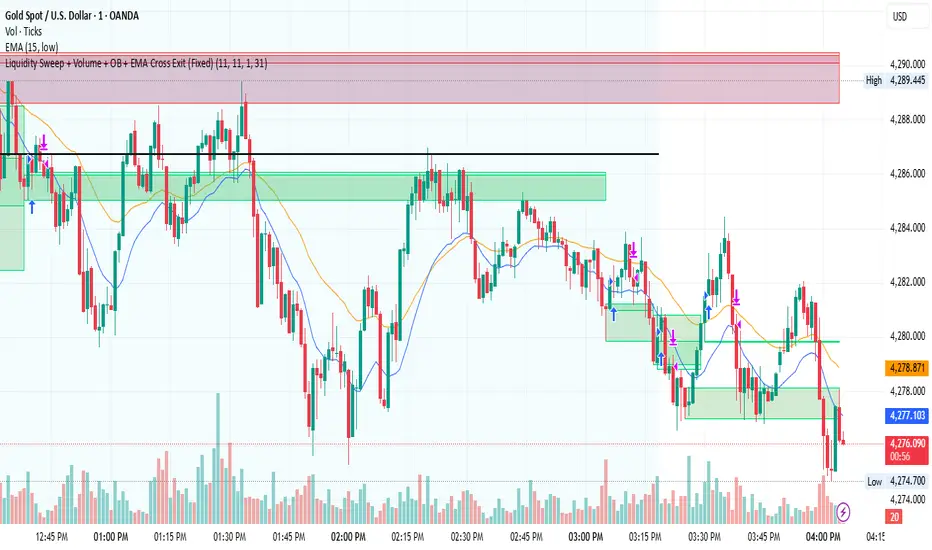
Liquidity Sweep + Volume + OB + EMA Cross Exit This strategy is a smart-money–inspired trading system designed to capture high-probability reversals after liquidity is taken from the market.
It combines liquidity sweeps, volume confirmation, order block validation, and a dynamic EMA-based exit to control risk and let profits run.
Core Concept
Institutions first take liquidity, then move price in the real direction.
This strategy aims to enter after liquidity is swept and price shows confirmation.
1️⃣ Liquidity Sweep Detection
2️⃣ Volume Confirmation
3️⃣ Order Block Identification
4️⃣ EMA Trend Filter (Optional Entry Bias)
5️⃣ Trade Entry Logic
6️⃣ Exit Strategy – EMA Cross Exit
Benefits:
Lets strong trends run
Exits automatically when momentum weakens
Adapts to different market conditions
🛡 Risk & Trade Management
One trade at a time (anti-overtrading logic)
Early exit if trade moves against position after a few bars
Opposite signal forces exit
EMA cross provides trend-based exit
GOLD 5m PA ScalperXAUUSD 5-Minute Price Action Scalper with HTF Confirmation
This Pine Script is a trend-following scalping strategy designed specifically for XAUUSD (Gold) on the 1,3,5-minute timeframe.
Its main goal is to reduce noise and false signals by combining lower-timeframe price action with higher-timeframe (15-minute) structure.
CORE IDEA
Trade only in the direction of the dominant trend and only when price reacts from a strong higher-timeframe Order Block.

Improved Candle Strategy (without daily squared)# Candle Pattern Trading Strategy
## Core Logic
Analyzes the last 5 candlesticks to identify "close at high" and "close at low" patterns, generating long/short signals.
## Trading Conditions
- **Long**: ≥2 bars closed at high in past 5 bars + current bar closes at high → Open long
- **Short**: ≥2 bars closed at low in past 5 bars + current bar closes at low → Open short
- **Filter**: If ≥3 doji patterns detected, skip trading
## Risk Management
- Stop Loss: Based on entry bar's high/low
- Take Profit: Risk × 2x multiplier
- Cooldown: No trading for 2 bars after entry
- Session Filter: No trading for first 5 bars after market open
## Configurable Parameters
- Lookback period, doji threshold, close proximity ratio, TP/SL ratio, cooldown bars, etc.
**Use Cases**: 1-minute and higher timeframes on stocks/futures

Wavelet Candlestick Slope Follower-Master Edition Here is a short description of this script:
This is a **Trend Following strategy** that utilizes advanced mathematics—the **Wavelet Transform**—to filter out market noise.
**Key Features:**
1. **Synthetic Candles:** The script does not analyze raw prices. Instead, it constructs "Wavelet Candles"—smoothed candles created through mathematical convolution of prices with a specific wavelet "kernel" (e.g., Mexican Hat, Morlet, Haar).
2. **Auto-Correction (Normalization):** This is the most critical technical feature of this code. The script automatically normalizes the weights. This ensures that even when using complex mathematical shapes (like the Mexican Hat), the output price remains accurate to the real chart scale and is not distorted.
3. **Strategy Logic:** The logic is very straightforward—the system enters a **Long** position when the smoothed closing price (`w_close`) is rising, and closes the position when it starts to fall.
4. **Visualization:** It draws new, cleaner candles (green/red) on the chart, revealing the "true" trend structure after filtering out temporary fluctuations.
This is a example of use idea of wavelet candle

EMA 5/9 Angle + Candle Strength (SL=Open, TP=RR)EMA 5 / EMA 9 cross
Cross must have ~30° angle (approximated using slope → atan)
Entry candle must be bullish/bearish and also be Normal / 2nd Most / Most based on body-size percentile
Entry = close of signal candle
SL = open of signal candle
TP = 1:2 RR (editable input)

Institutional Execution Engine v3 [Nishith Rajwar]
Institutional Execution Engine v3
Market-Structure-Driven Execution Framework (Indicator + Strategy Hybrid)
The **Institutional Execution Engine v3** is a professional-grade execution framework designed to model **how institutional participants interact with liquidity, volatility regimes, and market structure**.
It is built for **index traders, crypto traders, and systematic intraday participants** who require **non-repainting, forward-validated signals** with strict risk control.
This is **not a mashup of indicators**.
Every module is purpose-built and interacts through a unified execution pipeline.
---
🔍 Core Concepts & Methodology
1️⃣ Market Structure & POI Engine
* Identifies **Points of Interest (POIs)** using swing structure, volatility context, and liquidity positioning
* POIs are **confirmed only after bar close** (strict non-repaint enforcement)
* Adaptive pivot sensitivity based on selected execution preset
2️⃣ Liquidity-Aware Scoring System
Each potential trade is filtered through a **multi-factor execution score**, including:
* Structural alignment
* Volatility normalization (ATR regime)
* Liquidity reaction quality
* Directional efficiency
Trades are only allowed when the **minimum institutional score threshold** is met.
3️⃣ Regime Detection (Forward-Walk Safe)
The engine dynamically classifies market conditions into execution regimes:
* Trending
* Rotational
* Mean-reverting
Regime detection is **forward-walk compatible** and does **not leak future data**.
4️⃣ Risk-First Execution Model
* ATR-normalized stop placement
* R-multiple-based take-profit targeting
* Optional **single-trade-per-session guard**
* Strategy engine includes **open-trade protection** to prevent over-execution
5️⃣ Strategy + Indicator Hybrid
This script can be used in **two ways**:
* **Indicator mode** → discretionary execution with visual POIs, signals, and context
* **Strategy mode** → systematic backtesting with full TradingView Strategy Tester support
Both modes share the **same execution logic** (no divergence).
---
⚙️ Preset-Driven Architecture
Built-in execution presets auto-configure internal parameters without changing core logic:
* **Scalp (Index)**
* **Daytrade (Index)**
* **Crypto Intraday**
* **Institutional Research (FWalk)**
Presets adjust pivot sensitivity, score thresholds, ATR behavior, and risk profile — while preserving execution integrity.
---
## 🚫 Non-Repainting & Data Integrity
* No look-ahead bias
* No future bar references
* No repainting signals
* VWAP and regime logic reset correctly per session
* Safe handling of strategy.opentrades to avoid execution errors
All signals are **bar-close confirmed**.
---
📊 Who This Is For
✔ Index traders (NIFTY / BANKNIFTY / SENSEX)
✔ Crypto intraday traders
✔ Systematic traders validating execution logic
✔ Traders who value **structure + liquidity + risk discipline** over indicators
---
⚠️ Disclaimer
This script is a **research and execution framework**, not financial advice.
Always forward-test and adapt risk parameters to your instrument and timeframe.
---
**Author:** Nishith Rajwar
**Version:** v3
**Execution Philosophy:** Trade where institutions execute — not where indicators react.

ARVEXV1“Failed Reversal – Opposite Candle Only (No Doji/Hammer/Hanging Man)”:
This strategy captures failed reversal attempts where the current candle is opposite to the previous candle and volume is higher. It enters long if a bearish candle fails to break a previous bullish candle’s low, and short if a bullish candle fails to break a previous bearish candle’s high. Signals are canceled for Doji, Hammer, or Hanging Man candles. Entries only, fully backtestable.

ARVEX V1“Failed Reversal – Opposite Candle Only (No Doji/Hammer/Hanging Man)”:
This strategy captures failed reversal attempts where the current candle is opposite to the previous candle and volume is higher. It enters long if a bearish candle fails to break a previous bullish candle’s low, and short if a bullish candle fails to break a previous bearish candle’s high. Signals are canceled for Doji, Hammer, or Hanging Man candles. Entries only, fully backtestable.

Ribbon Cross Strategy This strategy uses a simple moving-average ribbon crossover system with a customizable entry filter. You can choose whether trades trigger near the fast or slow average, allowing flexibility in capturing early or confirmed trend moves.
It’s best suited for index trading on intraday timeframes , helping identify short-term trend reversals and continuations with clear visual cues and backtestable logic.

Smart Money Bot [MTF Confluence Edition]Uses multi-time frame analysis and supply and demand strategy.
Best used when swing trading.

Crypto LONG PYThis trading approach is a powerful combination of technical tools aimed at taking advantage of market fluctuations with precision and reliability. By integrating Bollinger Bands (BB), the Relative Strength Index (RSI), Exponential Moving Averages (EMA), and Fibonacci retracement levels (Fib), we create a strategy that captures key market moves and helps identify optimal entry and exit points, all within the context of the New York market conditions (NY).
Bollinger Bands provide insight into market volatility, offering signals about potential extreme price movements. The RSI is used to measure momentum and assess overbought or oversold conditions, indicating when the market might be nearing a reversal. Meanwhile, EMAs add a layer of smoothing, allowing us to observe short- and medium-term trends, helping filter out false signals and providing a clearer view of the overall market direction.
Additionally, Fibonacci retracements are integrated to identify key support and resistance levels, pinpointing potential areas of price retracement and continuation. When combined, these indicators offer a holistic approach to navigating the markets, enabling traders to make data-driven, informed decisions.
This approach is ideal for traders looking for a meticulous methodology for trading during the NY session, where liquidity and volatility tend to be at their highest. Leverage the synergy between these indicators to optimize your trading strategy and maximize your market performance.

Simple ICT Sweep + FVG (LuxAlgo Swings FIXED)something i created if anyone can improve it or change for better visual

Hammer Strategy (CLOSE ON NEXT BAR) [WORKING]Adjustable hammer and inverted hammer candle
Ham? INV? is the hammer
Entry on HAM, INV OR HAM?, INV? close next bar

Multi-MA + RSI Pullback Strategy (Jordan)1️⃣ Strategy logic I’ll code
From your screenshots:
Indicators
• EMAs: 600 / 200 / 100 / 50
• RSI: length 6, levels 80 / 20
Rules (simplified so a script can handle them):
• Use a higher-timeframe trend filter (15m or 1h) using the EMAs.
• Take entries on the chart timeframe (you can use 1m or 5m).
• Long:
• Higher-TF trend is up.
• Price is pulling back into a zone (between 50 EMA and 100 EMA on the entry timeframe – this approximates your 50–61% retrace).
• RSI crosses below 20 (oversold).
• Short:
• Higher-TF trend is down.
• Price pulls back between 50 & 100 EMAs.
• RSI crosses above 80 (overbought).
• Exits: ATR-based stop + take-profit with adjustable R:R (2:1 or 3:1).
• Max 4 trades per day.
News filter & “only trade gold” you handle manually (run it on XAUUSD and avoid news times yourself – TradingView can’t read the economic calendar from code).
