Liquidity Sweep + BOS Retest System — Prop Firm Edition🟦 Liquidity Sweep + BOS Retest System — Prop Firm Edition
A High-Probability Smart Money Strategy Built for NQ, ES, and Funding Accounts
🚀 Overview
The Liquidity Sweep + BOS Retest System (Prop Firm Edition) is a precision-engineered SMC strategy built specifically for prop firm traders. It mirrors institutional liquidity behavior and combines it with strict account-safe entry rules to help traders pass and maintain funding accounts with consistency.
Unlike typical indicators, this system waits for three confirmations — liquidity sweep, displacement, and a clean retest — before executing any trade. Every component is optimized for low drawdown, high R:R, and prop-firm-approved risk management.
Whether you’re trading Apex, TakeProfitTrader, FFF, or OneUp Trader, this system gives you a powerful mechanical framework that keeps you within rules while identifying the market’s highest-probability reversal zones.
🔥 Key Features
1. Liquidity Sweep Detection (Stop Hunt Logic)
Automatically identifies when price clears a previous swing high/low with a sweep confirmation candle.
✔ Filters noise
✔ Eliminates early entries
✔ Locks onto true liquidity grabs
2. Automatic Break of Structure (BOS) Confirmation
Price must show true displacement by breaking structure opposite the sweep direction.
✔ Confirms momentum shift
✔ Removes fake reversals
✔ Ensures institutional intent
3. Precision Retest Entry Model
The strategy enters only when price retests the BOS level at premium/discount pricing.
✔ Zero chasing
✔ Extremely tight stop loss placement
✔ Prop-firm-friendly controlled risk
4. Built-In Risk & Trade Management
SL set at swept liquidity
TP set by user-defined R:R multiplier
Optional session filter (NY Open by default)
One trade at a time (no pyramiding)
Automatically resets logic after each trade
This prevents overtrading — the #1 cause of evaluation and account breaches.
5. Designed for Prop Firm Futures Trading
This script is optimized for:
Trailing/static drawdown accounts
Micro contract precision
Funding evaluations
Low-risk, high-probability setups
Structured, rule-based execution
It reduces randomness and emotional trading by automating the highest-quality SMC sequence.
🎯 The Trading Model Behind the System
Step 1 — Liquidity Sweep
Price must take out a recent high/low and close back inside structure.
This confirms stop-hunting behavior and marks the beginning of a potential reversal.
Step 2 — BOS (Break of Structure)
Price must break the opposite side swing with a displacement candle. This validates a directional shift.
Step 3 — Retest Entry
The system waits for price to retrace into the BOS level and signal continuation.
This creates optimal R:R entry with minimal drawdown.
📈 Best Markets
NQ (NASDAQ Futures) – Highly recommended
ES, YM, RTY
Gold (XAUUSD)
FX majors
Crypto (with high volatility)
Works best on 1m, 2m, 5m, or 15m depending on your trading style.
🧠 Why Traders Love This System
✔ No signals until all confirmations align
✔ Reduces overtrading and emotional decisions
✔ Follows market structure instead of random indicators
✔ Perfect for maintaining long-term funded accounts
✔ Built around institutional-grade concepts
✔ Makes your trading consistent, calm, and rules-based
⚙️ Recommended Settings
Session: 06:30–08:00 MST (NY Open)
R:R: 1.5R – 3R
Contracts: Start with 1–2 micros
Markets: NQ for best structure & volume
📦 What’s Included
Complete strategy logic
All plots, labels, sweep markers & BOS alerts
BOS retest entry automation
Session filtering
Stop loss & take profit system
Full SMC logic pipeline
🏁 Summary
The Liquidity Sweep + BOS Retest System is a complete, prop-firm-ready, structure-based strategy that automates one of the cleanest and most reliable SMC entry models. It is designed to keep you safe, consistent, and rule-compliant while capturing premium institutional setups.
If you want to trade with confidence, discipline, and prop-firm precision — this system is for you.
Good Luck -BG
Candlestick analysis

Freedom Candlestick v5.1.55 1 Alerts?Trend following futures scalping strategy. Highly complex and not beginner friendly.


XiaoJiu_RSI_5m_Drop1_DCA✔ Automatic buy when RSI < 30
✔ Automatic averaging down for every 1 point drop in RSI (maximum 21 times)
✔ Automatic liquidation when RSI > 70
✔ 28U per average averaging down
✔ Automatically calculates weighted average cost
✔ Automatically displays actual profit
✔ Can be tested on any coin and at any time
✔ Complete DCA model

ETH SuperTrend Hull Strategy - 15min Futures(重制版)🟠 ETH SuperTrend Hull Strategy - 15min Futures
Strategy Overview
The "ETH SuperTrend Hull Strategy" is a sophisticated 15-minute trading system specifically designed for Bitcoin perpetual contracts. This advanced algorithm integrates SuperTrend indicators with Hull moving averages to deliver high-precision trend following through a triple-confirmation mechanism, featuring intelligent position management and multi-level take-profit systems.
Core Value Proposition
Triple Trend Confirmation: SuperTrend + Hull MA + ATR volatility filtering
Adaptive Take-Profit System: 6-level dynamic profit targets adjusted to market conditions
Smart Position Management: Three martingale modes with automatic sizing
Real-time Webhook Integration: Direct exchange connectivity for automated execution
🟠 Technical Framework
Multi-Layer Trend Detection
Layer 1 - SuperTrend Filter
pinescript
= ta.supertrend(supertrend_factor, supertrend_atr_period)
is_supertrend_long = direction < 0 // Bullish trend line
is_supertrend_short = direction >= 0 // Bearish trend line
Layer 2 - Hull MA Confirmation
pinescript
HMA = HMA(close, 73) // Hull Moving Average
hull_is_green = HULL > HULL // Uptrend confirmation
hull_is_red = HULL <= HULL // Downtrend confirmation
Layer 3 - ATR Breakout Signals
pinescript
xATR = ta.atr(5)
nLoss = key_value * xATR // Dynamic stop distance
Entry Conditions
Long Entry:
Price breaks above ATR trailing stop
Hull MA shows green uptrend
SuperTrend indicates bullish momentum
Price positioned above Hull MA
Short Entry:
Price breaks below ATR trailing stop
Hull MA shows red downtrend
SuperTrend indicates bearish momentum
Price positioned below Hull MA
🟠 Risk Management System
Position Sizing
text
Base Position = Initial Capital × Risk % / Entry Price × Leverage
Actual Position = Base Position × Martingale Multiplier (1.0-5.0x)
Martingale Modes
4x Mode: Conservative approach, maximum 4x position scaling
5x Mode: Balanced risk management, maximum 5x scaling
5x Big Mode: Aggressive growth with faster position increases
Dynamic Take-Profit System
6-Level Profit Targets:
TP1: 2.2×ATR (Close 30%)
TP2: 4.5×ATR (Close 25%)
TP3: 7.5×ATR (Close 20%)
TP4: 10.5×ATR (Close 10%)
TP5: 15.5×ATR (Close 7%)
TP6: 20.5×ATR (Close 3%)
ATR Adaptive Adjustment:
Short-term ATR > Long-term ATR: TP distance +0.5
Short-term ATR < Long-term ATR: TP distance -0.5
🟠 Configuration Parameters
Core Settings
pinescript
// Trend Sensitivity
key_value = 2.0 // ATR multiplier (lower = more sensitive)
supertrend_factor = 3.0 // SuperTrend factor
// Risk Management
risk_percent = 19.9 // Per trade risk %
leverage = 1.0 // Leverage multiplier
Hull MA Configuration
pinescript
length = 73 // Hull period (55-200)
modeSwitch = "Hma" // Hull variant (Hma/Thma/Ehma)
🟠 Quick Start Guide
Initial Setup
Apply to BTCUSDT perpetual 15-minute chart
Configure Webhook Signal ID and User ID
Adjust position parameters according to risk preference
Signal Monitoring
Long Signals: Green arrows with Hull MA turning green
Short Signals: Red arrows with Hull MA turning red
Trend Direction: SuperTrend line color changes
Execution Workflow
Wait for triple-signal confluence
Confirm all entry conditions met
System automatically calculates position size and TP levels
Webhook sends trade instructions to connected platform
Advanced Features
Heikin-Ashi Mode: Smooth price data using Heikin-Ashi candles
Fixed Position Mode: Disable martingale, use fixed sizing
Multi-Timeframe: Higher timeframe confirmation integration
🟠 ETH SuperTrend Hull Strategy - 15min Futures
策略概述
"ETH超级趋势Hull策略"是一款专为比特币永续合约设计的15分钟短线交易系统。该策略融合超级趋势指标与Hull均线,通过三重过滤机制实现高精度趋势跟踪,具备智能仓位管理和多级止盈体系。
核心价值
三重趋势确认:Supertrend + Hull均线 + ATR波动过滤
自适应止盈系统:6级动态止盈,根据市场波动调整目标
智能仓位管理:支持三种倍投模式,自动调整仓位规模
实时Webhook通知:直连交易平台,实现自动化执行
🟠 策略原理
趋势识别系统
第一层 - 超级趋势过滤
pinescript
= ta.supertrend(supertrend_factor, supertrend_atr_period)
is_supertrend_long = direction < 0 // 绿色趋势线
is_supertrend_short = direction >= 0 // 红色趋势线
第二层 - Hull均线确认
pinescript
HMA = HMA(close, 73) // Hull移动平均线
hull_is_green = HULL > HULL // 上升趋势
hull_is_red = HULL <= HULL // 下降趋势
第三层 - ATR突破信号
pinescript
xATR = ta.atr(5)
nLoss = key_value * xATR // 动态止损距离
入场条件
多头入场:
价格突破ATR追踪止损
Hull均线呈绿色上升趋势
超级趋势显示看涨信号
价格位于Hull均线上方
空头入场:
价格跌破ATR追踪止损
Hull均线呈红色下降趋势
超级趋势显示看跌信号
价格位于Hull均线下方
🟠 风险管理
仓位计算
text
基础仓位 = 初始资金 × 风险比例% / 入场价格 × 杠杆倍数
实际仓位 = 基础仓位 × 倍投系数 (1.0-5.0倍)
倍投模式
4倍模式:保守型,最大4倍加仓
5倍模式:均衡型,最大5倍加仓
5倍大模式:激进型,更快仓位增长
动态止盈系统
6级止盈目标:
TP1: 2.2×ATR (平仓30%)
TP2: 4.5×ATR (平仓25%)
TP3: 7.5×ATR (平仓20%)
TP4: 10.5×ATR (平仓10%)
TP5: 15.5×ATR (平仓7%)
TP6: 20.5×ATR (平仓3%)
ATR自适应调整:
短期ATR > 长期ATR:止盈距离+0.5
短期ATR < 长期ATR:止盈距离-0.5
🟠 参数配置
核心参数
pinescript
// 趋势敏感度
key_value = 2.0 // ATR乘数,值越小越敏感
supertrend_factor = 3.0 // 超级趋势因子
// 风险管理
risk_percent = 19.9 // 单次交易风险%
leverage = 1.0 // 杠杆倍数
Hull均线设置
pinescript
length = 73 // Hull周期 (55-200)
modeSwitch = "Hma" // Hull变体 (Hma/Thma/Ehma)
🟠 使用指南
初始设置
添加到BTCUSDT永续合约15分钟图表
配置Webhook信号ID和用户ID
根据风险偏好调整仓位参数
信号监控
多单信号:绿色箭头,Hull均线转绿
空单信号:红色箭头,Hull均线转红
趋势方向:超级趋势线颜色变化
执行流程
等待三重信号共振
确认入场条件满足
系统自动计算仓位和止盈
通过Webhook发送交易指令
高级功能
K线均线模式:使用Heikin-Ashi平滑价格
固定仓位模式:禁用倍投,固定仓位大小
多时间框架:集成更高时间框架确认

EMA VIP STRThis strategy works on EMAS and standard deviation on both sides , the tp is decided on RSI levels. the strategy is a systematic trading setup

Sunflower Quant - ETH 15min Strategy🟠 Sunflower Quant - ETH 15min Strategy
Strategy Overview
The " Sunflower Quant - ETH 15min Strategy" is a sophisticated automated trading system specifically designed for ETH/USDT on 15-minute timeframes. This advanced algorithm integrates over 20 technical indicators and price action patterns to deliver intelligent entry decisions and comprehensive risk management.
Core Value Proposition
Multi-Timeframe Integration: Combines 1-hour and 4-hour higher timeframe data for signal validation
Dynamic Market Regime Detection: Real-time identification of Low Volatility, Ranging, and High Volatility market environments
Comprehensive Scoring System: Three-dimensional evaluation model based on Breakout Signals, Pattern Recognition, and Position Analysis
Adaptive Position Sizing: Dynamic allocation based on signal strength and market volatility
🟠 Core Architecture
Three-Layer Analytical Framework
1. Market Regime Detection System
Real-time market environment assessment through four dimensions:
ATR Relative Volatility
Bollinger Band Width
Average Amplitude
Momentum Strength
Market State Classification:
Low Volatility (≤30 points): Narrow ranges, awaiting breakout
Ranging Market (31-65 points): Moderate volatility, suitable for range trading
High Volatility (>65 points): Strong trends, ideal for trend following
2. Signal Generation Engine
Breakout Signal Layer:
Donchian Channel Breakouts (Upper/Middle/Lower)
Keltner Channel Breakouts (Upper/Middle/Lower)
Double ATR Momentum Confirmation
Pattern Recognition Layer:
Price Action: Outside Bars, Engulfing Patterns, False Breakouts
Candlestick Patterns: Hammer, Inverted Hammer, Doji, Dragonfly, Gravestone
Three Soldiers Method: Single-bar and Three-bar consecutive patterns
Position Analysis Layer:
Ichimoku Cloud Position (Above/Within/Below)
ADX Trend Strength Confirmation
DC/KC Middle Band Position Analysis
3. Volume & POC Analysis
Volume Confirmation:
High Volume Breakout Validation
Medium Volume Support Confirmation
Point of Control (POC) Value Areas:
Volume-based dense trading zone identification
POC Cluster Scoring System (Size Score + Volume Score + Time Score)
🟠 Trading Logic Specification
Entry Signal Classification
A-Class Signals (Strong Breakout)
Trigger: VP breaking key POC levels + strong pattern confirmation
Characteristics: High confidence, larger position sizing
Stop Loss: Wider stops based on historical ATR volatility
B-Class Signals (Pattern Confirmed)
Trigger: Clear price patterns + volume confirmation
Characteristics: Medium confidence, standard position sizing
Stop Loss: Based on pattern lows/highs
C-Class Signals (Weak Reversal)
Trigger: Single indicator signals + positional support
Characteristics: Lower confidence, small exploratory positions
Stop Loss: Tight stops for quick exits
Scoring Weight Distribution
text
Base Score = Breakout(30%) + Patterns(40%) + Position(30%)
Final Score = Base Score × Market Regime Coefficient × Cloud Position Coefficient
🟠 Risk Management System
Dynamic Stop Loss Strategy
Initial Stop Loss: ATR-based volatility + market regime adjustment
Trailing Stop: Phased tracking, progressively locking profits
Position Management
text
Base Position = Initial Capital × Base Coefficient / Stop Distance
Final Position = Base Position × Signal Strength Coefficient × Market Volatility Coefficient
Take Profit System
Scaled Profit Taking: 8 profit levels with proportional position distribution
Dynamic Adjustment: Trailing stop activation upon reaching specific profit tiers
🟠 Configuration Parameters
Market Regime Thresholds
pinescript
Low Volatility: ≤30 points
Ranging Market: 31-65 points
High Volatility: >65 points
Signal Strength Thresholds
pinescript
// Current Entry Thresholds (No Position)
Low Volatility: Long 82 / Short 82
Ranging: Long 75 / Short 80
High Volatility: Long 80 / Short 85
// Reversal Entry Thresholds
Low Volatility: Long 75 / Short 90
Ranging: Long 85 / Short 90
High Volatility: Long 90 / Short 100
🟠 Usage Guide
1. Initial Setup
Apply to ETH/USDT 15-minute chart
Configure webhook Signal ID and UID
Adjust initial capital parameters according to account size
2. Key Monitoring Elements
Market Regime Indicator: Watch background color changes
Signal Score Display: Monitor real-time long/short scores
POC Value Areas: Identify key support/resistance levels
3. Trading Decision Process
Trend Confirmation Phase:
text
1. Observe market regime background
2. Confirm Ichimoku cloud position
3. Check ADX trend strength
Entry Signal Screening:
text
1. Comprehensive score > corresponding threshold
2. Multiple indicator signal confluence
3. Volume confirmation alignment
Risk Management Execution:
text
1. Automatic position size calculation
2. Set scaled take profit and stop loss
3. Monitor trailing stop updates
4. Advanced Features
Lookback Mode: Historical signal validation
Special Close: Early exit based on ATR ratio
Signal Filtering: Optimize signal quality through component weight adjustment
This systematic multi-factor scoring strategy delivers stable automated trading decisions in complex market environments, particularly well-suited for the short-term volatility characteristics of cryptocurrencies like Ethereum.
Strategy Name: Sunflower Quantitative Strategy
Symbol: ETH/USDT
Timeframe: 15-minute
Market: Cryptocurrency
Strategy Type: Multi-timeframe Quantitative Analysis
Risk Level: Medium-High
Recommended Capital: $10,000+ for optimal position sizing
"向日葵量化"是一款专为ETH 15分钟图表设计的全自动量化交易策略。该策略通过多维度技术分析框架,集成超过20种技术指标与价格行为模式,实现智能化的入场决策与风险控制。
核心价值
多时间框架协同:整合1小时、4小时高周期数据,确保信号质量
动态市场状态识别:实时识别低波动、震荡、高波动三种市场环境
综合评分系统:基于突破信号、形态识别、位置分析的三维评分模型
智能仓位管理:根据信号强度与市场波动率动态调整仓位规模
🟠【核心架构】
策略基于三层分析框架构建:
1. 市场状态识别系统
通过ATR相对波动率、布林带宽、平均振幅、动量强度四个维度,实时判断当前市场环境:
低波动市场(≤30分):窄幅震荡,等待突破
震荡市场(31-65分):中等波动,适合区间交易
高波动市场(>65分):趋势明确,适合趋势跟踪
2. 信号生成引擎
突破信号层:
DC通道突破(上轨/中轨/下轨)
KC通道突破(上轨/中轨/下轨)
双ATR动量确认
形态识别层:
价格行为模式:外包线、吞没形态、假突破
K线形态:锤子线、倒锤子线、十字星、蜻蜓线、墓碑线
三兵三法:单根强度与三根连续形态
位置分析层:
云图位置关系(之上/之中/之下)
ADX趋势强度确认
DC/KC中轨位置判断
3. 成交量与POC分析
成交量确认:
高成交量突破确认
中等成交量支撑确认
POC价值区域:
基于成交量分布的密集成交区识别
POC集群评分系统(规模分+成交量分+时间分)
🟠【交易逻辑详解】
入场信号分类
A类信号(强势突破)
触发条件:VP突破POC关键位 + 强势形态确认
特征:高置信度,大仓位配置
止损设置:相对宽松,基于ATR历史波动率
B类信号(形态确认)
触发条件:明确价格形态 + 成交量确认
特征:中等置信度,标准仓位
止损设置:基于形态低点/高点
C类信号(弱势反弹)
触发条件:单一指标信号 + 位置支撑
特征:低置信度,小仓位试探
止损设置:紧凑止损,快速离场
评分权重分配
text
基础分 = 突破分(30%) + 形态分(40%) + 位置分(30%)
最终分 = 基础分 × 市场状态系数 × 云图位置系数
🟠【风险管理系统】
动态止损策略
初始止损:基于ATR波动率 + 市场状态调整系数
移动止损:分阶段跟踪,逐级锁定利润
仓位管理
text
基础仓位 = 初始资金 × 基础系数 / 止损距离
最终仓位 = 基础仓位 × 信号强度系数 × 市场波动系数
止盈系统
分级止盈:8个止盈级别,按仓位比例分配
动态调整:达到特定止盈级别后启动移动止损
🟠【配置参数】
市场状态阈值
pinescript
低波动区间:≤30分
震荡区间:31-65分
高波动区间:>65分
信号强度阈值
pinescript
// 当前开仓阈值(无持仓)
低波动:做多82分 / 做空82分
震荡:做多75分 / 做空80分
高波动:做多80分 / 做空85分
// 反转开仓阈值
低波动:做多75分 / 做空90分
震荡:做多85分 / 做空90分
高波动:做多90分 / 做空100分
🟠【使用指南】
1. 初始设置
添加到ETH/USDT 15分钟图表
配置webhook信号ID和UID
根据资金量调整初始资本参数
2. 监控要点
市场状态指示器:关注背景颜色变化
信号评分显示:实时查看多头/空头得分
POC价值区域:识别关键支撑阻力
3. 交易决策流程
趋势确认阶段:
text
1. 观察市场状态背景色
2. 确认云图位置关系
3. 检查ADX趋势强度
入场信号筛选:
text
1. 综合评分 > 对应阈值
2. 多指标信号共振
3. 成交量确认配合
风险管理执行:
text
1. 自动计算仓位大小
2. 设置分级止盈止损
3. 监控移动止损更新
4. 高级功能
回看模式:启用历史信号验证
特殊平仓:基于ATR比率的提前离场
信号过滤:通过调整各组件权重优化信号质量
该策略通过系统化的多因子评分机制,在复杂的市场环境中实现稳定的自动化交易决策,特别适合ETH等加密货币的短期波动特性。

ASHOK 15 Novashok trial 15 nov 1845h
I have created this strategy to convert my chart pattern and MACD, EMA observations to tradeable logic.

AlosAlgoAlosAlgo Version: 1 BETA
A multi-timeframe, ATR-driven trend strategy with flexible entry engines (Open/Close vs Renko), optional HTF Heikin Ashi filtering, and a built-in 3-stage take-profit model designed to be backtested on TradingView and automated via webhooks.

Fractal Break Strategy with Time FilterThis strategy isn't complete yet but just curious how fast they will take it down. It is based off breaks of fractals and then taking the High/Low of the break candle

LiquiBreak — Semi-Automatic Breakout, Gap & Trend-Filter StrategLiquiBreak is a semi-automatic breakout + gap detection strategy that combines pivots, a volatility filter and an optional Supertrend direction check to generate entry signals. It can optionally place take-profit and stop-loss orders in points. Use it to highlight high-probability breakout/gap setups and to automate exits when you want — otherwise treat its signals as trade alerts that require your confirmation.
📌 LiquiBreak — Semi-Automatic Breakout, Gap & Trend Strategy
1. Overview
1. LiquiBreak is a semi-automatic breakout + gap strategy designed to catch high-quality moves with volatility confirmation.
2. Uses pivot-based support/resistance , gap detection , Supertrend filtering , and optional automatic TP/SL in points .
3. Works on all assets and timeframes, especially effective on XAUUSD, Indices, Crypto and FX pairs .
---
2. What This Script Detects
1. Breakouts above resistance and below support during strong volatility.
2. Bullish & bearish gap patterns confirmed with momentum sequences.
3. Dynamic volatility zones based on normalized ATR ranges.
4. Optional Supertrend trend direction for filtering bad signals.
5. Automatic TP/SL orders when enabled.
---
3. Recommended Indicators to Combine With
To increase accuracy and reduce false breakouts:
1. Supertrend (included) – best for trend direction.
2. EMA 9/21 or EMA 20/50 – confirms trend strength & pullbacks.
3. RSI or Stoch RSI – avoid overbought/oversold breakouts.
4. VWAP – institutional bias & fair value zones.
5. CPR / Pivot Points – confluence with breakout levels.
6. MACD – trend confirmation on higher timeframe.
7. Volume Profile (optional) – find breakout liquidity zones.
These indicators help filter low-quality signals without affecting the script’s core logic.
---
4. Key Features
1. Volatility-based pivot support & resistance .
2. Reliable breakout confirmation using real-time volatility strength.
3. Strong gap pattern detection with ATR threshold.
4. Optional Supertrend confirmation for safer entries.
5. Point-based Take Profit / Stop Loss .
6. Toggle on/off: Longs, Shorts, TP, SL .
7. Semi-automatic execution — not fully automated.
8. Clean, optimized structure for stability and speed.
---
5. Inputs / Settings
1. Pivot / Levels Period – defines structural S/R levels.
2. Volatility Filter (%) – prevents low-quality signals.
3. TP Points – automatic take-profit target.
4. SL Points – automatic stop-loss.
5. Enable TP / Enable SL – full exit control.
6. Allow Long / Allow Short – direction control.
7. Supertrend Filter – filter weak counter-trend trades.
---
6. How to Use the Strategy
1. Select timeframe & tune pivot/volatility settings.
2. Enable/disable automatic TP/SL based on your style.
3. Turn ON Supertrend for safer trend-based trades.
4. Confirm signals using EMA, RSI, VWAP, Volume or CPR.
5. Watch for high-volatility breakouts near key levels.
6. Use multiple timeframe analysis for stronger confirmation.
---
7. Important Warning (User Must Monitor Trades)
⚠ This script is NOT a fully automatic bot.
1. You MUST monitor the chart while using this strategy.
2. You MUST manually close trades if market conditions change.
3. Auto TP/SL helps, but during news events or fast markets, slippage may occur.
4. Treat this script as a signal + entry assistant , not a fire-and-forget system.
---
8. Best Practices
1. Works best on XAUUSD, NAS100, BTC, ETH, EURUSD .
2. Avoid major news unless experienced.
3. Increase volatility filter during choppy markets.
4. Use M15–H1 for clean breakouts; M5 for scalping.
5. For beginners: keep TP/SL enabled for safety.
6. Backtest first → then paper trade → then live trade.
---
9. Disclaimer
1. For educational and research purposes only .
2. Not financial advice.
3. User is fully responsible for their trades and risk.
4. Past performance does not guarantee future results.

QQQ Momentum Regime Rider (EMA + VWAP + ADX + Vol Pullback)My strategy catches intraday momentum, has a phenomenal return of 18% annually

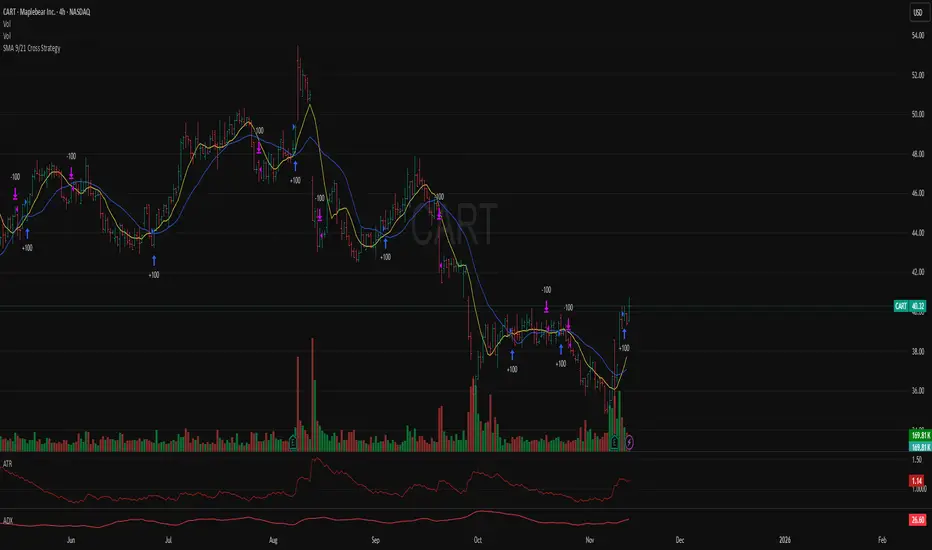
SMA 9/21 Cross StrategyThis is my SILVER CROSS strategy
after 5 months portfolio gain 39%
Never risk more then 2% of your wallet
Stop loss Price - 2xATR
Best results on 4h chart
ADILS_TREND_V5Swing 15 mins using RSI and MAs ... catching the turn around in trend in all time frames. Works best on 15 mins

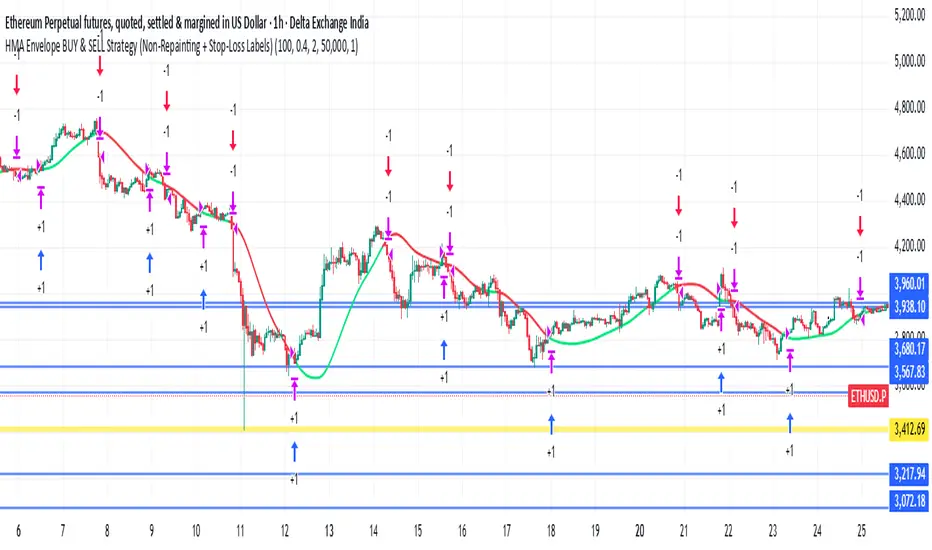
HMA Envelope BUY & SELL Strategy (Non-Repainting BY RAVI KHADSE)Done — I put the HMA Envelope BUY & SELL Strategy (Non-Repainting) script into the canvas as a code file.
Open the canvas document titled HMA Envelope BUY & SELL Strategy (Non-Repainting) to copy the Pine Script into TradingView.
MULTI time FRAME/session filter, different entry logic, alerts,
Kronos Scalper (RAVINDRA KHADSE) 11.11.2025Nice — below is a ready-to-copy TradingView Pine Script (v5) strategy named “Kronos Scalper”.
It’s a self-contained scalping strategy (non-repainting) with configurable EMAs trend filter, RSI entry filter, ATR-based stop loss / take profit, optional trailing stop, plots and entry/exit labels. Drop it into TradingView’s Pine editor and Add to Chart → Strategy Tester.


Multi-EMA Session Breakout Strategythis is a strategy that use the session high and low and the EMA LOWS 2 3 6 9 110 355 AND 480
Multi-EMA Strategy (Low Source)this strategy use the ema low for its functionality 8 9 110 355 and 480

FVG Session Break Strategy with ATR RR🧠 FVG Session Break Strategy with ATR RR — Timezone-Aware, Session-Savvy, and Risk-Calibrated
This strategy captures high-probability reversals and continuations by combining Fair Value Gap (FVG) imbalances with session-based breakout logic and ATR-calibrated risk management. It’s designed for traders who want to exploit structural inefficiencies during key market sessions — with precision and portability across global exchanges.
🔍 Core Logic:
Fair Value Gap Detection: Identifies bullish and bearish FVGs using a 3-bar displacement pattern.
Session Breakout Engine: Tracks session highs and lows (Asian, London, NY) and triggers trades only when price breaks these levels — ensuring trades occur at meaningful inflection points.
ATR-Based RR Control: Dynamically sizes stop-loss and take-profit levels using ATR × multiplier, maintaining consistent risk across volatility regimes.
🌐 Timezone-Aware Session Logic:
Session boundaries are defined in UTC-5 (e.g., NY: 0930–1600) but automatically converted to the exchange’s local timezone using timestamp("Etc/GMT+5", ...). This ensures:
Accurate session detection across all markets and assets
No manual timezone adjustments needed
Robust performance on crypto, forex, and global equities
📈 Visuals:
Session highs and lows plotted in orange
Bullish and bearish FVGs marked with green and red triangles
Strategy entries and exits shown on chart with full RR logic
This strategy is ideal for traders who want to combine structural edge with session context and disciplined risk.

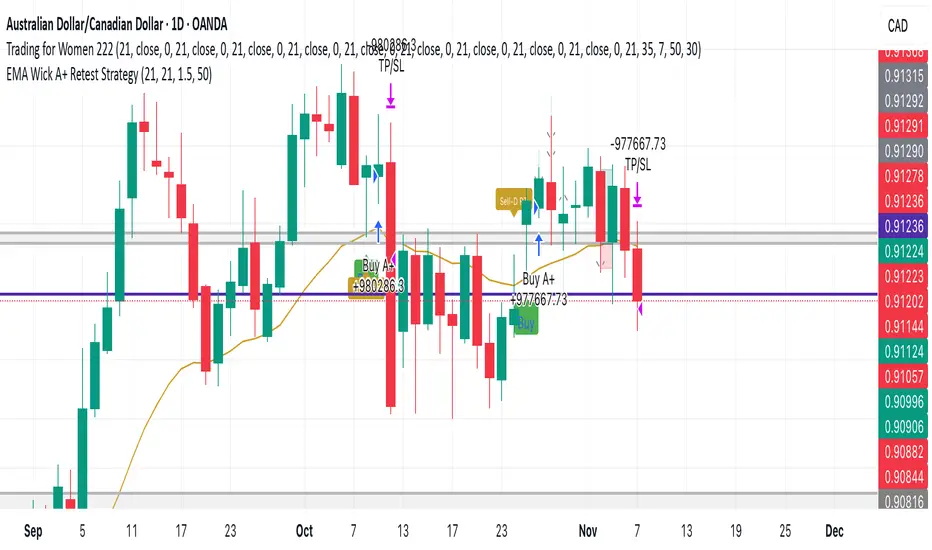
EMA Wick A+ Retest StrategyThe EMA Wick A+ Retest Strategy is a precision pullback system built for high-probability trend entries. It uses a combination of:
EMA 21 dynamic trend filtering
ATR-based stop-loss and reward targeting (1:1.5 RR)
Wick retest logic, where the lower wick must touch the EMA and represent at least 50% of the candle's range
Optional filter: RSI > 50 for bullish momentum confirmation
This strategy is designed to capture institutional-style entries after a clean pullback in an uptrend.
✅ Clean signals
✅ High risk-to-reward setups
✅ Built for swing trading or intraday with strong trend bias
Ideal for Forex, Crypto, and Indices.
Use responsibly. Backtest before live trading.