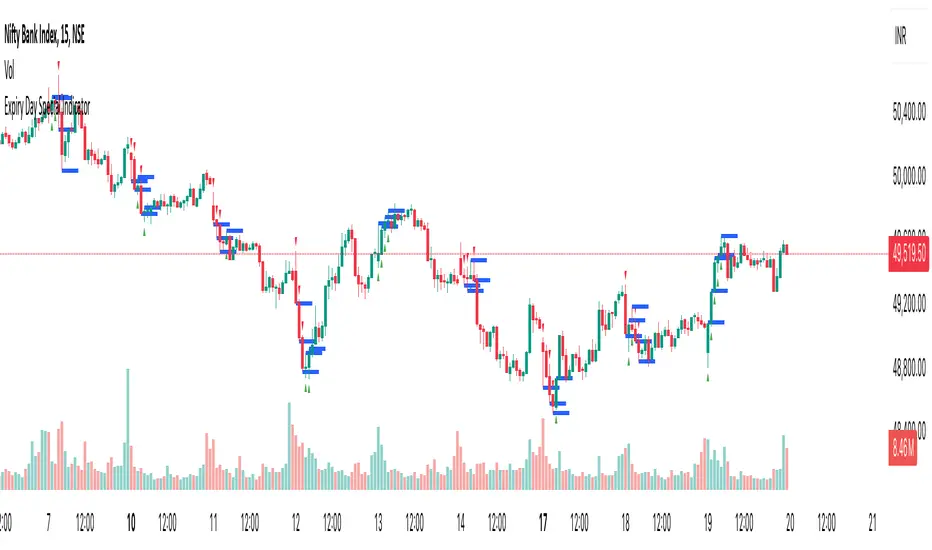
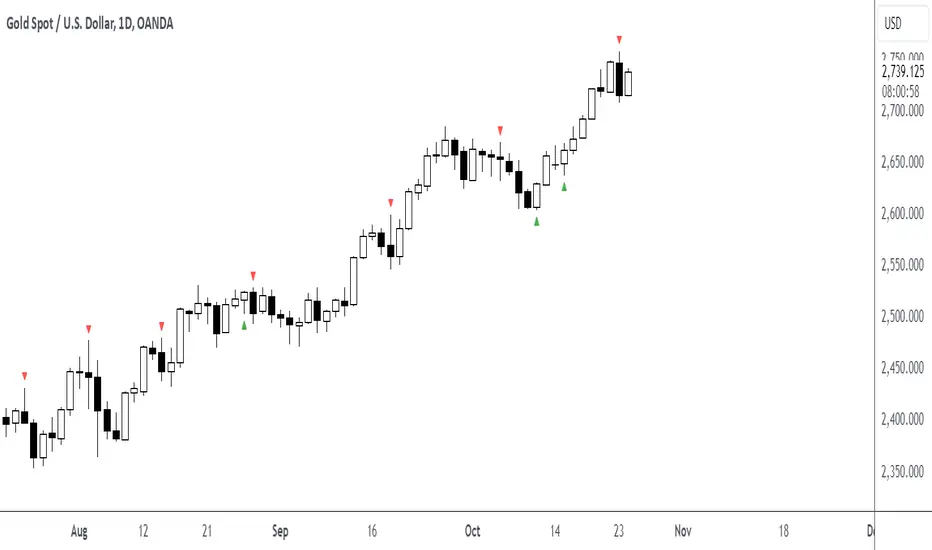
Expiry Day Special IndicatorExpiry Day Special Indicator
The Expiry Day Special Indicator is designed to detect catalytic price action patterns that commonly occur between 9:15 AM to 10:15 AM (IST) in the Nifty & Bank Nifty markets but not limited to these specific markets. While these patterns are particularly useful on expiry days, they are not limited to expiry trading alone. They can also be applied on other trading days when similar conditions arise, making them versatile for intraday traders.
How It Works
This indicator scans for bullish and bearish price action patterns within the first trading hour and plots potential buy and sell signals based on key market structures.
• Bearish Patterns: Identifies strong rejection zones and weakness in price action to signal potential short trades.
• Bullish Patterns: Recognizes reversal formations that indicate potential long trade opportunities.
• Time Filter: The setup is valid only between 9:15 AM - 10:15 AM (IST) to focus on high-impact market moves.
Why This Indicator?
1. Specialized for Nifty & Bank Nifty – Designed specifically for Indian markets.
2. Early Trend Identification – Helps traders capture moves early in the session.
3. Works Beyond Expiry Days – Although optimized for expiry trading, it can also detect similar patterns on regular days.
📌 Note: This indicator does not provide trading advice; always use proper risk management.
Candlestickpattern
Naive Bayes Candlestick Pattern Classifier v1.1 BETAAn intermezzo on why i made this script publication..
A : Candlestick Pattern took hours to backtest, why not using Machine Learning techniques?
B : Machine Learning, no that's gonna be really heavy bro!
A : Not really, because we use Naive Bayes.
B : The simplest, yet powerful machine learning algorithm to separate (a.k.a classify) multivariate data.
----------------------------------------------------------------------------------------------------------------------
Hello, everyone!
After deep research in extracting meaningful information from the market, I ended up building this powerful machine learning indicator based on the evolution of Bayesian Statistics. This indicator not only leverages the simplicity of Naive Bayes but also extends its application to candlestick pattern analysis, making it an invaluable tool for traders who are looking to enhance their technical analysis without spending countless hours manually backtesting each pattern on each market!.
What most interesting part is actually after learning all of likely useless methods like fibonacci, supply and demand, volume profile, etc. We always ended up back to basic like support and resistance and candlestick patterns, but with a slight twist on strategy algorithm design and statistical approach. Thus, the only reason why i made this, because i exactly know that you guys will ended up in this position as time goes by.
The essence of this indicator lies in its ability to automate the recognition and statistical evaluation of various candlestick patterns. Traditionally, traders have relied on visual inspection and manual backtesting to determine the effectiveness of patterns like Bullish Engulfing, Bearish Engulfing, Harami variations, Hammer formations, and even more complex multi-candle patterns such as Three White Soldiers, Three Black Crows, Dark Cloud Cover, and Piercing Pattern. However, these conventional methods are both time-consuming and prone to subjective bias.
To address these challenges, I employed Naive Bayes—a probabilistic classifier that, despite its simplicity, offers robust performance in various domains. Naive Bayes assumes that each feature is independent of the others given the class label, which, although a strong assumption, works remarkably well in practice, especially when the dataset is large like market data and the feature space is high-dimensional. In our case, each candlestick pattern acts as a feature that can be statistically evaluated based on its historical performance. The indicator calculates a probability that a given pattern will lead to a price reversal, by comparing the pattern’s close price to the highest or lowest price achieved in a lookahead window.
One of the standout features of this script is its flexibility. Each candlestick pattern is not only coded into the system but also comes with individual toggles to enable or disable them based on your trading strategy. This means you can choose to focus on single-candle patterns like Bullish Engulfing or more complex multi-candle formations such as Three White Soldiers, without modifying the core code. The built-in customization options allow you to adjust colors and labels for each pattern, giving you the freedom to tailor the visual output to your preference. This level of customization ensures that the indicator integrates seamlessly into your existing TradingView setup.
Moreover, the indicator isn’t just about pattern recognition—it also incorporates outcome-based learning. Every time a pattern is detected, it looks ahead a predefined number of bars to evaluate if the expected reversal actually materialized. This outcome is then stored in arrays, and over time, the script dynamically calculates the probability of success for each pattern. These probabilities are presented in a real-time updating table on your chart, which shows not only the percentage probability but also the count of historical occurrences. With this information at your fingertips, you can quickly gauge the reliability of each pattern in your chosen market and timeframe.
Another significant advantage of this approach is its speed and efficiency. While more complex machine learning models like neural networks might require heavy computational resources and longer training times, the Naive Bayes classifier in this script is lightweight, instantaneous and can be updated on the fly with each new bar. This real-time capability is essential for modern traders who need to make quick decisions in fast-paced markets.
Furthermore, by automating the process of backtesting, the indicator frees up your time to focus on other aspects of trading strategy development. Instead of manually analyzing hundreds or even thousands of candles, you can rely on the statistical power of Naive Bayes to provide you with insights on which patterns are most likely to result in profitable moves. This not only enhances your efficiency but also helps to eliminate the cognitive biases that often plague manual analysis.
In summary, this indicator represents a fusion of traditional candlestick analysis with modern machine learning techniques. It harnesses the simplicity and effectiveness of Naive Bayes to deliver a dynamic, real-time evaluation of various candlestick patterns. Whether you are a seasoned trader looking to refine your technical analysis or a beginner eager to understand market dynamics, this tool offers a powerful, customizable, and efficient solution. Welcome to a new era where advanced statistical methods meet practical trading insights—happy trading and may your patterns always be in your favor!
Note : On this current released beta version, you must manually adjust reversal percentage move based on each market. Further updates may include automated best range detection and probability.

Candle Emotion Index (CEI) StrategyThe Candle Emotion Index (CEI) Strategy is an innovative sentiment-based trading approach designed to help traders identify and capitalize on market psychology. By analyzing candlestick patterns and combining them into a unified metric, the CEI Strategy provides clear entry and exit signals while dynamically managing risk. This strategy is ideal for traders looking to leverage market sentiment to identify high-probability trading opportunities.
How It Works
The CEI Strategy is built around three core oscillators that reflect key emotional states in the market:
Indecision Oscillator . Measures market uncertainty using patterns like Doji and Spinning Tops. High values indicate hesitation, signaling potential turning points.
Fear Oscillator . Tracks bearish sentiment through patterns like Shooting Star, Hanging Man, and Bearish Engulfing. Helps identify moments of intense selling pressure.
Greed Oscillator . Detects bullish sentiment using patterns like Marubozu, Hammer, Bullish Engulfing, and Three White Soldiers. Highlights periods of strong buying interest.
These oscillators are averaged into the Candle Emotion Index (CEI):
CEI = (Indecision + Fear + Greed) / 3
This single value quantifies overall market sentiment and drives the strategy’s trading decisions.
Key Features
Sentiment-Based Trading Signals . Long Entry: Triggered when the CEI crosses above a lower threshold (e.g., 0.1), indicating increasing bullish sentiment. Short Entry: Triggered when the CEI crosses above a higher threshold (e.g., 0.2), signaling rising bearish sentiment.
Volume Confirmation . Trades are validated only if volume exceeds a user-defined multiplier of the average volume over the lookback period. This ensures entries are backed by significant market activity.
Break-Even Recovery Mechanism . If a trade moves into a loss, the strategy attempts to recover to break-even instead of immediately exiting at a loss. This feature provides flexibility, allowing the market to recover while maintaining disciplined risk management.
Dynamic Risk Management . Maximum Holding Period: Trades are closed after a user-defined number of candles to avoid overexposure to prolonged uncertainty. Profit-Taking Conditions: Positions are exited when favorable price moves are confirmed by increased volume, locking in gains. Loss Threshold: Trades are exited early if the price moves unfavorably beyond a set percentage of the entry price, limiting potential losses.
Cooldown Period . After a trade is closed, a cooldown period prevents immediate re-entry, reducing overtrading and improving signal quality.
Why Use This Strategy?
The CEI Strategy combines advanced sentiment analysis with robust trade management, making it a powerful tool for traders seeking to understand market psychology and identify high-probability setups. Its unique features, such as the break-even recovery mechanism and volume confirmation, add an extra layer of discipline and reliability to trading decisions.
Best Practices
Combine with Other Indicators . Use trend-following tools (e.g., moving averages, ADX) and momentum oscillators (e.g., RSI, MACD) to confirm signals.
Align with Key Levels . Incorporate support and resistance levels for refined entries and exits.
Multi-Market Compatibility . Apply this strategy to forex, crypto, stocks, or any asset class with strong volume and price action.

Star Pattern IdentifierThe Star Pattern Identifier is a custom TradingView indicator designed to detect and mark Morning Star (MS) and Evening Star (ES) candlestick patterns, which are powerful reversal signals. This indicator offers a flexible and customizable approach by incorporating adjustable parameters for both the size and volume of the third candle in the pattern.
Key Features:
Morning Star (MS) : A bullish reversal pattern that occurs after a downtrend.
Evening Star (ES) : A bearish reversal pattern that occurs after an uptrend.
Adjustable Parameters:
Third Candle Size Multiplier : Define how large the body of the third candle should be relative to the second candle (default is 2x).
Third Candle Volume Multiplier : Control the minimum volume of the third candle in relation to the second candle (default is 0.5x).
The script ensures that the third candle’s volume is at least 50% of the second candle's volume and that its body is at least twice the size of the second candle, to filter out weaker signals.
The patterns are marked directly on the chart with "MS" (Morning Star) or "ES" (Evening Star) labels for easy identification.
Practical Use:
Use this indicator to spot potential trend reversals with more confidence by ensuring strong candlestick body and volume conditions.
Customize the parameters to suit your trading strategy and preferences.
How it Works:
The indicator looks for a bearish first candle , followed by a bullish or indecisive second candle , and a bullish third candle for the Morning Star pattern.
For the Evening Star, the indicator looks for a bullish first candle , followed by a bearish or indecisive second candle , and a bearish third candle .
The size and volume of the third candle are checked to ensure it meets the set parameters, confirming the strength of the reversal signal.
This tool is perfect for traders seeking to spot reversal signals in the market.

Candle Emotion Index (CEI)The Candle Emotion Index (CEI) is a comprehensive sentiment analysis indicator that combines three sub-oscillators—Indecision Oscillator, Fear Oscillator, and Greed Oscillator—to provide a single, unified measure of market sentiment. By analyzing bullish, bearish, and indecisive candlestick patterns, the CEI delivers a holistic view of market emotions and helps traders identify key turning points.
How It Works
Indecision Oscillator: Measures market uncertainty using Doji and Spinning Top candlestick patterns. Scores their presence and normalizes the results over a user-defined lookback period.
Fear Oscillator: Measures bearish sentiment using Shooting Star, Hanging Man, and Bearish Engulfing candlestick patterns. Scores their presence and normalizes the results over a user-defined lookback period.
Greed Oscillator: Measures bullish sentiment using Marubozu, Bullish Engulfing, Hammer, and Three White Soldiers candlestick patterns. Scores their presence and normalizes the results over a user-defined lookback period.
Candle Emotion Index Calculation: The CEI is calculated as the average of the Indecision, Fear, and Greed Oscillators: CEI = (Indecision Oscillator + Fear Oscillator + Greed Oscillator) / 3
Plotting: The CEI is plotted as a single line on the chart, representing overall market sentiment.
Reference lines are added to indicate Low Emotion, Neutral, and High Emotion levels.
The Candle Emotion Index provides a unified perspective on market sentiment by blending indecision, fear, and greed into one easy-to-interpret metric. It serves as a powerful tool for traders seeking to gauge market psychology and identify high-probability trading opportunities. For best results, use the CEI in conjunction with other technical indicators to confirm signals.

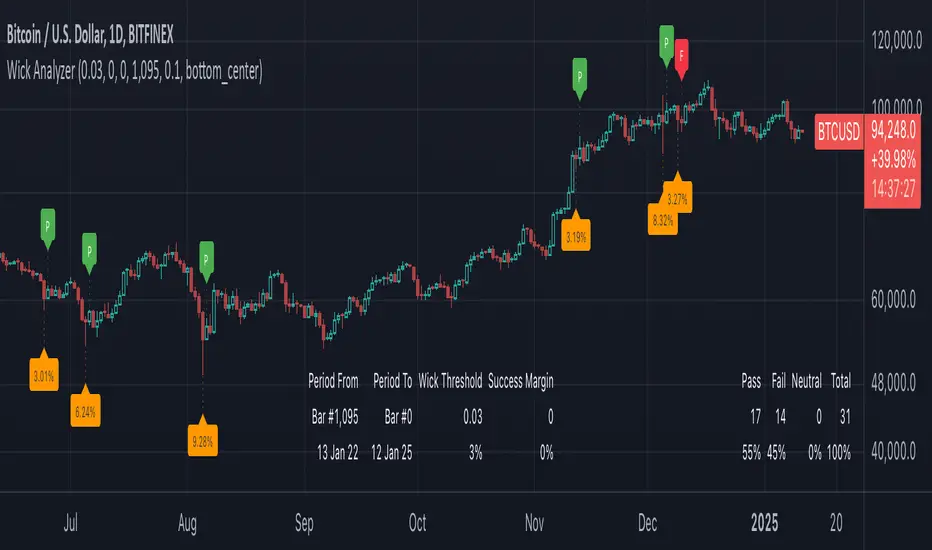
Wick Strategy AnalyzerOverview
This indicator analyzes candle wick patterns and evaluates their outcomes over a user-definable range (default is 1 year). Labels are rendered on the chart to mark events that meet the specified wick condition.
Features
Customizable Bar Range - users can specify the range of bars to include in the analysis. Default is 365 bars back from the most recent bar (bar 0)
Visual Indicators - labels are rendered to mark conditions & outcomes.
Wick Condition Met - an Orange label below the wick candle displaying the wick’s percentage size.
Outcome Labels - rendered above the candle after wick condition met candles
P (Green): Pass
F (Red): Fail
N (Navy): Neutral
I (Blue): Indicates the current candle has not yet closed, so the outcome is undetermined.
Input Parameters
Wick Threshold - minimum wick size required to qualify as a wick condition.
Success Margin - Defines the margin for classifying outcomes as Pass, Fail, or Neutral. E.g., a success margin of 0.01 requires the next candle's close to exceed the wick candle's close by 1% in order to be a Pass.
Bar Offset Start - starting offset from the last bar for analysis. A value of -1 will include all bars.
Bar Offset End - ending offset from the last bar for analysis. Bars outside this range are excluded.
Example Scenario
Goal: Analyze how candles with a wick size of at least 3.5% perform within a success margin of 1% over the past 540 days.
Setup:
Set Wick Threshold to 0.035
Set Success Margin to 0.01
Set Bar Range Start to 0
Set Bar Range End to 540.
Expected Output
Candles with a wick of at least 3.5% are labeled.
Outcome labels (P, F, or N) indicate performance.
Bullish Reversal Bar Strategy [Skyrexio]Overview
Bullish Reversal Bar Strategy leverages the combination of candlestick pattern Bullish Reversal Bar (description in Methodology and Justification of Methodology), Williams Alligator indicator and Williams Fractals to create the high probability setups. Candlestick pattern is used for the entering into trade, while the combination of Williams Alligator and Fractals is used for the trend approximation as close condition. Strategy uses only long trades.
Unique Features
No fixed stop-loss and take profit: Instead of fixed stop-loss level strategy utilizes technical condition obtained by Fractals and Alligator or the candlestick pattern invalidation to identify when current uptrend is likely to be over (more information in "Methodology" and "Justification of Methodology" paragraphs)
Configurable Trading Periods: Users can tailor the strategy to specific market windows, adapting to different market conditions.
Trend Trade Filter: strategy uses Alligator and Fractal combination as high probability trend filter.
Methodology
The strategy opens long trade when the following price met the conditions:
1.Current candle's high shall be below the Williams Alligator's lines (Jaw, Lips, Teeth)(all details in "Justification of Methodology" paragraph)
2.Price shall create the candlestick pattern "Bullish Reversal Bar". Optionally if MFI and AO filters are enabled current candle shall have the decreasing AO and at least one of three recent bars shall have the squat state on the MFI (all details in "Justification of Methodology" paragraph)
3.If price breaks through the high of the candle marked as the "Bullish Reversal Bar" the long trade is open at the price one tick above the candle's high
4.Initial stop loss is placed at the Bullish Reversal Bar's candle's low
5.If price hit the Bullish Reversal Bar's low before hitting the entry price potential trade is cancelled
6.If trade is active and initial stop loss has not been hit, trade is closed when the combination of Alligator and Williams Fractals shall consider current trend change from upward to downward.
Strategy settings
In the inputs window user can setup strategy setting:
Enable MFI (if true trades are filtered using Market Facilitation Index (MFI) condition all details in "Justification of Methodology" paragraph), by default = false)
Enable AO (if true trades are filtered using Awesome Oscillator (AO) condition all details in "Justification of Methodology" paragraph), by default = false)
Justification of Methodology
Let's explore the key concepts of this strategy and understand how they work together. The first and key concept is the Bullish Reversal Bar candlestick pattern. This is just the single bar pattern. The rules are simple:
Candle shall be closed in it's upper half
High of this candle shall be below all three Alligator's lines (Jaw, Lips, Teeth)
Next, let’s discuss the short-term trend filter, which combines the Williams Alligator and Williams Fractals. Williams Alligator
Developed by Bill Williams, the Alligator is a technical indicator that identifies trends and potential market reversals. It consists of three smoothed moving averages:
Jaw (Blue Line): The slowest of the three, based on a 13-period smoothed moving average shifted 8 bars ahead.
Teeth (Red Line): The medium-speed line, derived from an 8-period smoothed moving average shifted 5 bars forward.
Lips (Green Line): The fastest line, calculated using a 5-period smoothed moving average shifted 3 bars forward.
When the lines diverge and align in order, the "Alligator" is "awake," signaling a strong trend. When the lines overlap or intertwine, the "Alligator" is "asleep," indicating a range-bound or sideways market. This indicator helps traders determine when to enter or avoid trades.
Fractals, another tool by Bill Williams, help identify potential reversal points on a price chart. A fractal forms over at least five consecutive bars, with the middle bar showing either:
Up Fractal: Occurs when the middle bar has a higher high than the two preceding and two following bars, suggesting a potential downward reversal.
Down Fractal: Happens when the middle bar shows a lower low than the surrounding two bars, hinting at a possible upward reversal.
Traders often use fractals alongside other indicators to confirm trends or reversals, enhancing decision-making accuracy.
How do these tools work together in this strategy? Let’s consider an example of an uptrend.
When the price breaks above an up fractal, it signals a potential bullish trend. This occurs because the up fractal represents a shift in market behavior, where a temporary high was formed due to selling pressure. If the price revisits this level and breaks through, it suggests the market sentiment has turned bullish.
The breakout must occur above the Alligator’s teeth line to confirm the trend. A breakout below the teeth is considered invalid, and the downtrend might still persist. Conversely, in a downtrend, the same logic applies with down fractals.
How we can use all these indicators in this strategy? This strategy is a counter trend one. Candle's high shall be below all Alligator's lines. During this market stage the bullish reversal bar candlestick pattern shall be printed. This bar during the downtrend is a high probability setup for the potential reversal to the upside: bulls were able to close the price in the upper half of a candle. The breaking of its high is a high probability signal that trend change is confirmed and script opens long trade. If market continues going down and break down the bullish reversal bar's low potential trend change has been invalidated and strategy close long trade.
If market really reversed and started moving to the upside strategy waits for the trend change form the downtrend to the uptrend according to approximation of Alligator and Fractals combination. If this change happens strategy close the trade. This approach helps to stay in the long trade while the uptrend continuation is likely and close it if there is a high probability of the uptrend finish.
Optionally users can enable MFI and AO filters. First of all, let's briefly explain what are these two indicators. The Awesome Oscillator (AO), created by Bill Williams, is a momentum-based indicator that evaluates market momentum by comparing recent price activity to a broader historical context. It assists traders in identifying potential trend reversals and gauging trend strength.
AO = SMA5(Median Price) − SMA34(Median Price)
where:
Median Price = (High + Low) / 2
SMA5 = 5-period Simple Moving Average of the Median Price
SMA 34 = 34-period Simple Moving Average of the Median Price
This indicator is filtering signals in the following way: if current AO bar is decreasing this candle can be interpreted as a bullish reversal bar. This logic is applicable because initially this strategy is a trend reversal, it is searching for the high probability setup against the current trend. Decreasing AO is the additional high probability filter of a downtrend.
Let's briefly look what is MFI. The Market Facilitation Index (MFI) is a technical indicator that measures the price movement per unit of volume, helping traders gauge the efficiency of price movement in relation to trading volume. Here's how you can calculate it:
MFI = (High−Low)/Volume
MFI can be used in combination with volume, so we can divide 4 states. Bill Williams introduced these to help traders interpret the interaction between volume and price movement. Here’s a quick summary:
Green Window (Increased MFI & Increased Volume): Indicates strong momentum with both price and volume increasing. Often a sign of trend continuation, as both buying and selling interest are rising.
Fake Window (Increased MFI & Decreased Volume): Shows that price is moving but with lower volume, suggesting weak support for the trend. This can signal a potential end of the current trend.
Squat Window (Decreased MFI & Increased Volume): Shows high volume but little price movement, indicating a tug-of-war between buyers and sellers. This often precedes a breakout as the pressure builds.
Fade Window (Decreased MFI & Decreased Volume): Indicates a lack of interest from both buyers and sellers, leading to lower momentum. This typically happens in range-bound markets and may signal consolidation before a new move.
For our purposes we are interested in squat bars. This is the sign that volume cannot move the price easily. This type of bar increases the probability of trend reversal. In this indicator we added to enable the MFI filter of reversal bars. If potential reversal bar or two preceding bars have squat state this bar can be interpret as a reversal one.
Backtest Results
Operating window: Date range of backtests is 2023.01.01 - 2024.12.31. It is chosen to let the strategy to close all opened positions.
Commission and Slippage: Includes a standard Binance commission of 0.1% and accounts for possible slippage over 5 ticks.
Initial capital: 10000 USDT
Percent of capital used in every trade: 50%
Maximum Single Position Loss: -5.29%
Maximum Single Profit: +29.99%
Net Profit: +5472.66 USDT (+54.73%)
Total Trades: 103 (33.98% win rate)
Profit Factor: 1.634
Maximum Accumulated Loss: 1231.15 USDT (-8.32%)
Average Profit per Trade: 53.13 USDT (+0.94%)
Average Trade Duration: 76 hours
How to Use
Add the script to favorites for easy access.
Apply to the desired timeframe and chart (optimal performance observed on 4h ETH/USDT).
Configure settings using the dropdown choice list in the built-in menu.
Set up alerts to automate strategy positions through web hook with the text: {{strategy.order.alert_message}}
Disclaimer:
Educational and informational tool reflecting Skyrex commitment to informed trading. Past performance does not guarantee future results. Test strategies in a simulated environment before live implementation
These results are obtained with realistic parameters representing trading conditions observed at major exchanges such as Binance and with realistic trading portfolio usage parameters.

HTF CandlesHTF Candles, Plot of a Higher/Lower Timeframe Candles on any chart.
This HTF / LTF candle plot displays the previous 3 daily candles with the current update of the price with reference to a lower time frame.
Candles includes 3 Candles of HTF
last HTF candle includes 4 previous candles from LTF
Candle High Low Open Close are plotted.
these OHLC values act as Support and Resistance With reference to current Price.
very useful in making HTF and LTF analysis with reference to current timeframe.

PreannFXExplanation of the PreannFX indicator:
Candle Body Size:
The body of the current candle is larger than the previous candle.
Bullish Engulfing:
The current candle closes higher than the previous candle's high.
The body size is larger than the previous candle.
Bearish Engulfing:
The current candle closes lower than the previous candle's low.
The body size is larger than the previous candle.
Entry and Exit:
Bullish: Enter at the previous candle's open or high, stop loss at the previous low, and take profit is 1:1 with the stop loss.
Bearish: Enter at the previous candle's open or low, stop loss at the previous high, and take profit is 1:1 with the stop loss.
Visualization:
Green upward arrows for bullish engulfing patterns.
Red downward arrows for bearish engulfing patterns.

Open_close AND HIGH_LOW_diffAverage of Absolute (Open - Close) Indicator
This indicator calculates the average of the absolute difference between the open and close prices of the last n candles and plots the result in a separate panel.
Key Features:
Customizable Period: Users can set the number of candles (n) to include in the average calculation.
Absolute Value Calculation: The script computes the absolute difference (|Open - Close|) for each candle, ensuring only positive values are averaged.
Separate Panel Visualization: The indicator is displayed in a separate panel below the main chart for clear and uncluttered analysis.
Red Plot: The average value is plotted with a bold red line for easy identification.
Use Cases:
Analyze the average volatility of price movements over a specified period.
Identify periods of consistent price differences between open and close levels.
Complement other volatility or trend-based indicators.
This tool is ideal for traders who want to monitor the consistency of price fluctuations and integrate it into their decision-making process.
How to Use:
Add the script to your TradingView chart.
Adjust the "Number of Candles" input to match your preferred look-back period.
Observe the red line in the separate panel to analyze the average absolute difference over time.
Feel free to reach out with suggestions or feedback to enhance the functionality of this script!

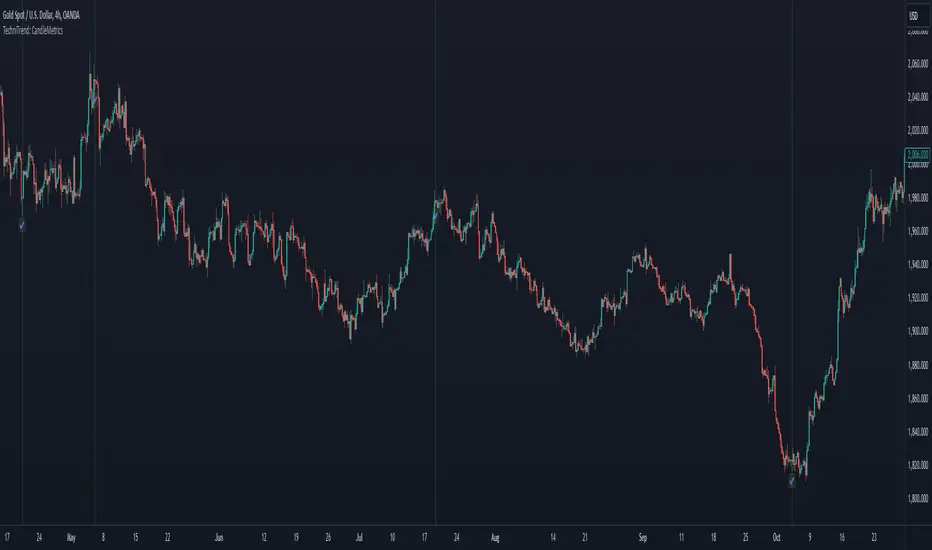
TechniTrend: CandleMetrics🟦 Overview
The TechniTrend: CandleMetrics Indicator is a powerful tool designed to give traders an in-depth analysis of candlestick structures. This indicator allows users to identify potential reversal points, trend continuations, and other crucial market behaviors by examining key ratios between candle components—such as body, shadow, and overall range—alongside volume conditions. The advanced filtering options offer flexibility for both novice and experienced traders, enabling tailored setups to suit different trading strategies.
🟦 Key Features
🔸Customizable Ratios: Set thresholds for Body-to-Range, Shadow-to-Range, Upper Shadow-to-Range, and Lower Shadow-to-Range ratios.
🔸Volume-Based Filters: Integrate volume conditions to strengthen the reliability of signals.
🔸Flexible Conditions: Choose whether filters should work independently or in combination, allowing for precise pattern identification.
🔸Visual Markers: Mark potential signals with a distinct background color and symbols on the chart.
🔸Alerts: Receive notifications for each selected condition, ensuring you never miss an opportunity.
🟦 How It Works
The CandleMetrics Indicator operates by analyzing the relationship between different components of each candlestick, combined with volume data to determine the strength of signals. Here’s a detailed breakdown of each feature:
🔸 Body to Range Ratio:
This filter compares the size of the candle's body to its total range (from high to low).
Example Setting: If you’re interested in spotting candles with small bodies relative to their total range, you might set the Body-to-Range Ratio to “Less than 0.3.”
🔸 Shadow to Range Ratio:
This examines the combined size of both shadows (upper and lower) relative to the entire candle range.
Example Setting: Use a Shadow-to-Range Ratio set to “More than 0.8” to find candles with significant wick lengths, suggesting market indecision.
🔸 Upper Shadow to Range Ratio:
This filter assesses the proportion of the upper shadow (wick) in relation to the candle’s full range.
Example Setting: “Less than 0.05” can help identify situations where the upper shadow is minimal, indicating strong downward pressure.
🔸 Lower Shadow to Range Ratio:
It measures the lower shadow compared to the entire candle range.
Example Setting: “More than 0.7” is useful for detecting potential rejection patterns at lower prices, hinting at a possible bullish reversal.
🔸 Volume Filter:
Integrates volume data to verify the reliability of each candle pattern.
Example Setting: Apply a Volume Filter Length of 100 with an SMA type to smooth volume data over a longer period, filtering out short-term noise and focusing on significant volume shifts.
🟦 Combining Filters
The indicator offers an option to Combine Filters. When this setting is enabled, all selected conditions must be met simultaneously for a candle to be marked. If disabled, each condition functions independently, allowing more flexibility in detecting diverse patterns.
🟦 Examples & Use Cases
🔸Example 1: Spotting Reversal Opportunities
I used the following configuration to find potential bullish reversals:
Upper Shadow to Range Ratio: “Less than 0.05” – Looking for candles with almost no upper shadow.
Lower Shadow to Range Ratio: “More than 0.7” – Highlighting candles with a significant lower shadow.
Volume Filter Length: 100 with SMA.
This setup effectively highlights candles where price rejection is happening at lower levels, suggesting a potential trend reversal to the upside.
🔸Example 2: Detecting Market Uncertainty
If you want to focus on candles showing market hesitation, try:
Shadow to Range Ratio: “More than 0.85” – Emphasizing long-wick candles that could indicate indecision.
Disable Combine Filters to allow flexibility, marking any candle meeting the above criteria.
🟦 Detailed Explanation of Each Option
Here’s a clear and concise breakdown of each option for a better understanding:
1. Body to Range Ratio
Purpose: This ratio shows how significant the candle's body is compared to its overall range. A smaller body-to-range ratio can indicate a potential reversal if the market appears indecisive.
How to Use: Increase the ratio to filter for stronger trend candles; decrease it to identify reversal or indecision candles.
2. Shadow to Range Ratio
Purpose: This filter captures the size of both shadows relative to the candle's total range. A larger ratio often points to market hesitation, while a smaller ratio suggests a decisive move.
How to Use: Adjust this filter to focus on candles with long wicks (indecision) or short wicks (decisiveness).
3. Upper Shadow to Range Ratio
Purpose: Helps to identify candles with strong downward moves by focusing on the upper wick length. A small upper shadow can imply sellers' dominance.
How to Use: Lower the ratio to detect candles with minimal upward rejection.
4. Lower Shadow to Range Ratio
Purpose: Targets candles with strong buying pressure by analyzing the lower shadow. A larger lower shadow may indicate a bullish reversal.
How to Use: Increase the ratio to spot rejection candles with significant lower shadows.
5. Volume Filter
Purpose: Adds a volume component to verify the validity of each candlestick pattern. Higher-than-average volume often signifies the strength of a move.
How to Use: Adjust the filter length and type to smooth out volume fluctuations based on your trading timeframe.
🟦 Indicator Alerts
Each filter has its own alert configuration, enabling traders to stay updated on market conditions that meet their selected criteria. You can customize alerts to trigger whenever a condition is met, helping to manage trades even when away from the screen.
Engulfing Pattern & Impulse [UAlgo]The Engulfing Pattern & Impulse is a tool designed for technical traders who utilize price action and volume analysis to assess market trends and potential reversals. This indicator identifies two powerful trading signals: Engulfing Patterns and Volume Impulses, which are essential components for evaluating potential bullish or bearish market momentum.
Engulfing Patterns are classic candlestick formations often associated with reversals or trend continuations, depending on the overall trend context. This indicator highlights both bullish and bearish engulfing patterns based on configurable criteria such as trend detection settings, comparison with average body size, and a customizable body multiplier for validation. The Volume Impulse feature signals moments of significant volume compared to historical levels, which often precede substantial price movements. Together, these features provide traders with a versatile tool for better timing entry and exit points.
The indicator also offers an adaptive trend detection system, allowing traders to choose from multiple methods (e.g., SMA50 or SMA50/SMA200 combinations) to assess the trend context, making it ideal for various market conditions.
🔶Key Features
Engulfing Pattern Detection: Identifies bullish and bearish engulfing patterns with customizable parameters, including body length and average size comparison.
Configurable trend basis: Choose between SMA50 or SMA50 with SMA200 to define trend direction.
Body size multiplier: Adjust the size threshold for valid engulfing patterns, providing flexibility based on market conditions.
Volume Impulse Signal: Highlights volume spikes that meet or exceed a specified multiplier, which can indicate increased buying or selling interest.
Customizable volume period and multiplier: Allows you to tailor the volume impulse detection based on the instrument’s average volume behavior.
Trend Detection Options: Select different trend detection methods to suit various trading styles and instruments.
SMA50-based detection: Classifies the trend based on the position of price relative to the 50-period SMA.
SMA50 and SMA200 combination: Incorporates a dual-moving average approach, classifying trends based on the relationship between price, SMA50, and SMA200.
Enhanced Visualization: Distinguishes bullish and bearish signals with customizable colors, providing clear and immediate visual cues for easy interpretation.
Custom label colors: Allows you to set distinct colors for bullish, bearish, and neutral signals for quick identification.
Pattern filtering: Enable or disable specific patterns (Bullish, Bearish, or Both) based on your trading preferences.
🔶 Interpreting Indicator
Bullish Engulfing Pattern: Indicates a potential bullish reversal in a downtrend. This signal occurs when a white candlestick with a body size exceeding a specified multiplier completely engulfs the previous black candlestick. The pattern will display a “BE” label below the candle if it meets the criteria, signaling potential upward momentum.
Bearish Engulfing Pattern: Indicates a potential bearish reversal in an uptrend. A black candlestick with a body size exceeding the specified multiplier fully engulfs the previous white candlestick, signaling possible downward movement. The “BE” label appears above the candle to denote this pattern.
Volume Impulse Up: Displays a “VI” label below the candle when the volume surpasses the defined multiplier, and the price closes higher than it opened, indicating strong upward buying interest.
Volume Impulse Down: Displays a “VI” label above the candle when the volume meets or exceeds the specified threshold, and the price closes lower than it opened, signaling strong selling pressure.
Indicator uses the SMA50 and SMA200 to determine trend direction due to their popularity in technical analysis as indicators of medium- and long-term trends. The SMA50 reflects the average price over the past 50 periods, providing insight into intermediate trends, while the SMA200 is often used to identify the broader trend direction. These SMAs help traders quickly assess whether the market is in an uptrend, downtrend, or consolidation phase, enhancing decision-making for both short-term and long-term strategies.
🔶 Disclaimer
Use with Caution: This indicator is provided for educational and informational purposes only and should not be considered as financial advice. Users should exercise caution and perform their own analysis before making trading decisions based on the indicator's signals.
Not Financial Advice: The information provided by this indicator does not constitute financial advice, and the creator (UAlgo) shall not be held responsible for any trading losses incurred as a result of using this indicator.
Backtesting Recommended: Traders are encouraged to backtest the indicator thoroughly on historical data before using it in live trading to assess its performance and suitability for their trading strategies.
Risk Management: Trading involves inherent risks, and users should implement proper risk management strategies, including but not limited to stop-loss orders and position sizing, to mitigate potential losses.
No Guarantees: The accuracy and reliability of the indicator's signals cannot be guaranteed, as they are based on historical price data and past performance may not be indicative of future results.

GOLDEN BULLETCandlestick Pattern Finder
Bullish Hammer
Bearish Hammer
Bullish Engulfing
Bearish Engulfing
Bullish Harami
Bearish Harami

Daily Engulfing Pattern DetectorThis indicator identifies bullish and bearish engulfing patterns on daily timeframes.
A bullish engulfing pattern occurs when a green candle completely engulfs the previous red candle,
taking out its low and closing above both its open and close prices. This suggests a potential trend reversal from bearish to bullish.
A bearish engulfing pattern occurs when a red candle completely engulfs the previous green candle,
taking out its high and closing below both its open and close prices. This suggests a potential trend reversal from bullish to bearish.
Features:
- Works on daily timeframe by default (customizable)
- Displays visual markers: green triangles for bullish patterns, red triangles for bearish patterns
- Includes built-in alerts for both pattern types
Set up alerts by right-clicking the indicator and selecting "Create Alert"
STANDARD DEVIATION INDICATOR BY WISE TRADERWISE TRADER STANDARD DEVIATION SETUP: The Ultimate Volatility and Trend Analysis Tool
Unlock the power of STANDARD DEVIATIONS like never before with the this indicator, a versatile and comprehensive tool designed for traders who seek deeper insights into market volatility, trend strength, and price action. This advanced indicator simultaneously plots three sets of customizable Deviations, each with unique settings for moving average types, standard deviations, and periods. Whether you’re a swing trader, day trader, or long-term investor, the STANDARD DEVIATION indicator provides a dynamic way to spot potential reversals, breakouts, and trend-following opportunities.
Key Features:
STANDARD DEVIATIONS Configuration : Monitor three different Bollinger Bands at the same time, allowing for multi-timeframe analysis within a single chart.
Customizable Moving Average Types: Choose from SMA, EMA, SMMA (RMA), WMA, and VWMA to calculate the basis of each band according to your preferred method.
Dynamic Standard Deviations: Set different standard deviation multipliers for each band to fine-tune sensitivity for various market conditions.
Visual Clarity: Color-coded bands with adjustable thicknesses provide a clear view of upper and lower boundaries, along with fill backgrounds to highlight price ranges effectively.
Enhanced Trend Detection: Identify potential trend continuation, consolidation, or reversal zones based on the position and interaction of price with the three bands.
Offset Adjustment: Shift the bands forward or backward to analyze future or past price movements more effectively.
Why Use Triple STANDARD DEVIATIONS ?
STANDARD DEVIATIONS are a popular choice among traders for measuring volatility and anticipating potential price movements. This indicator takes STANDARD DEVIATIONS to the next level by allowing you to customize and analyze three distinct bands simultaneously, providing an unparalleled view of market dynamics. Use it to:
Spot Volatility Expansion and Contraction: Track periods of high and low volatility as prices move toward or away from the bands.
Identify Overbought or Oversold Conditions: Monitor when prices reach extreme levels compared to historical volatility to gauge potential reversal points.
Validate Breakouts: Confirm the strength of a breakout when prices move beyond the outer bands.
Optimize Risk Management: Enhance your strategy's risk-reward ratio by dynamically adjusting stop-loss and take-profit levels based on band positions.
Ideal For:
Forex, Stocks, Cryptocurrencies, and Commodities Traders looking to enhance their technical analysis.
Scalpers and Day Traders who need rapid insights into market conditions.
Swing Traders and Long-Term Investors seeking to confirm entry and exit points.
Trend Followers and Mean Reversion Traders interested in combining both strategies for maximum profitability.
Harness the full potential of STANDARD DEVIATIONS with this multi-dimensional approach. The "STANDARD DEVIATIONS " indicator by WISE TRADER will become an essential part of your trading arsenal, helping you make more informed decisions, reduce risks, and seize profitable opportunities.
Who is WISE TRADER ?
Wise Trader is a highly skilled trader who launched his channel in 2020 during the COVID-19 pandemic, quickly building a loyal following. With thousands of paid subscribed members and over 70,000 YouTube subscribers, Wise Trader has become a trusted authority in the trading world. He is known for his ability to navigate significant events, such as the Indian elections and stock market crashes, providing his audience with valuable insights into market movements and volatility. With a deep understanding of macroeconomics and its correlation to global stock markets, Wise Trader shares informed strategies that help traders make better decisions. His content covers technical analysis, trading setups, economic indicators, and market trends, offering a comprehensive approach to understanding financial markets. The channel serves as a go-to resource for traders who want to enhance their skills and stay informed about key market developments.

Master Candle Breakout V1 Master Candle Breakout V1 - Indicator Description
The Master Candle Breakout V1 indicator is a powerful price action-based tool designed to help traders identify and capitalize on breakout opportunities from consolidation phases. This indicator is particularly useful for identifying master candles, which are large candles that encompass the range of subsequent candles, creating a key level of support or resistance. Once the price breaks above or below the range of the master candle, the indicator provides clear buy or sell signals, allowing traders to ride the momentum of the breakout.
Key Features:
Master Candle Detection: The indicator identifies master candles based on a user-defined period, marking them on the chart as critical breakout points.
Buy and Sell Signals: When the price breaks above the master candle's high, a buy signal is plotted. Similarly, when the price breaks below the master candle's low, a sell signal is generated. These signals are displayed on the chart with customizable shapes (diamonds, arrows, circles, crosses) and colors for easy visualization.
Stop-Loss Level Display: For risk management, the indicator calculates and plots a stop-loss level based on user-defined ticks above or below the master candle's high or low. The stop-loss value is shown as a label next to the signal, helping traders manage risk effectively.
Customizable Colors and Shapes: Users can fully customize the appearance of the signals, including the color of the buy/sell diamonds, the stop-loss label text color, and the type of shape used for the signals.
Versatile Application: The Master Candle Breakout V1 can be applied to any timeframe and market, from forex and stocks to commodities and cryptocurrencies, making it a highly versatile tool for traders of all types.
How to Use:
Master Candle Period: Define how many candles should follow the master candle for confirmation.
Stop Loss Ticks: Set the number of ticks above or below the master candle to define your stop-loss level.
Entry Signals: Once the price closes outside the high or low of the master candle, enter the trade accordingly (buy on breakouts above the high, sell on breakouts below the low).
Risk Management: Use the stop-loss level provided by the indicator to minimize losses and protect your capital.
This indicator is perfect for traders who prefer a simple, price-action-based strategy and want to avoid the clutter of traditional indicators. By focusing on the core principle of breakouts, Master Candle Breakout V1 helps traders quickly identify consolidation zones and potential breakout trades.

Judas Swing ICT 01 [TradingFinder] New York Midnight Opening M15🔵 Introduction
The Judas Swing (ICT Judas Swing) is a trading strategy developed by Michael Huddleston, also known as Inner Circle Trader (ICT). This strategy allows traders to identify fake market moves designed by smart money to deceive retail traders.
By concentrating on market structure, price action patterns, and liquidity flows, traders can align their trades with institutional movements and avoid common pitfalls. It is particularly useful in FOREX and stock markets, helping traders identify optimal entry and exit points while minimizing risks from false breakouts.
In today's volatile markets, understanding how smart money manipulates price action across sessions such as Asia, London, and New York is essential for success. The ICT Judas Swing strategy helps traders avoid common pitfalls by focusing on key movements during the opening time and range of each session, identifying breakouts and false breakouts.
By utilizing various time frames and improving risk management, this strategy enables traders to make more informed decisions and take advantage of significant market movements.
In the Judas Swing strategy, for a bullish setup, the price first touches the high of the 15-minute range of New York midnight and then the low. After that, the price returns upward, breaks the high, and if there’s a candlestick confirmation during the pullback, a buy signal is generated.
bearish setup, the price first touches the low of the range, then the high. With the price returning downward and breaking the low, if there’s a candlestick confirmation during the pullback to the low, a sell signal is generated.
🔵 How to Use
To effectively implement the Judas Swing strategy (ICT Judas Swing) in trading, traders must first identify the price range of the 15-minute window following New York midnight. This range, consisting of highs and lows, sets the stage for the upcoming movements in the London and New York sessions.
🟣 Bullish Setup
For a bullish setup, the price first moves to touch the high of the range, then the low, before returning upward to break the high. Following this, a pullback occurs, and if a valid candlestick confirmation (such as a reversal pattern) is observed, a buy signal is generated. This confirmation could indicate the presence of smart money supporting the bullish movement.
🟣 Bearish Setup
For a bearish setup, the process is the reverse. The price first touches the low of the range, then the high. Afterward, the price moves downward again and breaks the low. A pullback follows to the broken low, and if a bearish candlestick confirmation is seen, a sell signal is generated. This confirmation signals the continuation of the downward price movement.
Using the Judas Swing strategy enables traders to avoid fake breakouts and focus on strong market confirmations. The strategy is versatile, applying to FOREX, stocks, and other financial instruments, offering optimal trading opportunities through market structure analysis and time frame synchronization.
To execute this strategy successfully, traders must combine it with effective risk management techniques such as setting appropriate stop losses and employing optimal risk-to-reward ratios. While the Judas Swing is a powerful tool for predicting price movements, traders should remember that no strategy is entirely risk-free. Proper capital management remains a critical element of long-term success.
By mastering the ICT Judas Swing strategy, traders can better identify entry and exit points and avoid common traps from fake market movements, ultimately improving their trading performance.
🔵 Setting
Opening Range : High and Low identification time range.
Extend : The time span of the dashed line.
Permit : Signal emission time range.
🔵 Conclusion
The Judas Swing strategy (ICT Judas Swing) is a powerful tool in technical analysis that helps traders identify fake moves and align their trades with institutional actions, reducing risk and enhancing their ability to capitalize on market opportunities.
By leveraging key levels such as range highs and lows, fake breakouts, and candlestick confirmations, traders can enter trades with more precision. This strategy is applicable in forex, stocks, and other financial markets and, with proper risk management, can lead to consistent trading success.

E9 Shark-32 Pattern Strategy The E9 Shark-32 Pattern is a powerful trading tool designed to capitalize on the Shark-32 pattern—a specific Candlestick pattern.
The Shark-32 Pattern: What Is It?
The Shark-32 pattern is a technical formation that occurs when the following conditions are met:
Higher Highs and Lower Lows: The low of two bars ago is lower than the previous bar, and the previous bar's low is lower than the current bar. At the same time, the high of two bars ago is higher than the previous bar, and the previous bar’s high is higher than the current bar.
This unique setup forms the "Shark-32" pattern, which signals potential volume squeezes and trend changes in the market.
How Does the Strategy Work?
The E9 Shark-32 Pattern Strategy builds upon this pattern by defining clear entry and exit rules based on the pattern's confirmation. Here's a breakdown of how the strategy operates:
1. Identifying the Shark-32 Pattern
When the Shark-32 pattern is confirmed, the strategy "locks" the high and low prices from the initial bar of the pattern. These locked prices serve as key levels for future trade entries and exits.
2. Entry Conditions
The strategy waits for the price to cross the pattern's locked high or low, signaling potential market direction.
Long Entry: A long trade is triggered when the closing price crosses above the locked pattern high (green line).
Short Entry: A short trade is triggered when the closing price crosses below the locked pattern low (red line).
The strategy ensures that only one trade is taken for each Shark-32 pattern, preventing overtrading and allowing traders to focus on high-probability setups.
3. Stop Loss and Take Profit Levels
The strategy has built-in risk management through stop-loss and take-profit levels, which are visually represented by the lines on the chart:
Stop Loss:
Stop loss can be adjusted in settings.
Take Profit:
For long trades: The take-profit target is set at the upper white dotted line, which is projected above the pattern high.
For short trades: The take-profit target is set at the lower white dotted line, which is projected below the pattern low.
These clearly defined levels help traders to manage risk effectively while maximizing potential returns.
4. Visual Cues
To make trading decisions even easier, the strategy provides helpful visual cues:
Green Line (Pattern High): This line represents the high of the Shark-32 pattern and serves as a resistance level and short entry signal.
Red Line (Pattern Low): This line represents the low of the Shark-32 pattern and serves as a support level and long entry signal.
White Dotted Lines: These lines represent potential profit targets, projected both above and below the pattern. They help traders define where the market might go next.
Additionally, the strategy highlights the pattern formation with color-coded bars and background shading to draw attention to the Shark-32 pattern when it is confirmed. This adds a layer of visual confirmation, making it easier to spot opportunities in real-time.
5. No Repeated Trades
An important aspect of the strategy is that once a trade is taken (either long or short), no additional trades are executed until a new Shark-32 pattern is identified. This ensures that only valid and confirmed setups are acted upon.

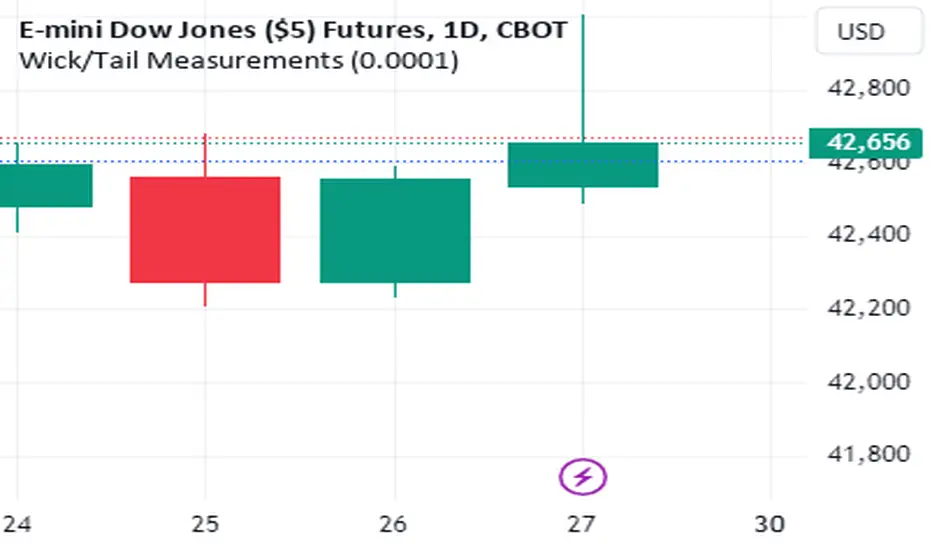
Wick/Tail Candle MeasurementsThis indicator runs on trading view. It was programmed with pine script v5.
Once the indicator is running you can scroll your chart to any year or date on the chart, then for the input select the date your interested in knowing the length of the tails and wicks from a bar and their lengths are measured in points.
To move the measurement, you can select the vertical bar built into the indicator AFTER clicking the green label and moving it around using the vertical bar *only*. You must click the vertical bar in the middle of the label to move the indicator calculation to another bar. You can also just select the date using the input as mentioned. This indicator calculates just one bar at a time.
measurements are from bar OPEN to bar HIGH for measured WICKS regardless of the bar being long or short and from bar OPEN to bar LOW for measured TAILS also regardless of the bar being long or short.
This indicator calculates tails and wicks including the bar body in the calculations. Basically showing you how much the market moved in a certain direction for the entire duration of that Doji candle.
Its designed to measure completed bars on the daily futures charts. (Dow Jones, ES&P500, Nasdaq, Russell 2000, etc) Although it may work well on other markets. The indicator could easily be tweaked in order to work well with other markets. It is not designed for forex markets currently.
E9 Shark-32 PatternUnderstanding the Shark-32 Pattern and its Trading Applications
The Shark-32 Pattern is a bearish technical trading formation used to predict market reversals or trend continuations. It highlights a downward move followed by a corrective rally, signaling a potential resumption of the downtrend. Here’s a breakdown of how it works:
What is the Shark-32 Pattern?
The Shark-32 pattern is a five-wave structure typically observed in bearish markets:
Wave 0 to X: A significant price decline starts the pattern.
Wave X to A: A correction pushes the price slightly upward.
Wave A to B: The price drops again but doesn’t reach the initial low.
Wave B to C: A final sharp decline concludes the pattern.
Once Wave C is formed, it suggests that the market will continue to move downward, presenting a potential selling or shorting opportunity.
Using the Pattern in Trading
This pattern is valuable for traders seeking high-probability bearish setups. The goal is to capitalize on the continuation of a downtrend following the corrective rally (X to A). Identifying the Shark-32 pattern helps anticipate the next wave of selling pressure.
Trading Setup
Identify a Shark-32 pattern.
If the price closes above the pattern's high, buy at the open the next day.
If the price closes below the pattern's low, short at the open the next day.
Sell/cover when the price moves 7% in the direction of the breakout.
Close the trade for a loss if the price moves 7% in the opposite direction.
For example, in a bull market after an upward breakout from a Shark-32, the net gain was $69.55. The method won 56% of the time with 5,218 winning trades and an average gain of $714.07. Conversely, 44% of trades were losers, with an average loss of $747.33. The average holding period was 26 calendar days.
The gains and losses were closely aligned with the 7% threshold set for this test.
Key Target Levels
To enhance the strategy, use dotted projection lines as target levels:
Upper Target: Drawn above the high of the corrective rally (Wave A). If the price breaks above this line, it may signal further upward movement, indicating a potentially weaker downtrend.
Lower Target: Positioned below the low of Wave C, providing a target for bearish trades.
These lines help determine future price targets and assist in setting take-profit or stop-loss levels.
Trading the Breakout
Look for breakouts once the Shark-32 pattern is identified:
Upward Breakout: If the price closes above the green line (high from two bars ago), it indicates a potential reversal to the upside.
Downward Breakout: If the price breaks below the red line (low from two bars ago), it confirms the bearish continuation.
Breakouts allow traders to adjust their positions based on market shifts.
Trading Tips
Continuation: The Shark-32 pattern acts as a continuation 60% of the time, confirming the ongoing trend.
Breakout Confirmation: Wait for the price to close above or below the pattern’s key levels before entering a trade.
Trade with the Trend: Since the Shark-32 is a continuation pattern, expect the breakout to align with the inbound price trend.
Symmetry: Patterns with symmetry often perform better. For more insights, refer to detailed trading literature.
Half-Staff: The Shark-32 can form midway in a trend, similar to flags and pennants.
Shark-32: Trading Performance
Based on an analysis of 23,369 trades, the following performance metrics were observed:
Bull Market with Upward Breakout: The average net profit was $69.55. This method won 56% of the time, with winning trades averaging $714.07. Losing trades, which constituted 44% of the total, had an average loss of $747.33. The average holding period was 26 calendar days.
Bull Market with Downward Breakout: The average net loss was $(76.36). This method won 43% of the time, with winning trades averaging $753.56. Losing trades, which constituted 57% of the total, had an average loss of $706.32. The average holding period was 23 calendar days.
Bear Market with Upward Breakout: The average net loss was $(89.13). This method won 46% of the time, with winning trades averaging $710.77. Losing trades, which constituted 54% of the total, had an average loss of $756.97. The average holding period was 16 calendar days.
Bear Market with Downward Breakout: The average net profit was $65.17. This method won 52% of the time, with winning trades averaging $781.62. Losing trades, which constituted 48% of the total, had an average loss of $722.41. The average holding period was 13 calendar days.
Heikin Ashi & Swing Highs/LowsHeikin Ashi & Swing Highs/Lows
Indicator Description:
The "Heikin Ashi & Swing Highs/Lows" indicator combines Heikin Ashi candle analysis with the identification of significant swing highs and lows on the chart. This indicator is useful for traders looking to spot trend changes and key points in the market.
Key Features:
Heikin Ashi:
Calculation and Visualization: Utilizes the Heikin Ashi method to smooth out the candlestick chart, helping to visualize trends and reduce market noise. Heikin Ashi candles are calculated from the standard candles (Open, High, Low, Close) and are displayed on the chart with a green color for bullish signals and red for bearish signals.
Vertical Offset Adjustment: Provides options to adjust the vertical offset of the candles based on the selected timeframe, with specific adjustments for short, medium, long, and super-long periods.
Swing Highs/Lows:
Key Point Identification: Marks significant swing highs and lows on the chart using a configurable period. Swing highs are displayed in red and swing lows in green.
Candlestick Patterns: Detects and labels common candlestick patterns such as:
Hammer: A bullish candlestick pattern with a small body and a long lower wick.
Inverted Hammer: Similar to the Hammer, but with a long upper wick.
Bullish Engulfing: A two-candle pattern where a bullish candle completely engulfs a previous bearish candle.
Hanging Man: A bearish pattern with a small body and a long lower wick, appearing at the end of an uptrend.
Shooting Star: A bearish pattern with a small body and a long upper wick, appearing at the end of an uptrend.
Bearish Engulfing: A two-candle pattern where a bearish candle completely engulfs a previous bullish candle.
Settings:
Timeframe: Allows you to select the desired timeframe to adjust the Heikin Ashi candle analysis.
Vertical Offset: Customize the vertical offset of Heikin Ashi candles based on the selected timeframe.
Swing Point Style: Configure the colors of the significant swing highs and lows on the chart.
Recommended Use:
This indicator is ideal for traders looking for a clear representation of trends through Heikin Ashi candles and who want to identify key reversal points in the market by detecting swing highs/lows and candlestick patterns.
Benefits:
Facilitates the identification of smooth trends and trend reversals.
Provides a clear visual representation of critical market points.
Helps traders recognize important candlestick patterns that may indicate changes in market direction.

Chronos Trend Level Oracle (CTLO)The Chronos Trend Level Oracle (CTLO) is a powerful technical analysis tool designed to identify significant trend levels that can act as support and resistance, helping traders navigate market trends and potential reversal points.
Key Components:
Setup Identification:
Bullish Setup: 9 consecutive closes lower than the close 4 bars earlier.
Bearish Setup: 9 consecutive closes higher than the close 4 bars earlier.
CTLO Support Level:
Established when a Bullish Setup completes.
Represents the lowest low of the CTLO Period (default 9 bars) preceding the Setup completion.
CTLO Resistance Level:
Established when a Bearish Setup completes.
Represents the highest high of the CTLO Period (default 9 bars) preceding the Setup completion.
Level Persistence:
A CTLO level remains active until an opposite Setup completes.
When a new Setup completes, it clears the opposite level.
Visual Representation:
Support levels are displayed as green circles.
Resistance levels are displayed as red circles.
Both use translucency for better chart visibility.
How to Use the CTLO:
Trend Identification:
The presence of a CTLO Support level suggests an underlying bullish trend.
The presence of a CTLO Resistance level suggests an underlying bearish trend.
The absence of either level indicates a possible trend transition or consolidation.
Support and Resistance:
Use CTLO levels as potential support (green) or resistance (red) areas.
These levels often act as price reaction points where bounces or rejections may occur.
Breakouts and Breakdowns:
A decisive close above a CTLO Resistance level could signal a bullish breakout.
A decisive close below a CTLO Support level could signal a bearish breakdown.
Use the optional alerts to be notified of these events.
Trend Continuation:
Price respecting a CTLO Support level can be seen as bullish, suggesting potential long entries.
Price respecting a CTLO Resistance level can be seen as bearish, suggesting potential short entries.
Reversal Anticipation:
As price approaches a CTLO level, watch for signs of reversal (e.g., candlestick patterns, divergences).
Failed breakouts/breakdowns at CTLO levels can lead to strong moves in the opposite direction.
Multiple Timeframe Analysis:
Apply CTLO on different timeframes for a more comprehensive market view.
Higher timeframe CTLO levels often carry more significance.
Combine with Price Action:
Look for candlestick patterns or chart formations near CTLO levels for higher probability setups.
Double tops/bottoms or other reversal patterns at CTLO levels can be particularly significant.
Risk Management:
Use CTLO levels to set stop-loss orders or profit targets.
For breakout trades, consider using the CTLO level as a new stop-loss after the breakout occurs.
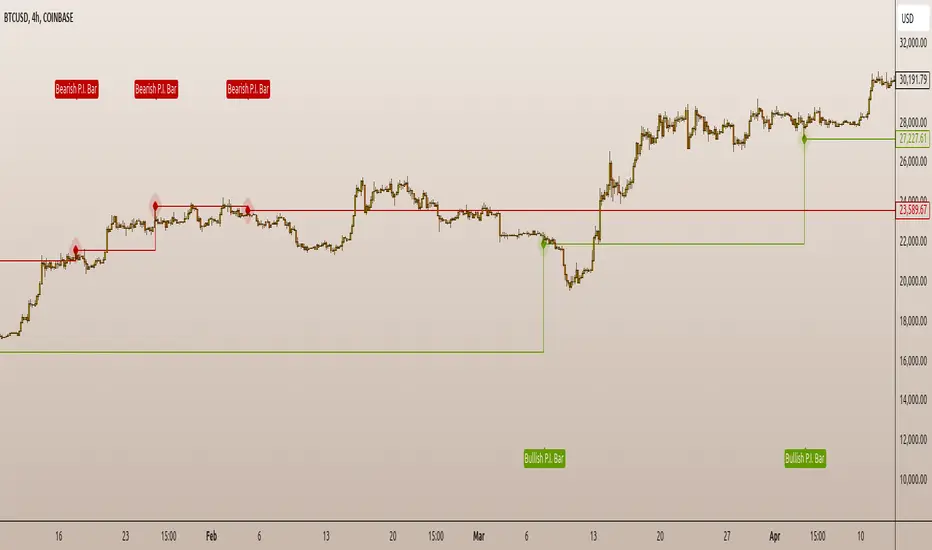
P.I.B. System (Pin Bar | Inside Bar) // AlgoFyreThe "P.I.B. System (Pin Bar | Inside Bar)" identifies bullish and bearish pin bars and inside bars on a price chart. It highlights potential market reversals by plotting labels and colorizing bars, providing traders with visual cues for better decision-making.
Description
The "P.I.B. System (Pin Bar | Inside Bar)" script is designed to help traders identify potential reversal points in the market by detecting bullish and bearish pin bars and inside bars. A pin bar is a candlestick pattern that indicates a potential reversal, characterized by a small body and a long wick. Inside bars are candlestick patterns where the current bar's high and low are within the previous bar's range, indicating potential consolidation before a breakout.
This script allows customization of various parameters to fine-tune the identification of pin bars and inside bars. When a pin bar or an inside bar is detected, the script plots a label on the chart and colorizes the bars to highlight these patterns. This tool is useful for traders looking to identify potential reversal points and make informed trading decisions.
Explanation of All Options
Pin-Wick Size Ratio Minimum Value : The minimum ratio of the wick size to the total candle size for a pin bar to be considered valid. Default is 0.66.
Candle Body Size Ratio Maximum Value : The maximum ratio of the body size to the total candle size for a pin bar to be considered valid. Default is 0.4.
Handle-Wick Wick Size Ratio Maximum Value : The maximum ratio of the opposite wick size to the total candle size for a pin bar to be considered valid. Default is 0.4.
Filter Out Small Candles : Option to filter out small candles based on the previous candle's size. Default is true.
Small Candle Size Ratio : The ratio used to determine if a candle is considered small compared to the previous candle. Default is 2.0.
Identify Inside Bars : Option to identify inside bars following a pin bar. Default is true.
Show Only P.I.B. : Option to show only the bars where a pin bar is followed by an inside bar. Default is true.
Hide Horizontal Rays : Option to hide horizontal rays drawn from the last identified pin bars. Default is false.
How to Use
To use this script, add it to your chart. Customize the input parameters to match your trading strategy. The script will automatically identify and highlight bullish and bearish pin bars and inside bars on the chart. Use the visual cues provided by the labels and colorized bars to make informed trading decisions.