SNP420/TRCS_MASTERMicro Body Candle Highlighter is a visual tool for TradingView that continuously scans the active timeframe and highlights all candles with an extremely small body.
For every bar (including the currently forming one), the indicator compares the absolute distance between Open and Close to a user-defined threshold in ticks (default: 1 tick, based on syminfo.mintick).
If the candle’s body size is less than or equal to this threshold, the indicator draws a red frame around the candle – either around the body only or the full high-to-low range, depending on user settings.
Optionally, the indicator can also trigger alerts whenever such a “micro body” candle is detected, allowing traders to react immediately to potential indecision, pauses, or micro-reversals in price action.
author: SNP_420
project: FNXS
ps: Piece and love
Candlesticksignals

HTF Control Shift + Prev Candle Break Sequence 🧭 HTF Control Shift + Previous Candle Break Sequence
Overview
The HTF Control Shift + Previous Candle Break Sequence indicator identifies high-probability shift candles that suggest a potential change in market control — from sellers to buyers or vice versa — and then tracks whether price confirms that shift by breaking the previous candle’s high or low.
This tool is designed to help traders detect institutional control shifts and confirm them with price structure breaks, providing a framework for spotting early trend reversals or strong continuation moves.
How It Works
Control Shift Candle Detection
A Bullish Control Shift occurs when a candle shows:
A long lower wick (≥ Wick % Threshold of total range).
A close near the high (within Body % Threshold of the top).
A Bearish Control Shift occurs when a candle shows:
A long upper wick (≥ Wick % Threshold of total range).
A close near the low (within Body % Threshold of the bottom).
These candles are highlighted in green (bullish) or red (bearish), and optionally labeled on the chart.
Previous Candle High/Low Tracking
The script automatically plots horizontal lines at the previous candle’s high (green) and low (red).
These act as key reference levels for breakout confirmation.
Breakout Confirmation Sequence
A Bullish Sequence triggers when a Bullish Control Shift candle is followed by a break above the previous candle’s high.
A Bearish Sequence triggers when a Bearish Control Shift candle is followed by a break below the previous candle’s low.
When either sequence completes, the indicator can send a TradingView alert confirming the directional breakout.
How to Use
Timeframe:
Optimized for higher timeframes (1H, 4H, Daily) to filter out intraday noise and identify structural market shifts.
Trend Reversal Identification:
Watch for Control Shift candles at major highs/lows, order blocks, or liquidity zones — a confirmed breakout often signals a trend reversal or new directional push.
Continuation Confirmation:
In trending markets, a Control Shift candle that breaks in the direction of trend can validate a strong continuation setup.
Alert Usage:
Set alerts for:
Bullish Control Shift Confirmed Breakout
Bearish Control Shift Confirmed Breakdown
Optional: raw Control Shift or Break alerts.
Customization
Wick % Threshold: Adjusts the required wick size to define a control shift.
Body % Threshold: Controls how close the close must be to the high/low for confirmation.
Label Toggle: Optionally display labels only on control shift candles.
Best Practices
Combine with higher-timeframe trend filters.
Avoid using it alone in tight consolidation zones.
Strongest signals occur when:
Control Shift appears at key structure levels.
The breakout bar closes firmly beyond the previous high/low.
Volume supports the breakout.
Summary
✅ Detects when market control flips (buyers ↔ sellers).
✅ Confirms shift with breakout above/below previous candle.
✅ Ideal for 1H–4H swing or position trading.
✅ Provides visual, structural, and alert-based confirmation.

3D Candles (Zeiierman)█ Overview
3D Candles (Zeiierman) is a unique 3D take on classic candlesticks, offering a fresh, high-clarity way to visualize price action directly on your chart. Visualizing price in alternative ways can help traders interpret the same data differently and potentially gain a new perspective.
█ How It Works
⚪ 3D Body Construction
For each bar, the script computes the candle body (open/close bounds), then projects a top face offset by a depth amount. The depth is proportional to that candle’s high–low range, so it looks consistent across symbols with different prices/precisions.
rng = math.max(1e-10, high - low ) // candle range
depthMag = rng * depthPct * factorMag // % of range, shaped by tilt amount
depth = depthMag * factorSign // direction from dev (up/down)
depthPct → how “thick” the 3D effect is, as a % of each candle’s own range.
factorMag → scales the effect based on your tilt input (dev), with a smooth curve so small tilts still show.
factorSign → applies the direction of the tilt (up or down).
⚪ Tilt & Perspective
Tilt is controlled by dev and translated into a gentle perspective factor:
slope = (4.0 * math.abs(dev)) / width
factorMag = math.pow(math.min(1.0, slope), 0.5) // sqrt softens response
factorSign = dev == 0 ? 0.0 : math.sign(dev) // direction (up/down)
Larger dev → stronger 3D presence (up to a cap).
The square-root curve makes small dev values noticeable without overdoing it.
█ How to Use
Traders can use 3D Candles just like regular candlesticks. The difference is the 3D visualization, which can broaden your view and help you notice price behavior from a fresh perspective.
⚪ Quick setup (dual-view):
Split your TradingView layout into two synchronized charts.
Right pane: keep your standard candlestick or bar chart for live execution.
Left pane: add 3D Candles (Zeiierman) to compare the same symbol/timeframe.
Observe differences: the 3D rendering can make expansion/contraction and body emphasis easier to spot at a glance.
█ Go Full 3D
Take the experience further by pairing 3D Candles (Zeiierman) with Volume Profile 3D (Zeiierman) , a perfect complement that shows where activity is concentrated, while your 3D candles show how the price unfolded.
█ Settings
Candles — How many 3D candles to draw. Higher values draw more shapes and may impact performance on slower machines.
Block Width (bars) — Visual thickness of each 3D candle along the x-axis. Larger values look chunkier but can overlap more.
Up/Down — Controls the tilt and strength of the 3D top face.
3D depth (% of range) — Thickness of the 3D effect as a percentage of each candle’s own high–low range. Larger values exaggerate the depth.
-----------------
Disclaimer
The content provided in my scripts, indicators, ideas, algorithms, and systems is for educational and informational purposes only. It does not constitute financial advice, investment recommendations, or a solicitation to buy or sell any financial instruments. I will not accept liability for any loss or damage, including without limitation any loss of profit, which may arise directly or indirectly from the use of or reliance on such information.
All investments involve risk, and the past performance of a security, industry, sector, market, financial product, trading strategy, backtest, or individual's trading does not guarantee future results or returns. Investors are fully responsible for any investment decisions they make. Such decisions should be based solely on an evaluation of their financial circumstances, investment objectives, risk tolerance, and liquidity needs.

Cnagda Pure Price ActionCnagda Pure Price Action (CPPA) indicator is a pure price action-based system designed to provide traders with real-time, dynamic analysis of the market. It automatically identifies key candles, support and resistance zones, and potential buy/sell signals by combining price, volume, and multiple popular trend indicators.
How Price Action & Volume Analysis Works
Silver Zone – Logic, Reason, and Trade Planning
Logic & Visualization:
The Silver Zone is created when the closing price is the lowest in the chosen window and volume is the highest in that window.
Visually, a large silver-colored box/rectangle appears on the chart.
Thick horizontal lines (top and bottom) are drawn at the high and low of that candle/bar, extending to the right.
Reasoning:
This combination typically occurs at strong “accumulation” or support areas:
Sellers push the price down to the lowest point, but aggressive buyers step in with high volume, absorbing supply.
Indicates potential exhaustion of selling and likely shift in market control to buyers.
How to Plan Trades Using Silver Zone:
Watch if price returns to the Silver Zone in the future: It often acts as powerful support.
Bullish entries (buys) can be planned when price tests or slightly pierces this zone, especially if new buy signals occur (like yellow/green candle labels).
Place your stop-loss below the bottom line of the Silver Zone.
Target: Look for the nearest resistance or opposing zone, or use indicator’s bullish label as confirmation.
Extra Tip:
Multiple touches of the Silver Zone reinforce its importance, but if price closes deeply below it with high volume, that’s a caution signal—support may be breaking.
Black Zone – Logic, Reason, and Trade Planning (as CPPA):
Logic & Visualization:
The Black Zone is created when the closing price is the highest in the chosen window and volume is the lowest in that window.
Visually, a large black-colored box/rectangle appears on the chart, along with thick horizontal lines at the top (high) and bottom (low) of the candle, extending to the right.
Reasoning:
This combination signals a strong “distribution” or resistance area:
Buyers push the price up to a local high, but low volume means there is not much follow-through or conviction in the move.
Often marks exhaustion where uptrend may pause or reverse, as sellers can soon step in.
How to Plan Trades Using Black Zone:
If price revisits the Black Zone in the future, it often acts as major resistance.
Bearish entries (sells) are considered when price is near, testing, or slightly above the Black Zone—especially if new sell signals appear (like blue/red candle labels).
Place your stop-loss just above the top line of the Black Zone.
Target: Nearest support zone (such as a Silver Zone) or next indicator’s bearish label.
Extra Tip:
Multiple touches of the Black Zone make it stronger, but if price closes far above with rising volume, be cautious—resistance might be breaking.
Support Line – Logic, Reason, and Trade Planning (as Cppa):
Logic & Visualization:
The Support Line is a dynamically drawn dashed line (usually blue) that marks key price levels where the market has previously shown significant buying interest.
The line is generated whenever a candle forms a high price with high volume (orange logic).
The script checks for historical pivot lows, past support zones, and even higher timeframe (HTF) supports, and then extends a blue dashed line from that price level to the right, labeling it (sometimes as “Prev Support Orange, HTF”).
Reasoning:
This line helps you visually identify where demand has been strong enough to hold price from falling further—essentially a floor in the market used by professional traders.
If price approaches or re-tests this line, there’s a good chance buyers will defend it again.
How to Plan Trades Using Support Line:
Watch for price to approach the Support Line during down moves. If you see a bullish candlestick pattern, buy labels (yellow/green), or other indicators aligning, this can be a high-probability entry zone.
Great for planning stop-loss for long trades: place stops just below this line.
Target: Next resistance zone, Black Zone, or the top of the last swing.
Extra Tip:
Multiple confirmations (support line + Silver Zone + bullish label) provide powerful entry signals.
If price closes strongly below the Support Line with volume, be cautious—support may be breaking, and a trend reversal or deeper correction could follow.
Resistance Line – Logic, Reason, and Trade Planning (from CPPA):
Logic & Visualization:
The Resistance Line is a dynamically drawn dashed line (usually purple or red) that identifies price levels where the market has previously faced significant selling pressure.
This line is created when a candle reaches a high price combined with high volume (orange logic), or from a historical pivot high/resistance,
The script also tracks higher timeframe (HTF) resistance lines, labeled as “Prev Resistance Orange, HTF,” and extends these dashed lines to the right across the chart.
Reasoning:
Resistance Lines are visual markers of “supply zones,” where buyers previously failed, and sellers took control.
If the price returns to this line later, sellers may get active again to defend this level, halting the uptrend.
How to Plan Trades Using Resistance Line:
Watch for price to approach the Resistance Line during up moves. If you see bearish candlestick patterns, sell labels (blue/red), or bearish indicator confirmation, this becomes a strong shorting opportunity.
Perfect for placing stop-loss in short trades—put your stop just above the Resistance Line.
Target: Next support zone (Silver Zone) or bottom of the last swing.
If the price breaks above with high volume, avoid shorting—resistance may be failing.
Extra Tip:
Multiple resistances (Resistance Line + Black Zone + bearish label) make short signals stronger.
Choppy movement around this line often signals indecision; wait for a clear rejection before entering trades.
Bullish / Bearish Label – Logic, Reason, and Trade Planning:
Logic & Visualization:
The indicator constantly calculates a "Bull Score" and a "Bear Score" based on several factors:
Trend direction from price slope
Confirmation by popular indicators (RSI, ADX, SAR, CMF, OBV, CCI, Bollinger Bands, TWAP)
Adaptive scoring (higher score for each bullish/bearish condition met)
If Bull Score > Bear Score, the chart displays a green "BULLISH" label (usually below the bar).
If Bear Score > Bull Score, the chart displays a red "BEARISH" label (usually above the bar).
If neither dominates, a "NEUTRAL" label appears.
Reasoning:
The labels summarize complex price action and indicator analysis into a simple, actionable sentiment cue:
Bullish: Majority of conditions indicate buying strength; trend is up.
Bearish: Majority signals show selling pressure; trend is down.
How to Use in Trade Planning:
Use the Bullish label as confirmation to enter or hold long (buy) positions, especially if near support/Silver Zone.
Use the Bearish label to enter/hold short (sell) positions, especially if near resistance/Black Zone.
For best results, combine with candle color, volume analysis, or other labels (yellow/green for buys, blue/red for sells).
Avoid trading against these labels unless you have strong confluence from zones/support levels.
Yellow Label (Buy Signal) – Logic, Reason & Trade Planning:
Logic & Visualization:
The yellow label appears below a candle (label.style_label_up, yloc.belowbar) and marks a potential buy signal.
Script conditions:
The candle must be a “yellow candle” (which means it’s at the local lowest close, not a high, with normal volume).
Volume is decreasing for 2 consecutive candles (current volume < previous volume, previous volume < second previous).
When these conditions are met, a yellow label is plotted below the candle.
Reasoning:
This scenario often marks the end of selling pressure and start of possible accumulation—buyers may be stepping in as sellers exhaust.
Decreasing volume during a local price low means selling is slowing, possibly hinting at a reversal.
How to Trade Using Yellow Label:
Entry: Consider buying at/just above the yellow-labeled candle’s close.
Stop-loss: A bit below the candle’s low (or Silver Zone line, if present).
Target: Next resistance level, Black Zone, or chart’s bullish label.
Extra Tip:
If the yellow label is found at/near a Silver Zone or Support Line, and trend is “Bullish,” the setup gets even stronger.
Avoid trading if overall indicator shows “Bearish.”
Green Label (Buy with Increasing Volume) – Logic, Reason & Trade Planning:
Logic & Visualization:
The green label is plotted below a candle (label.style_label_up, yloc.belowbar) and marks a strong buy signal.
Script conditions:
The candle must be a “yellow candle” (at the local lowest close, normal volume).
Volume is increasing for 2 consecutive candles (current volume > previous volume, previous volume > second previous).
When these conditions are met, a green label is plotted below the candle.
Reasoning:
This scenario signals that buyers are stepping in aggressively at a local price low—the end of a downtrend with strong, rising activity.
Increasing volume at a price low is a classic sign of accumulation, where institutions or large players may be buying.
How to Trade Using Green Label:
Entry: Consider buying at/just above the green-labeled candle’s close for a momentum-based reversal.
Stop-loss: Slightly below the candle’s low, or the Silver Zone/support line if present.
Target: Nearest resistance zone/Black Zone, indicator’s bullish label, or next swing high.
Extra Tip:
If the green label is near other supports (Silver Zone, Support Line), the setup is extra strong.
Use confirmation from Bullish labels or trend signals for best results.
Green label setups are suitable for quick, high momentum trades due to increasing volume
Blue Label (Sell Signal on Decreasing Volume) – Logic, Reason & Trade Planning:
Logic & Visualization:
The blue label is plotted above a candle (label.style_label_down, yloc.abovebar) as a potential sell signal.
Script conditions:
The candle is a “blue candle” (local highest close, but not also lowest, and volume is neither highest nor lowest).
Volume is decreasing over 2 consecutive candles (current volume < previous, previous < two ago).
When these match, a blue label appears above the candle.
Reasoning:
This typically signals buyer exhaustion at a local high: price has gone up, but volume is dropping, suggesting big players may not be buying any more at these levels.
The trend is losing strength, and a reversal or pullback is likely.
How to Trade Using Blue Label:
Entry: Look to sell at/just below the candle with the blue label.
Stop-loss: Just above the candle’s high (or above the Black Zone/resistance if present).
Target: Nearest support, Silver Zone, or a swing low.
Extra Tip:
Blue label signals are stronger if they appear near Black Zones or Resistance Lines, or when the general market label is "Bearish."
As with buy setups, always check for confirmation from trend or volume before trading aggressively.
Here’s a summary of all key chart labels, zones, and trading logic of your Price Action script:
Silver Zone: Powerful support zone. Created at lowest close + highest volume. Best for buy entries near its lines.
Black Zone: Strong resistance zone. Created at highest close + lowest volume. Ideal for short trades near its levels.
Support Line: Blue dashed line at historical demand; buyers defend here. Look for bullish setups when price approaches.
Resistance Line: Purple/red dashed line at supply; sellers defend here. Great for bearish setups when price nears.
Bullish/Bearish Labels: Summarize trend direction using price action + multiple indicator confirmations. Plan buys, holds on bullish; sells, shorts on bearish.
Yellow Label: Buy signal on decreasing volume and local price low. Entry above candle, stop below, target next resistance.
Green Label: Strong buy on increasing volume at a price low. Entry for momentum trade, stop below, target next zone.
Blue Label: Sell signal on dropping volume and local price high. Entry below candle, stop above, target next support.
Best Practices:
Always combine zone/label signals for higher probability trades.
Use stop-loss near zones/lines for risk management.
Prefer trading in the trend direction (bullish/bearish label agrees with your entry).
if Any Question, Suggestion Feel free to ask
Disclaimer:
All information provided by this indicator is for educational and analysis purposes only, and should not be considered financial advice.

CFR - Candle Formation RatioDescription
This indicator is designed to detect candles with small bodies and significant wick-to-body ratios, often useful for identifying doji-like structures and potential accumulation areas.
Features
Filter candles by maximum body size (% of the total candle range).
Require that wicks are at least X times larger than the body.
Define the position of the body within the candle (e.g., body must be between 40% and 60% of the candle height).
Visual output: a single arrow marker when conditions are met.
Fully customizable marker color and size.
⚠️ Note: The settings of this version are currently in Turkish. An English version of the settings will be released in the future.

Strong Body Close Candle (90%)This indicator highlights Strong Body Close Candles, which are single bars where the real body makes up the vast majority of the total range and the close is positioned very close to the candle’s extreme. By default, the script looks for candles where the body is at least 90% of the full high-low range, and the close falls within the top 10% (for bullish) or bottom 10% (for bearish). These settings ensure that only very strong, conviction-driven candles are marked. The script plots labels above or below qualifying bars, colors the candle accordingly, and provides alert conditions so you can be notified in real time when such a candle forms.
Both percentages are fully adjustable so you can fine-tune the strictness of the definition. For example, if you change the body threshold to 85% and the close-to-extreme threshold to 15%, the script will highlight candles where the body makes up at least 85% of the total range and the close is within 15% of the high or low. This adjustment allows for a slightly looser definition, catching more frequent signals while still maintaining strength criteria. Built-in alerts let you choose between bullish and bearish signals separately (or both), ensuring you won’t miss setups even when you’re away from the chart.
This tool is flexible across timeframes and instruments. On lower timeframes, signals may appear more frequently, highlighting intraday momentum bursts, while on higher timeframes such as daily or weekly charts, these signals often represent periods of strong directional conviction. Traders can combine this indicator with additional filters such as trend direction, volume confirmation, VWAP, or moving averages to improve reliability and fit it into their broader strategy. Because the body and close thresholds are user-defined, you have control over whether the indicator is tuned to rare but powerful candles (stricter settings) or more frequent signals (looser settings).
The indicator is designed to be non-repainting since it only evaluates candles after they close. It can be used purely visually with chart labels and bar coloring or as part of an automated workflow with TradingView alerts. Alerts are triggered on bar close whenever a bullish or bearish strong body close candle is detected, allowing you to integrate them into your trading process via pop-ups, emails, mobile notifications, or webhooks. Whether you’re looking for sharp reversals, momentum continuation signals, or simply want to filter out weaker candles, this tool provides a clear and adjustable framework for identifying high-conviction bars.

Intrabar Volume Delta — RealTime + History (Stocks/Crypto/Forex)Intrabar Volume Delta Grid — RealTime + History (Stocks/Crypto/Forex)
# Short Description
Shows intrabar Up/Down volume, Delta (absolute/relative) and UpShare% in a compact grid for both real-time and historical bars. Includes an MTF (M1…D1) dashboard, contextual coloring, density controls, and alerts on Δ and UpShare%. Smart historical splitting (“History Mode”) for Crypto/Futures/FX.
---
# What it does (Quick)
* **UpVol / DownVol / Δ / UpShare%** — visualizes order-flow inside each candle.
* **Real-time** — accumulates intrabar volume live by tick-direction.
* **History Mode** — splits Up/Down on closed bars via simple or range-aware logic.
* **MTF Dashboard** — one table view across M1, M5, M15, M30, H1, H4, D1 (Vol, Up/Down, Δ%, Share, Trend).
* **Contextual opacity** — stronger signals appear bolder.
* **Label density** — draw every N-th bar and limit to last X bars for performance.
* **Alerts** — thresholds for |Δ|, Δ%, and UpShare%.
---
# How it works (Real-Time vs History)
* **Real-time (open bar):** volume increments into **UpVolRT** or **DownVolRT** depending on last price move (↑ goes to Up, ↓ to Down). This approximates live order-flow even when full tick history isn’t available.
* **History (closed bars):**
* **None** — no split (Up/Down = 0/0). Safest for equities/indices with unreliable tick history.
* **Approx (Close vs Open)** — all volume goes to candle direction (green → Up 100%, red → Down 100%). Fast but yields many 0/100% bars.
* **Price Action Based** — splits by Close position within High-Low range; strength = |Close−mid|/(High−Low). Above mid → more Up; below mid → more Down. Falls back to direction if High==Low.
* **Auto** — **Stocks/Index → None**, **Crypto/Futures/FX → Approx**. If you see too many 0/100 bars, switch to **Price Action Based**.
---
# Rows & Meaning
* **Volume** — total bar volume (no split).
* **UpVol / DownVol** — directional intrabar volume.
* **Delta (Δ)** — UpVol − DownVol.
* **Absolute**: raw units
* **Relative (Δ%)**: Δ / (Up+Down) × 100
* **Both**: shows both formats
* **UpShare%** — UpVol / (Up+Down) × 100. >50% bullish, <50% bearish.
* Helpful icons: ▲ (>65%), ▼ (<35%).
---
# MTF Dashboard (🔧 Enable Dashboard)
A single table with **Vol, Up, Down, Δ%, Share, Trend (🔼/🔽/⏭️)** for selected timeframes (M1…D1). Great for a fast “panorama” read of flow alignment across horizons.
---
# Inputs (Grouped)
## Display
* Toggle rows: **Volume / Up / Down / Delta / UpShare**
* **Delta Display**: Absolute / Relative / Both
## Realtime & History
* **History Mode**: Auto / None / Approx / Price Action Based
* **Compact Numbers**: 1.2k, 1.25M, 3.4B…
## Theme & UI
* **Theme Mode**: Auto / Light / Dark
* **Row Spacing**: vertical spacing between rows
* **Top Row Y**: moves the whole grid vertically
* **Draw Guide Lines**: faint dotted guides
* **Text Size**: Tiny / Small / Normal / Large
## 🔧 Dashboard Settings
* **Enable Dashboard**
* **📏 Table Text Size**: Tiny…Huge
* **🦓 Zebra Rows**
* **🔲 Table Border**
## ⏰ Timeframes (for Dashboard)
* **M1…D1** toggles
## Contextual Coloring
* **Enable Contextual Coloring**: opacity by signal strength
* **Δ% cap / Share offset cap**: saturation caps
* **Min/Max transparency**: solid vs faint extremes
## Label Density & Size
* **Show every N-th bar**: draw labels only every Nth bar
* **Limit to last X bars**: keep labels only in the most recent X bars
## Colors
* Up / Down / Text / Guide
## Alerts
* **Delta Threshold (abs)** — |Δ| in volume units
* **UpShare > / <** — bullish/bearish thresholds
* **Enable Δ% Alert**, **Δ% > +**, **Δ% < −** — relative delta levels
---
# How to use (Quick Start)
1. Add the indicator to your chart (overlay=false → separate pane).
2. **History Mode**:
* Crypto/Futures/FX → keep **Auto** or switch to **Price Action Based** for richer history.
* Stocks/Index → prefer **None** or **Price Action Based** for safer splits.
3. **Label Density**: start with **Limit to last X bars = 30–150** and **Show every N-th bar = 2–4**.
4. **Contextual Coloring**: keep on to emphasize strong Δ% / Share moves.
5. **Dashboard**: enable and pick only the TFs you actually use.
6. **Alerts**: set thresholds (ideas below).
---
# Alerts (in TradingView)
Add alert → pick this indicator → choose any of:
* **Delta exceeds threshold** (|Δ| > X)
* **UpShare above threshold** (UpShare% > X)
* **UpShare below threshold** (UpShare% < X)
* **Relative Delta above +X%**
* **Relative Delta below −X%**
**Starter thresholds (tune per symbol & TF):**
* **Crypto M1/M5**: Δ% > +25…35 (bullish), Δ% < −25…−35 (bearish)
* **FX (tick volume)**: UpShare > 60–65% or < 40–35%
* **Stocks (liquid)**: set **Absolute Δ** by typical volume scale (e.g., 50k / 100k / 500k)
---
# Notes by Market Type
* **Crypto/Futures**: 24/7 and high liquidity — **Price Action Based** often gives nicer history splits than Approx.
* **Forex (FX)**: TradingView volume is typically **tick volume** (not true exchange volume). Treat Δ/Share as tick-based flow, still very useful intraday.
* **Stocks/Index**: historical tick detail can be limited. **None** or **Price Action Based** is a safer default. If you see too many 0/100% shares, switch away from Approx.
---
# “All Timeframes” accuracy
* Works on **any TF** (M1 → D1/W1).
* **Real-time accuracy** is strong for the open bar (live accumulation).
* **Historical accuracy** depends on your **History Mode** (None = safest, Approx = fastest/simplest, Price Action Based = more nuanced).
* The MTF dashboard uses `request.security` and therefore follows the same logic per TF.
---
# Trade Ideas (Use-Cases)
* **Scalping (M1–M5)**: a spike in Δ% + UpShare>65% + rising total Vol → momentum entries.
* **Intraday (M5–M30–H1)**: when multiple TFs show aligned Δ%/Share (e.g., M5 & M15 bullish), join the trend.
* **Swing (H4–D1)**: persistent Δ% > 0 and UpShare > 55–60% → structural accumulation bias.
---
# Advantages
* **True-feeling live flow** on the open bar.
* **Adaptable history** (three modes) to match data quality.
* **Clean visual layout** with guides, compact numbers, contextual opacity.
* **MTF snapshot** for quick bias read.
* **Performance controls** (last X bars, every N-th bar).
---
# Limitations & Care
* **FX uses tick volume** — interpret Δ/Share accordingly.
* **History Mode is an approximation** — confirm with trend/structure/liquidity context.
* **Illiquid symbols** can produce noisy or contradictory signals.
* **Too many labels** can slow charts → raise N, lower X, or disable guides.
---
# Best Practices (Checklist)
* Crypto/Futures: prefer **Price Action Based** for history.
* Stocks: **None** or **Price Action Based**; be cautious with **Approx**.
* FX: pair Δ% & UpShare% with session context (London/NY) and volatility.
* If labels overlap: tweak **Row Spacing** and **Text Size**.
* In the dashboard, keep only the TFs you actually act on.
* Alerts: start around **Δ% 25–35** for “punchy” moves, then refine per asset.
---
# FAQ
**1) Why do some closed bars show 0%/100% UpShare?**
You’re on **Approx** history mode. Switch to **Price Action Based** for smoother splits.
**2) Δ% looks strong but price doesn’t move — why?**
Δ% is an **order-flow** measure. Price also depends on liquidity pockets, sessions, news, higher-timeframe structure. Use confirmations.
**3) Performance slowdown — what to do?**
Lower **Limit to last X bars** (e.g., 30–100), increase **Show every N-th bar** (2–6), or disable **Draw Guide Lines**.
**4) Dashboard values don’t “match” the grid exactly?**
Dashboard is multi-TF via `request.security` and follows the history logic per TF. Differences are normal.
---
# Short “Store” Marketing Blurb
Intrabar Volume Delta Grid reveals the order-flow inside every candle (Up/Down, Δ, UpShare%) — live and on history. With smart history splitting, an MTF dashboard, contextual emphasis, and flexible alerts, it helps you spot momentum and bias across Crypto, Forex (tick volume), and Stocks. Tidy labels and compact numbers keep the panel readable and fast.

Balanced Big Wicks (50/50) HighlighterThis open-source indicator highlights candles with balanced long wicks (50/50 style)—that is, candles where both upper and lower shadows are each at least 30–60% of the full range and within ~8% of each other, while retaining a substantial body. This specific structure often reflects indecision or liquidity sweeps and can precede strong breakout moves.
How It Works (Inputs and Logic)
Min wick % (each side): 30–60% of candle range
Max body %: up to 60% of range (preserves strong body presence)
Equality tolerance: wicks within 8% of each other
ATR filter (multiples of ATR14): ensures only significant-range candles are flagged
When a “50/50” candle forms, it’s visually colored and labeled; audibly alertable.
How to Use It
Long setup: price closes above the wick-high → potential long entry (SL below wick-low, TP = 1:1).
Short setup: price closes below wick-low → potential short entry (SL above wick-high, TP = 1:1).
Especially effective on 5–15 minute scalping charts when aligned with high-volume sessions or HTF trend context.
Why This Indicator Is Unique
Unlike standard wick or doji voters, this script specifically filters for candles with a strong body and symmetrical wicks, paired with a range filter, reducing noise significantly.
Important Notes
No unrealistic claims: backtested setups indicate high occurrence of clean breakouts, though performance depends on market structure.
Script built responsibly: uses real-time calculations only, no future-data lookahead.
Visuals on the published chart reflect default input values exactly.

Cnagda Liquidit Trading SystemCnagda Liquidit Trading System helps spot where price is likely to trap traders and reverse, then gives simple, actionable Level to entry, place SL, and take profits with confidence. It blends imbalance zones, trend bias, order blocks, liquidity pools, high-probability fake Signal, and context-aware candle patterns into one clean workflow.
🟩🟥 Imbalance boxes: “Crowd rushed, gaps left”
What it is: Green/red boxes mark fast, one-sided moves where price “skipped” orders—think FVG-like zones that often get revisited.
Why it helps: Price frequently pulls back to “fill” these zones, creating clean retest entries with logical stops.
⏩How to use:
Green box = potential demand retest; Red box = potential supply retest. Enter on pullback into box, not on first impulse. Put stop on far side of box and aim first targets at recent swing points.
↕️ Swing bias (HH/HL vs LH/LL): “Which way is the road?”
What it is: Higher-highs/higher-lows = up-bias; Lower-highs/lower-lows = down-bias. system plots Buy/Sell OB levels aligned with that bias.
Why it helps: Trading with the broader flow reduces “hero trades” against institutions. Bias gives clearer entries and cleaner drawdowns.
⏩How to use:
Up-bias: look for long on Buy OB retests. Down-bias: look for short on Sell OB retests. Wait for a small rejection/engulfing to confirm before triggering.
🧱Order blocks: “Where big players remember”
What it is: last opposite-colored candle before an impulsive move—these zones often hold memory and reaction. system plots these as Buy/Sell OB lines.
Why it helps: Many breakouts pull back to the origin. Good entries often happen on retest, not on the breakout chase.
⏩ How to use:
Let price return into the OB, show wick rejection, and decent volume. Enter with stop beyond OB; define risk-reward before entry.
📊Volume coloring: “How Volume is move?”
What it is: Bar color reflects relative volume; inside bars are black. The dashboard also shows Volume and “Volume vs Prev.”
Why it helps: Patterns without volume often fade; volume validates strength and intent of moves.
⏩ How to use:
Favor entries where imbalance/OB/liquidity-grab coincide with higher volume. If volume is weak, reduce size or skip.
🧲 BSL/SSL liquidity pools: “Fishing for stops”
What it is: Equal highs cluster stops above (BSL); equal lows cluster stops below (SSL). system plots these and highlights the nearest one (“magnet”).
Why it helps: Price often sweeps these pools to trigger stops before reversing. This is a prime trap-reversal location.
⏩ How to use:
Watch nearest BSL/SSL. If price wicks through and closes back inside, anticipate a reversal. Trade reaction, not first poke. When price closes beyond, consider that pool mitigated and move on.
🟢🔴 Advanced liquidity grab: “Catch fakeout”
What it is: Bullish grab = makes a new low beyond a prior low but closes back above it, with a long lower wick, small body, and higher volume. Bearish is mirror. Labeled automatically.
Why it helps: It exposes trap moves (stop hunts) and often precedes true direction.
⏩ How to use:
Best when it aligns with a nearby imbalance/OB and supportive volume. Enter on reversal candle break or on retest. Stop goes beyond sweep wick.
🧠 Smart candlestick patterns (only in right place)
What it is: Engulfing, Hammer, Shooting Star, Hanging Man, Doji (with high volume), Morning/Evening Star, Piercing—but marked “effective” only if context (swing/trend/location) agrees.
Why it helps: same pattern in the wrong place is noise; in the right place, it’s signal.
⏩ How to use:
Location first (BSL/SSL/OB/imbalance), then pattern. Treat pattern as trigger/confirmation—one fresh label shows to keep chart clean.
🧭 Dashboard: “Context in a glance”
⏩ Reversal Level: current swing anchor—expect turns or reactions nearby; great for alerts and planning.
⏩ Volume vs Prev + Volume: Strength meter for signal candle—higher adds conviction.
⏩ Nearest Pool: next “magnet” area—look for sweeps/rejections there.
🧩Step-by-step trading flow (with mindset)
⏩ Set bias: HH/HL = long bias, LH/LL = short bias. Counter-trend only on clean sweeps with strong confirmation.
⏩ Find magnet: Check Nearest Pool (BSL/SSL). Focus attention there; it saves screen time.
⏩ Wait for event: Look for a sweep/grab label, or sharp rejection at pool/OB/imbalance. Avoid FOMO.
⏩ Add confluence: Stack 2–3 of these—imbalance box, OB, contextual pattern, supportive volume.
⏩Plan entry: Bullish: trigger above reversal candle high or take retest of FVG/OB. Stop below sweep wick/zone. Target at least 1:1.5–1:2.
Bearish: mirror above.
⏩Manage smartly: Take partials, move to breakeven or trail thoughtfully. Don’t drag stops inside zone out of emotion.
🎛️ Parameter tuning (to reduce human error)
⏩ swingLen: Smaller = faster but noisier; larger = cleaner but slower. Backtest first, then go live.
⏩ Tolerance (ATR or percent): ATR tolerance adapts to volatility (good for fast markets and lower TFs). Start around 0.15–0.30. In calm markets, try percent 0.05–0.15%.
⏩ minBarsGap: Start with 3–5 so equal highs/lows are truly equal—reduces false pools.
❌Common mistakes → ✅ Better habits
⏩Chasing every breakout → Wait for sweep/rejection, then confirm.
⏩Ignoring volume → Validate strength; cut size or skip on weak volume.
⏩Losing history of pools → If reviewing/backtesting, keep mitigated pools visible (dashed/faded).
⏩Over-tight tolerance/too small swingLen → Increases false signals; backtest to find balance.
📝 checklist (before entry)
⏩ Is there a nearby BSL/SSL and did a sweep/grab happen there?
⏩ Is there a close imbalance/OB that price can retest?
⏩ Do we have an effective pattern plus supportive volume?
⏩Is the stop beyond the wick/zone and RR ≥ 1:1.5?
•?((¯°·._.• 🎀 𝐻𝒶𝓅𝓅𝓎 𝒯𝓇𝒶𝒹𝒾𝓃𝑔 🎀 •._.·°¯((?•

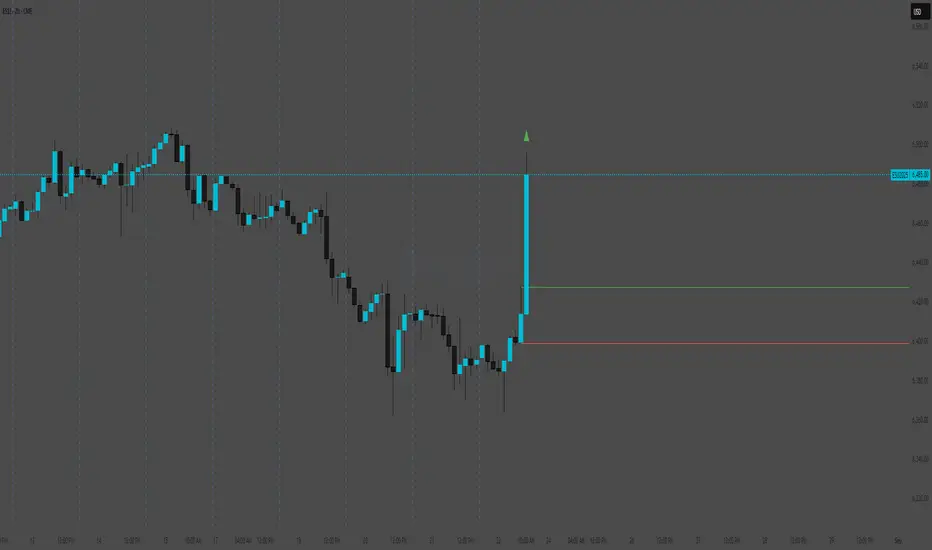
Previous Candle High/Low (Global Rays)Previous Candle High/Low (Global Rays, Corrected)
This indicator tracks the high and low of the most recently closed candle and projects them forward as global horizontal rays.
Features:
✅ Automatically updates the levels once a candle fully closes.
✅ Draws persistent lines at the previous candle’s high (green) and low (red), extending them into the future.
✅ Highlights real-time breakouts:
✅ Includes built-in alert conditions for both breakout events.
How to Use:
Use the levels as reference points for breakout trades, liquidity sweeps, or stop hunts.
Alerts can help you catch moves without needing to constantly watch the chart.
Works on any timeframe and symbol.
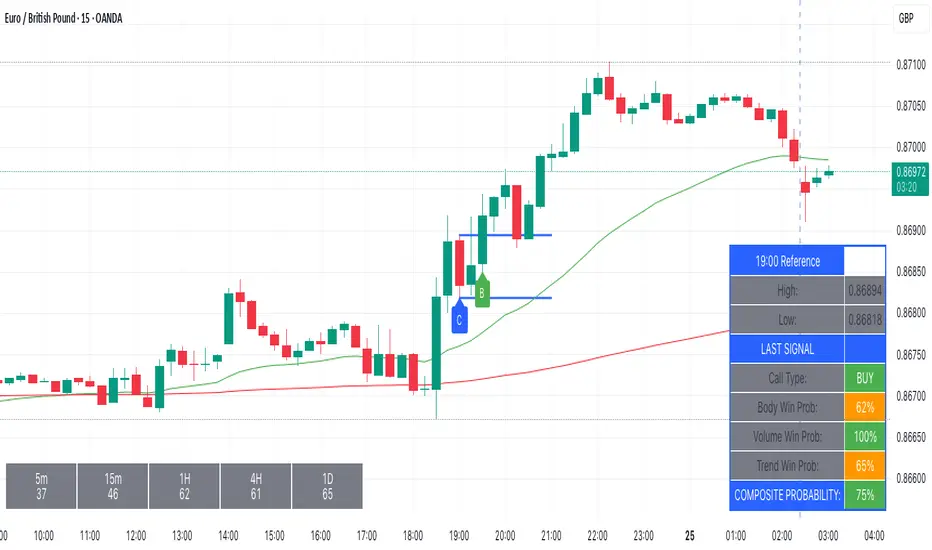
Kairos BarakahTrade with precision during high-probability windows using this advanced Pine Script indicator, designed specifically for Indian Standard Time (IST). The tool identifies key reversal opportunities within a user-defined trading session, combining time-based reference levels, sequence-validated signals, and multi-factor win probability analysis for confident decision-making.
Key Features
1. Time-Based Reference Levels
Automatically sets high/low reference levels at a customizable start time (default: 19:00 IST).
Active trading window with adjustable duration (default: 135 minutes).
Clear visual reference lines for easy tracking.
2. Intelligent Signal Generation
Initial Signals:
Buy (B): Triggered when price closes above the reference high.
Sell (S): Triggered when price closes below the reference low.
Reversal Signals (R):
Valid only after an initial signal, ensuring proper sequence.
Buy Reversal: Price closes above reference high (after a Sell signal).
Sell Reversal: Price closes below reference low (after a Buy signal).
3. Multi-Dimensional Win Probability
Body Strength: Measures candle conviction (body size / total range).
Volume Confirmation: Compares current volume to 20-period average.
Trend Alignment: Uses EMA crosses (9/21) and RSI (14) for momentum.
Composite Score: Weighted blend of all factors, color-coded for quick interpretation:
🟢 >70%: High-confidence signal.
🟠 40-69%: Moderate confidence.
🔴 <40%: Weak signal.
4. Professional Visualization
Clean labels (B/S/R) at signal points.
Real-time reference table showing levels, active signal, and probabilities.
Customizable alerts for all signal types.
Why Use This Indicator?
IST-Optimized: Tailored for Indian market hours.
Rules-Based Reversals: Avoids false signals with strict sequence checks.
Data-Driven Confidence: Win probability metrics reduce guesswork.
Flexible Setup: Adjust time windows and parameters to fit your strategy.
Candle Range Detector by TradeTech AnalysisCandle Range Detector by TradeTech Analysis
This advanced indicator identifies and visualizes price compression zones based on inside bar formations, then tracks how price behaves around those zones — offering valuable insights into liquidity sweeps, range expansions, and trap/mitigation behavior.
The script builds upon the foundational concept of range-based price action, commonly used by institutional traders, and adds automation, mitigation tracking, and sweep detection to map how price reacts around these critical ranges.
🔍 How It Works:
• Range Formation: A new range is detected when the current candle forms entirely within the high and low of the previous candle (i.e., an inside bar). This behavior often indicates price compression and potential breakout zones.
• Range Extension: Once a range is confirmed, the script projects upper and lower boundaries (using either a percentage-based multiplier or Fibonacci log extension), providing context for expected breakout zones.
• Mitigation Tracking: The script continuously monitors whether price breaks above or below the projected extensions, marking that range as mitigated — useful for confirming whether liquidity was absorbed.
• Sweep Detection: If price re-visits a mitigated zone and shows signs of a liquidity sweep (via wick + close behavior), the indicator triggers visual sweep labels and optional alerts.
🧠 Optional Visual Enhancements:
• Highlight range-forming candles with light blue background (toggle on/off)
• Midpoint dotted line for symmetry analysis
• Labels for “Range High” and “Range Low” for visual clarity
• Dynamic box drawing that adapts upon mitigation or continuation
⚙️ Customizable Features:
• Choose between Normal and Fibonacci-based detection modes
• Toggle visibility of range boxes, extension lines, and sweep markers
• Configure sweep alerts, mitigation window size, and visual transparency
⸻
🧪 Use Cases
• Identify consolidation zones before major price moves
• Confirm liquidity sweeps for entry/exit traps
• Visualize and test mitigation behavior of past zones
• Combine with Order Flow or Volume Profile tools to enhance context
⸻
⚠️ This is a fully original implementation that goes beyond classical inside-bar scanners by incorporating mitigation, extension projection, and liquidity sweeps — making it a powerful tool for intraday, swing, and even Smart Money-based trading setups.

DeltaStrike — Aggressive Candle Detector by Chaitu50cDeltaStrike — Aggressive Candle Detector
by Chaitu50c
DeltaStrike is a simple and effective tool designed to help traders identify the most aggressive candles on the chart in real time. It works purely on price action and internal candle dynamics, with no reliance on lagging indicators.
The indicator combines delta (directional strength), candle range, and volume to compute an overall aggressiveness score for each candle. When this score exceeds a dynamic threshold based on recent market behavior, the candle is marked as an aggressive move.
Aggressive bullish candles are plotted as green diamonds below the candle, while aggressive bearish candles are plotted as red diamonds above the candle. The goal is to help traders visually spot moments of strong directional pressure, where potential trends or reversals may emerge.
The detection logic adapts automatically to changing market volatility and volume, making it suitable for all instruments and timeframes, including index futures, equities, and forex.
An integrated dashboard on the chart displays live readings of the key components contributing to each candle’s aggressiveness score: delta ratio, range ratio, and volume ratio. This helps traders understand the internal structure of each aggressive move.
Features:
Dynamic aggressiveness detection based on delta, range, and volume
Adaptive threshold for consistent behavior across timeframes and instruments
Clean chart output with clear diamond markers only on selected candles
Live dashboard with internal metrics for advanced analysis
Simple, lightweight, and optimized for intraday and swing trading
Works with any instrument: index, equity, forex, commodity
DeltaStrike is intended as an objective visual aid to help traders focus on genuine moments of strong market intent, filtering out ordinary or passive price movement. It can be used standalone or in combination with your existing trading strategy.

Custom NYSE Hourly Intervals (Gris Extra Claro/T)NYSE Custom Hourly Intervals (Background Shading)
Indicator Overview:
This TradingView indicator visually highlights specific hourly intervals during the NYSE trading session (9:30 AM - 4:00 PM ET) using background shading. Its purpose is to help traders easily identify these key periods while analyzing price action.
Features:
Hourly Segmentation: Clearly marks the following hourly blocks within the NYSE session:
9:30 - 10:00 ET
10:00 - 11:00 ET
11:00 - 12:00 ET
12:00 - 13:00 ET
13:00 - 14:00 ET
14:00 - 15:00 ET
15:00 - 16:00 ET
Alternating Background: Uses a subtle, alternating background pattern for visual distinction:
Transparent: Applied during the 9:30-10:00, 11:00-12:00, 13:00-14:00, and 15:00-16:00 intervals (shows your default chart background).
Very Light Gray: Applied during the 10:00-11:00, 12:00-13:00, and 14:00-15:00 intervals.
Timeframe Restriction: The background shading is active only on chart timeframes of 30 minutes or less (e.g., 30m, 15m, 5m, 1m). It will not appear on higher timeframes.
Session Restriction: Shading only occurs during the defined NYSE session hours (9:30 AM - 4:00 PM ET).
Customization: The color and transparency level of the "Very Light Gray" shading can be adjusted in the indicator's settings.
Purpose & Use Case:
This indicator is ideal for intraday traders who want a clean visual guide to track price movement within specific hourly segments of the NYSE trading day, without needing complex overlays.

Big Candles FilterHow It Works
A candle is considered "big" only if its body (distance from open to close) exceeds the barHeight value.
** NOT calculated by Range !!!
Features :
Bullish candles (close > open) are marked with a green "Buy" triangle if the body is large enough.
Bearish candles (close < open) are marked with a red "Sell" triangle if the body is large enough.
The bars are colored for big candles, and optional labels show the open and close prices.

Vortex Candle MarkerVortex Candle Marker
The Vortex Candle Marker is a specialized TradingView indicator designed to identify and highlight **Vortex Candles**—candles that momentarily form without wicks on either the high or low. This unique price behavior can signal potential price retracements or reversals, aligning with the **Power of Three (PO3)** concept in price action theory.
Indicator Logic:
A candle is classified as a **Vortex Candle** if either of these conditions is met during its formation:
1. **Vortex Top:** The **high** equals either the **open** or **close**, indicating no upper wick.
2. **Vortex Bottom:** The **low** equals either the **open** or **close**, indicating no lower wick.
When a Vortex Candle is detected, the indicator changes the **candle border color** to **aqua**, making it easy to identify these significant price moments.
Market Insight & PO3 Interpretation:
In typical price behavior, most candles exhibit both upper and lower wicks, representing price exploration before settling at a closing value. A candle forming without a wick suggests **strong directional intent** at that moment. However, by the **Power of Three (PO3)** concept—Accumulation, Manipulation, and Distribution—such wickless formations often imply:
- **Price Reversion Likelihood:** When a candle temporarily forms without a wick, it suggests the market may **revisit the opening price** to establish a wick before the candle closes.
- **Liquidity Manipulation:** The absence of a wick may indicate a **stop-hunt** or liquidity grab, where the price manipulates one side before reversing.
- **Entry Triggers:** Identifying these moments can help traders anticipate potential **retracements** or **continuations** within the PO3 framework.
Practical Application
- **Early Reversal Detection:** Spot potential price reversals by observing wickless candles forming at key levels.
- **Breakout Validation:** Use Vortex Candles to confirm **true breakouts** or **false moves** before the price returns.
- **Liquidity Zones:** Identify areas where the market is likely to revisit to create a wick, signaling entry/exit points.
This indicator is a powerful tool for traders applying **Po3** methodologies and seeking to capture price manipulation patterns.

EBP Candle Marker### **EBP Candle Marker – TradingView Indicator**
The **EBP Candle Marker** is a specialized TradingView indicator designed to identify and highlight potential liquidity sweep candles. This indicator visually emphasizes key price action patterns where the market sweeps previous highs or lows and closes in the opposite direction, often signaling potential reversals or liquidity grabs.
---
### 📊 **Indicator Logic:**
1. **Bullish Sweep:**
- The current candle’s **low** is lower than the previous candle’s **low** (indicating a liquidity sweep).
- The **close** is above both the **open** and **close** of the previous candle.
2. **Bearish Sweep:**
- The current candle’s **high** is higher than the previous candle’s **high** (indicating a liquidity sweep).
- The **close** is below both the **open** and **close** of the previous candle.
---
### 🎨 **Visual Representation:**
- **Yellow Candle Body:** Highlights any candle meeting the bullish or bearish sweep conditions.
---
### 🔔 **Alert Functionality:**
The indicator supports setting custom alerts in TradingView for:
- **Bullish Sweep Detected** – Notifies when a bullish sweep occurs.
- **Bearish Sweep Detected** – Notifies when a bearish sweep occurs.
These alerts are compatible across any timeframe, providing flexibility to monitor key market conditions.
---
### 📈 **Use Cases:**
- **Liquidity Sweep Detection:** Identify areas where the market may be triggering stop-loss orders or liquidity hunts.
- **Reversal Confirmation:** Enhance trade confirmation by identifying potential reversal zones.
- **Scalping & Swing Trading:** Suitable for both short-term and long-term trading strategies across multiple timeframes.

Triangle Reversal IndicatorTriangle Reversal Indicator – A Visual Tool for Identifying Reversal Patterns
This indicator is designed to highlight potential trend reversal moments by comparing the current candle with the previous one. It offers a unique approach by focusing on distinct candle patterns rather than generic trend indicators, making it a valuable addition to your trading toolkit.
How It Works:
For a bullish signal, the indicator checks if:
The current candle is bullish (closing higher than it opens) while the previous candle was bearish.
The current candle’s low breaches the previous bearish candle’s low.
The current candle’s close is above the previous bearish candle’s close.
When these conditions are met, a tiny green triangle is plotted below the candle to signal a potential bullish reversal.
Conversely, for a bearish signal, it verifies if:
The current candle is bearish (closing lower than it opens) following a bullish candle.
The current candle’s high exceeds the previous bullish candle’s high.
The current candle’s close falls below the previous bullish candle’s close.
If all conditions are satisfied, a small red triangle appears above the candle to indicate a potential bearish reversal.
How to Use:
Simply apply the indicator on your chart and look for the tiny triangles that appear above or below the candles. These markers can serve as an additional visual cue when confirming entry or exit points, but it’s best used alongside your other analysis techniques.
Customization Options:
Users can further enhance the script by adding inputs for lookback periods, adjusting the triangle size, or modifying colors to match their chart themes.

Candle Momentum ExhaustionCandle Momentum Exhaustion
The Candle Momentum Exhaustion indicator is designed to help traders spot potential turning points in a trend by identifying when the prevailing momentum may be “running on empty.” The indicator works by comparing the size of each candle’s body (the absolute difference between the open and close) to the average body size over a recent period. When a candle’s body exceeds a user‐defined multiple of this average, it is flagged as an “exhaustion” candle.
• A bullish exhaustion (shown with a red down–facing triangle above the bar) occurs when a very large bullish candle (close > open) is detected, suggesting that buyers may have pushed the price too far and the rally could be near its end.
• A bearish exhaustion (shown with a green up–facing triangle below the bar) occurs when a very large bearish candle (close < open) is detected, implying that selling pressure might be overdone.
These signals can alert you to a potential reversal or consolidation point. The script also includes alert conditions so that you can set up notifications whenever an exhaustion signal is generated.
How It Works
1. Average Candle Body:
The script computes a simple moving average (SMA) of the absolute candle bodies over a user-defined period (default is 14 bars).
2. Exhaustion Candidate:
A candle is flagged as an exhaustion candidate if its body size exceeds the average by more than the set multiplier (default is 2.0).
3. Signal Identification:
• If the exhaustion candle is bullish (close > open), it is marked with a red down–facing triangle above the bar.
• If it is bearish (close < open), it is marked with a green up–facing triangle below the bar.
4. Alerts:
The built-in alertcondition() calls allow you to set alerts (via TradingView’s alert system) so that you can be notified when an exhaustion event occurs.
Risk Disclaimer:
This indicator is provided for educational and informational purposes only and does not constitute financial, investment, or trading advice. Trading and investing involve significant risk, and you should not rely solely on this indicator when making any trading decisions. Past performance is not indicative of future results. Always perform your own due diligence and consult with a qualified financial advisor before making any financial decisions. The creator of this indicator shall not be held responsible for any losses incurred through its use.

Naive Bayes Candlestick Pattern Classifier v1.1 BETAAn intermezzo on why i made this script publication..
A : Candlestick Pattern took hours to backtest, why not using Machine Learning techniques?
B : Machine Learning, no that's gonna be really heavy bro!
A : Not really, because we use Naive Bayes.
B : The simplest, yet powerful machine learning algorithm to separate (a.k.a classify) multivariate data.
----------------------------------------------------------------------------------------------------------------------
Hello, everyone!
After deep research in extracting meaningful information from the market, I ended up building this powerful machine learning indicator based on the evolution of Bayesian Statistics. This indicator not only leverages the simplicity of Naive Bayes but also extends its application to candlestick pattern analysis, making it an invaluable tool for traders who are looking to enhance their technical analysis without spending countless hours manually backtesting each pattern on each market!.
What most interesting part is actually after learning all of likely useless methods like fibonacci, supply and demand, volume profile, etc. We always ended up back to basic like support and resistance and candlestick patterns, but with a slight twist on strategy algorithm design and statistical approach. Thus, the only reason why i made this, because i exactly know that you guys will ended up in this position as time goes by.
The essence of this indicator lies in its ability to automate the recognition and statistical evaluation of various candlestick patterns. Traditionally, traders have relied on visual inspection and manual backtesting to determine the effectiveness of patterns like Bullish Engulfing, Bearish Engulfing, Harami variations, Hammer formations, and even more complex multi-candle patterns such as Three White Soldiers, Three Black Crows, Dark Cloud Cover, and Piercing Pattern. However, these conventional methods are both time-consuming and prone to subjective bias.
To address these challenges, I employed Naive Bayes—a probabilistic classifier that, despite its simplicity, offers robust performance in various domains. Naive Bayes assumes that each feature is independent of the others given the class label, which, although a strong assumption, works remarkably well in practice, especially when the dataset is large like market data and the feature space is high-dimensional. In our case, each candlestick pattern acts as a feature that can be statistically evaluated based on its historical performance. The indicator calculates a probability that a given pattern will lead to a price reversal, by comparing the pattern’s close price to the highest or lowest price achieved in a lookahead window.
One of the standout features of this script is its flexibility. Each candlestick pattern is not only coded into the system but also comes with individual toggles to enable or disable them based on your trading strategy. This means you can choose to focus on single-candle patterns like Bullish Engulfing or more complex multi-candle formations such as Three White Soldiers, without modifying the core code. The built-in customization options allow you to adjust colors and labels for each pattern, giving you the freedom to tailor the visual output to your preference. This level of customization ensures that the indicator integrates seamlessly into your existing TradingView setup.
Moreover, the indicator isn’t just about pattern recognition—it also incorporates outcome-based learning. Every time a pattern is detected, it looks ahead a predefined number of bars to evaluate if the expected reversal actually materialized. This outcome is then stored in arrays, and over time, the script dynamically calculates the probability of success for each pattern. These probabilities are presented in a real-time updating table on your chart, which shows not only the percentage probability but also the count of historical occurrences. With this information at your fingertips, you can quickly gauge the reliability of each pattern in your chosen market and timeframe.
Another significant advantage of this approach is its speed and efficiency. While more complex machine learning models like neural networks might require heavy computational resources and longer training times, the Naive Bayes classifier in this script is lightweight, instantaneous and can be updated on the fly with each new bar. This real-time capability is essential for modern traders who need to make quick decisions in fast-paced markets.
Furthermore, by automating the process of backtesting, the indicator frees up your time to focus on other aspects of trading strategy development. Instead of manually analyzing hundreds or even thousands of candles, you can rely on the statistical power of Naive Bayes to provide you with insights on which patterns are most likely to result in profitable moves. This not only enhances your efficiency but also helps to eliminate the cognitive biases that often plague manual analysis.
In summary, this indicator represents a fusion of traditional candlestick analysis with modern machine learning techniques. It harnesses the simplicity and effectiveness of Naive Bayes to deliver a dynamic, real-time evaluation of various candlestick patterns. Whether you are a seasoned trader looking to refine your technical analysis or a beginner eager to understand market dynamics, this tool offers a powerful, customizable, and efficient solution. Welcome to a new era where advanced statistical methods meet practical trading insights—happy trading and may your patterns always be in your favor!
Note : On this current released beta version, you must manually adjust reversal percentage move based on each market. Further updates may include automated best range detection and probability.

HTF CandlesHTF Candles, Plot of a Higher/Lower Timeframe Candles on any chart.
This HTF / LTF candle plot displays the previous 3 daily candles with the current update of the price with reference to a lower time frame.
Candles includes 3 Candles of HTF
last HTF candle includes 4 previous candles from LTF
Candle High Low Open Close are plotted.
these OHLC values act as Support and Resistance With reference to current Price.
very useful in making HTF and LTF analysis with reference to current timeframe.

RCYC Bullish Bearish Indicator
Summary: The RCYC Bullish Bearish Indicator is a custom trading tool designed to help traders identify potential bullish and bearish conditions in the market using a combination of KDJ and RSI indicators. This indicator uses color-coded candles to visually represent bullish and bearish signals, making it easy to identify trend changes on the chart. The script is particularly useful for traders who prefer visual signals and want to incorporate both trend momentum (KDJ) and relative strength (RSI) in their analysis.
Description:
The RCYC Bullish Bearish Indicator is a unique mashup of the KDJ and RSI indicators, optimized to provide a clear visual representation of market conditions through color-coded candles. This indicator not only identifies the potential trend shifts but also provides alerts for significant crossover points, enhancing a trader's ability to make informed decisions.
How It Works:
KDJ Calculation:
The KDJ is a variation of the Stochastic Oscillator that includes the %J line, which can go beyond the typical 0-100 range of %K and %D.
The KDJ component of this indicator calculates the highest high and lowest low over a specified period (KDJ Length), using these values to derive the %K line.
The %D line is a smoothed version of %K, and the %J line is derived from %K and %D using the formula: J = 3 * %K - 2 * %D.
This indicator focuses on the behavior of the %J line in relation to a mid-point level (50), identifying crossovers and crossunders that signal potential shifts in market sentiment.
RSI Calculation:
The Relative Strength Index (RSI) is a momentum oscillator that measures the speed and change of price movements. It is widely used to identify overbought or oversold conditions.
In this indicator, RSI values are adjusted and plotted to align visually with the KDJ values, providing a complementary momentum analysis.
Crossover Logic and Candle Coloring:
The indicator tracks two main events:
CrossOver50: When the %J line crosses above the 50 level, indicating potential bullish momentum.
CrossUnder50: When the %J line crosses below the 50 level, indicating potential bearish momentum.
Depending on the crossover events, the script changes the color of the candles on the chart:
Red candles on the initial crossover above 50, followed by dark blue candles to maintain bullish sentiment.
Yellow candles on the initial crossover below 50, followed by light blue candles to maintain bearish sentiment.
Alerts:
The indicator includes alert conditions for both bullish and bearish signals:
Red Candle Alert: Notifies the trader when the %J line crosses above 50.
Yellow Candle Alert: Notifies the trader when the %J line crosses below 50.
These alerts allow traders to react promptly to key market signals without continuously monitoring the chart.
Usage and Benefits:
This indicator is designed for traders looking to combine momentum and trend analysis into a single visual tool. It is particularly useful for those trading in trending markets or looking for entry/exit signals based on momentum shifts.
The color-coded candles provide an intuitive way to assess market conditions at a glance, reducing the complexity associated with analyzing multiple indicators separately.
By integrating both KDJ and RSI, the RCYC Bullish Bearish Indicator offers a balanced approach to trend detection and momentum confirmation, making it versatile for various trading styles, including scalping, swing trading, and position trading.
Originality and Usefulness:
While the indicator builds upon the familiar concepts of KDJ and RSI, it uniquely merges them into a cohesive visual tool with distinct crossover-based alerts and candle coloring.
This approach makes the indicator original, as it simplifies the interpretation of complex signals into straightforward visual cues, enhancing the decision-making process for traders who prefer chart-based analysis.

First Candle High Low LevelsDescription
The "First Candle High Low Levels" Pine Script indicator is designed to highlight the high and low levels of the first candle of the day on your TradingView chart. It works across different timeframes and specifically handles the Indian stock market trading hours (9:15 AM to 3:30 PM IST). The script draws a box from the start to the end of the trading session, visually marking the price range defined by the first candle of the day. Traders can customize the box's border color, fill color, and line width.
Features
Customizable Timeframe: Users can select the desired timeframe for the first candle (e.g., 5-minute, 15-minute, etc.).
Custom Box Appearance: Options to adjust the border color, fill color, and line width of the drawn box.
Auto Reset for Each New Day: The high and low of the first candle are reset daily to mark the start of the next trading day.
Accurate Market Session Handling: The box is drawn from the start of the first candle to the end of the trading session (3:30 PM IST).
Usage
Adding to Chart: Apply the script by copying it into the Pine Script editor in TradingView. Once added, the script will automatically draw a box representing the high and low of the first candle of the day.
Select Timeframe: You can adjust the First Candle Timeframe input to define which timeframe candle will be used for marking the high and low. For example, if you choose a 5-minute timeframe, the high and low of the first 5-minute candle will be used.
Customization:
Adjust the Border Color and Box Fill Color through the input settings to match your chart's style.
Modify the Box Line Width to make the box lines more or less prominent.
