RSI Fibonacci Levels StrategyRSI with Fibonacci Levels
Visually can be used as:
- Countertrend indicator at extreme green/red lines
- Follow trend indicator
- Fibonacci supports and resistantes zones
The strategy works as a follow trend
How to trade:
The indicator is more reliable in longer time frames, at least 4H
Choose a fibonacci level as reference
Buy when the RSI line turns green
Sell when the RSI line turns red
Centered Oscillators

DPO Strategy BacktestOriginal backtest version taken from HPotter and modified it a bit. Follows nice long trends if combined with other indicators.

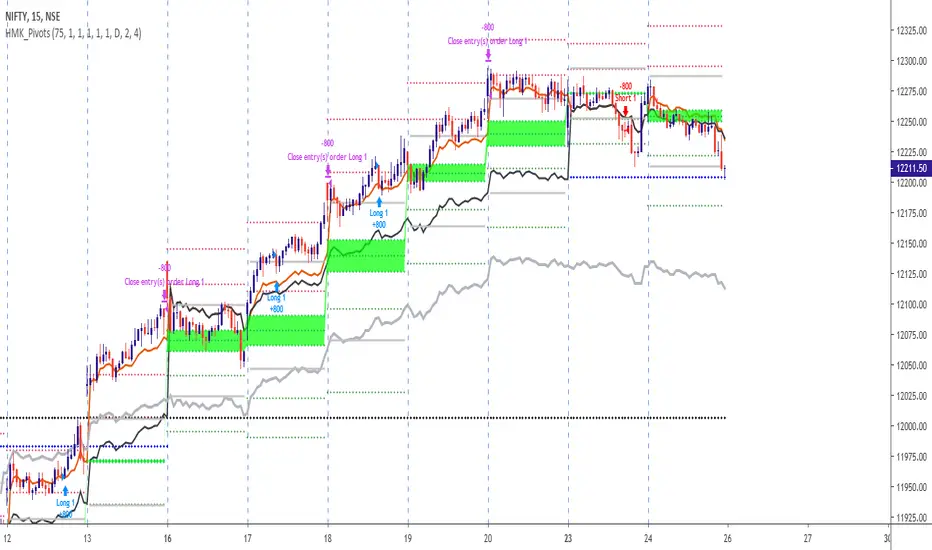
PivotIntradayStrategy@scorpiomanojFRMThis is an intraday trading strategy using Floor Pivots for BankNifty.
This strategy overlays on the charts with wide variety of drawing floor pivots and previous day levels.
VERY IMPORTANT :
1) LONGS AND SHORTS TO BE TAKEN IN 5 MIN CHART. 15 MIN CHART IS DISPLAYED BECAUSE TV DOESNT ALLOW TO PUBLISH WITH TF LESS THAN 15 MIN.
2) BACKTEST RESULTS ASSUME EXITS AT DAY CLOSE ONLY AND NOT BASED ON ANY OTHER CONDITIONS. HENCE ONCE LONG OR SHORT INITIATED IT IS SUGGESTED TO EXIT USING TRAILING STOP OR YOUR OWN RISK APPETITE. EVEN DAY CLOSE INTRADAY EXITS OFFERS A FAIRLY GOOD RESULT WITH ABOVE AVERAGE SUCCESS RATE AND PROFIT FACTOR IN EXCESS OF 1.75.
3) STRATEGY IS BASED ON COMBINATION OF PATTERNS INVOLVING DAILY PIVOTS AND PREV DAY LEVELS THAT IS FOUND TO REPEAT IN BANKNIFTY.
THE DETAILS OF THE STRATEGY IS CONFIDENTIAL.
4) THIS WILL BE AVAILABLE PUBLICLY ONLY FOR A LIMITED PERIOD. THIS LIMITED PERIOD AVAILABILITY IS TO TEST THE RESULTS AMONG VARIOUS PARTICIPANTS INORDER TO SEE THE CONSISTENCY.
YOU CAN REACH ME AT MY TWITTER ID scorpiomanojfrm or my email scorpiomanojfrm AT gmail DOT com

HA_CCI Long onlyStratégie calculée sur le croisement d'in CCI lent et d'un CCI Rapide
Le CCI est calculé sur la cloture de bougie henki hashi


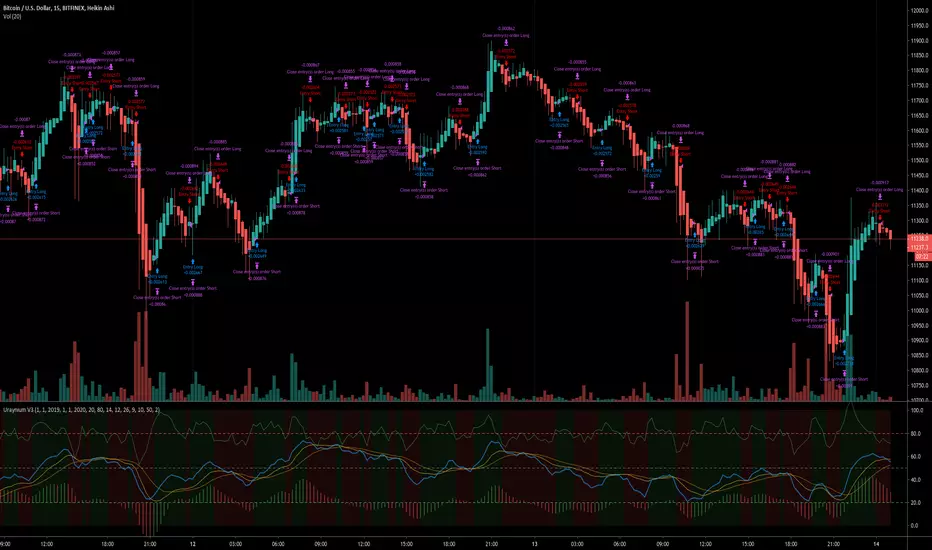
PD Crypto Performer PRO (Backtest)Description:
This is the backtesting version of the PD Crypto Performer Pro (Alert) . You can choose to backtest either one of the two strategies included, a trend-identifying swing strategy and a low risk scalping strategy. Both strategies assume the same capital amount invested ($10,000) each trade. You can also see how your capital grows over time by enabling the reinvesting proceeds option. For details, please check out this tutorial .
The backtesting results could be easily improved in live trading by utilizing the “Take Profit” signals and following the recommended methods of use below.
To assist the decision-making process, the code currently references BTCUSD. As a result, it is only suitable for crypto traders. However, we are working on the stock and forex versions, and the Performer will have these compatibilities soon.
Most importantly, our signals DO NOT REPAINT !
Recommended Use:
- Time Frame: 1HR
- Asset: Large cap crypto assets.
For lower risk tolerance, we recommend using the indicator on ETHUSD. For maximizing profits, we recommend using the indicator on BCHUSD.
- Always set stop loss according to your own risk tolerance
- Take profits along the way. Check out this video tutorial for when to reenter after our take profit signals.
Recommended Use for Advanced Traders:
- Position sizing:
Larger position if the 1HR signal is in the same direction compared to the 4HR trend.
Smaller position if the 1HR signal is in the opposite direction compared to the 4HR trend.
- Better entry/exit points:
Track the 1HR signal for the asset you are trading on other exchanges along with the BTCUSD 1HR signal. Sometimes, the signals from different exchanges occur with a 1-2 hour difference. You could use these earlier signals along with a lower time frame (eg. 15min) entry confirmation from your own exchange for better entry / exit points.
- Use “Take Profit” signals for counter trend scalps. Recover at the reentering opportunities . This works best with candlestick pattern confirmations.
Never use this if you suspect a flag / inverted flag pattern is forming.
Go to www.phi-deltalytics.com and sign up for a FREE trial today!
Let us know if you have any questions or recommendations. We are here for your success!
Disclaimer:
It should not be assumed that the methods, techniques, or indicators presented will be profitable or that they will not result in losses. Past results are not necessarily indicative of future results. This is not a solicitation of any order to buy or sell.

PD Crypto Performer (Backtest)Description:
This is the backtesting version of the PD Crypto Performer (Alert) . The strategy assumes the same capital amount invested ($10,000) each trade. You can also see how your capital grows over time by enabling the reinvesting proceeds option. For details, please check out this tutorial . The backtesting results could be easily improved in live trading by following the recommended methods of use below.
To assist the decision-making process, the code currently references BTCUSD. As a result, it is only suitable for crypto traders. However, we are working on the stock and forex versions, and the Performer will have these compatibilities soon.
Most importantly, our signals DO NOT REPAINT !
Recommended Use:
- Time Frame: 1HR
- Asset: Large cap crypto assets.
For lower risk tolerance, we recommend using the indicator on ETHUSD. For maximizing profits, we recommend using the indicator on BCHUSD.
- Always set stop loss according to your own risk tolerance
- Take profits along the way.
Recommended Use for Advanced Traders:
- Position sizing:
Larger position if the 1HR signal is in the same direction compared to the 4HR trend.
Smaller position if the 1HR signal is in the opposite direction compared to the 4HR trend.
- Better entry/exit points:
Track the 1HR signal for the asset you are trading on other exchanges along with the BTCUSD 1HR signal. Sometimes, the signals from different exchanges occur with a 1-2 hour difference. You could use these earlier signals along with a lower time frame (eg. 15min) entry confirmation from your own exchange for better entry / exit points.
Go to www.phi-deltalytics.com and sign up for a FREE trial today!
Let us know if you have any questions or recommendations. We are here for your success!
Disclaimer:
It should not be assumed that the methods, techniques, or indicators presented will be profitable or that they will not result in losses. Past results are not necessarily indicative of future results. This is not a solicitation of any order to buy or sell.

MACD Histogram BacktestTesting the trades signaled by the daily MACD histogram to see how they would have performed, compared to regular MACD Crosses. I'm going to take the 'List of trades' and analyse it seperately as some of the profit percentages seem a little off in the tradingview calculation, though it could just be my bad math!
Hi CryptoLove :) Hope this helps your investigation RE:
www.youtube.com
Combo Backtest 123 Reversal & CMO & WMA This is combo strategies for get a cumulative signal.
First strategy
This System was created from the Book "How I Tripled My Money In The
Futures Market" by Ulf Jensen, Page 183. This is reverse type of strategies.
The strategy buys at market, if close price is higher than the previous close
during 2 days and the meaning of 9-days Stochastic Slow Oscillator is lower than 50.
The strategy sells at market, if close price is lower than the previous close price
during 2 days and the meaning of 9-days Stochastic Fast Oscillator is higher than 50.
Second strategy
This indicator plots Chande Momentum Oscillator and its WMA on the
same chart. This indicator plots the absolute value of CMO.
The CMO is closely related to, yet unique from, other momentum oriented
indicators such as Relative Strength Index, Stochastic, Rate-of-Change,
etc. It is most closely related to Welles Wilder?s RSI, yet it differs
in several ways:
- It uses data for both up days and down days in the numerator, thereby
directly measuring momentum;
- The calculations are applied on unsmoothed data. Therefore, short-term
extreme movements in price are not hidden. Once calculated, smoothing
can be applied to the CMO, if desired;
- The scale is bounded between +100 and -100, thereby allowing you to clearly
see changes in net momentum using the 0 level. The bounded scale also allows
you to conveniently compare values across different securities.
WARNING:
- For purpose educate only
- This script to change bars colors.

Combo Backtest 123 Reversal & Chande Momentum Oscillator This is combo strategies for get a cumulative signal.
First strategy
This System was created from the Book "How I Tripled My Money In The
Futures Market" by Ulf Jensen, Page 183. This is reverse type of strategies.
The strategy buys at market, if close price is higher than the previous close
during 2 days and the meaning of 9-days Stochastic Slow Oscillator is lower than 50.
The strategy sells at market, if close price is lower than the previous close price
during 2 days and the meaning of 9-days Stochastic Fast Oscillator is higher than 50.
Second strategy
This indicator plots Chande Momentum Oscillator. This indicator was
developed by Tushar Chande. A scientist, an inventor, and a respected
trading system developer, Mr. Chande developed the CMO to capture what
he calls "pure momentum". For more definitive information on the CMO and
other indicators we recommend the book The New Technical Trader by Tushar
Chande and Stanley Kroll.
The CMO is closely related to, yet unique from, other momentum oriented
indicators such as Relative Strength Index, Stochastic, Rate-of-Change,
etc. It is most closely related to Welles Wilder`s RSI, yet it differs
in several ways:
- It uses data for both up days and down days in the numerator, thereby
directly measuring momentum;
- The calculations are applied on unsmoothed data. Therefore, short-term
extreme movements in price are not hidden. Once calculated, smoothing
can be applied to the CMO, if desired;
- The scale is bounded between +100 and -100, thereby allowing you to
clearly see changes in net momentum using the 0 level. The bounded scale
also allows you to conveniently compare values across different securities.
WARNING:
- For purpose educate only
- This script to change bars colors

The K2 v2.0 StrategyThe updated version of THE K2 is finally here! A lot of changes were made when creating the second version of the K2, but the result was a much higher level of performance.
The new K2 consists of a 1 minute 'fast' CCI and 15 minute slow CCI. We identified key thresholds for each one to construct a more complex trading approach. The green shapes on the chart represent buy signals and the red shapes are sell signals. The text above them is the percentage of equity used in each trade. These percentages are based on the CCI's position relative to the fixed thresholds. By doing this, the strategy achieves a higher frequency of trades and lower max drawdown.
Here's a guide to help understand the various shapes:
Circles: Slow CCI trades using 50% equity.
Squares: 25%
Triangles: 15%
Crosses(X's): 10%
We will update the user guide on our website(ProfitProgrammers.com) to include an in-depth guide to using the new K2.
The results displayed on the chart are the results for the month of April. As always, the K2 strategy comes with its study equivalent(at no extra cost).
If you're interested in the K2, message us for a free 3 day trial!
All of our invite only studies and strategies can be found on our website ProfitProgrammers.com

Directional Momentum Flux StrategyDirectional Momentum Flux (DMF) is a compound indicator designed to surface signals of projected change in directional momentum. The primary goal is to identify possible momentum inflection points and signal them before they happen, which is reached by applying a set of well-known high-level indicators (e.g. DEMA, RSIs, CCIs and VWAP), lower-level indicators (e.g. BOP, PPO and RMOMO), and some special sauce brewed in-house by yours truly.
This strategy is invite-only. Invitations are offered for a one-time fee of $250 payable in several cryptocurrencies (ETH, BTC, DASH, XMR or ZEC). Once you've got an invitation, you will automatically receive updates forever*.
DMF was designed to work across multiple asset classes. Extensive backtesting has been performed over multiple sample series (not just during the bull runs, for example) and against a randomized pool of assets. But don't take my word for it, I've included some time-based backtesting support tools to make it easy-peasy for you to validate the results yourself!
Under the hood, DMF is powered by numerous indicators, including:
✓ Double EMA & Composite SMA;
✓ Double RSI (fast & slow, variable);
✓ Composite StochRSI & VWAP (StochRSI+, two series);
✓ Composite Commodity Channel Index (CCI+, two series);
✓ Volume-Weighted Balance of Power (BOP itself was adapted from BOP_LB, kudos to LazyBear);
✓ Percentage Price Oscillator (PPO, split, two series);
✓ Range-adjusted Momentum Oscillator (RMOMO, my fancy MOM variant);
It crunches all that data and generates signals which are issued in two ways:
✓ Vertical Bands (or VBs) - Entry/Exit windows as vertical bands that remain "lit" (e.g. the background of a series of candles is semi-opaque white) while the top-level signals are showing sufficiently strong BUY signals. These windows are the primary entry/exit targets and can be relied upon with sufficient risk mitigation (e.g. a reasonable stop-loss or other scale-out exit mechanism). A VB followed immediately by an egg is as good as gold.
✓ Eggs - Entry/Exit validation signals that confirm the condition indicated by VBs. A lit VB without an egg in the same or next candle session is considered to be valid , but not safe (see above warning). Waiting for an egg can improve performance at the risk of missing the best possible entry point. Consider your risk tolerance and act accordingly.
Basic Instructions:
✓ Configure The Settings! The defaults are pretty good, but don't be scared to try variations. For example, by default SHORT positions are disabled. You might want to enable them if your risk tolerance allows them. (IMO there's gold on both ends of the rainbow. 🌈)
✓ Pay attention to the VBs. If you see a lit band being placed in an otherwise dark area, it's a projected inflection point. This is expected to be validated and confirmed in the same or immediately following period with an egg. You can enter a LONG position at this time.
✓ Pay attention to the eggs. If you see an egg, it's a confirmation that the VB changes in the same or immediately preceding candle period is valid. If you did not enter or exit your position at the point of the VB shift, now is the time to do so.
✓ Watch for the end of a VB period and be prepared to exit your position quickly as the next egg may be accompanied by a large directional momentum inflection.
Things to Note:
📉 - DMF is designed for day trading with aggressive position TTLs (15m was the upper bound during development and strategy testing). It appears to issue valid signals for other intervals, but it was not designed for >15m and YMMV. Don't go manually opening a LONG with no exit strategy and go to sleep... it probably won't work out to your benefit. You should be prepared to exit positions at any time. (Pro tip: automation is your friend!)
💸 - DMF indicator is not free from risk. As with all investment strategies, it is crucial to exercise caution and only trade with funds you are comfortable losing. DMF does not offer any form of guarantee or warranty, implied or otherwise. If you lose money, your house, your 401K... that's on you. (Pro tip: don't risk anything you're not ready to lose, because losses are part of the game and you WILL have them.)
🤔 - By using this indicator, you understand that any and all risks are the sole and complete responsibility of the end user (yeah, that's you). Don't use it if you're not 100% clear that you know exactly what you're doing. (Pro tip: always ask questions if you're feeling confused.)
⏱ - * Forever in this context means that, where room for improvement exists, I will improve it over time and you'll get all updates until I stop making them. (Pro tip: nobody lives forever.)

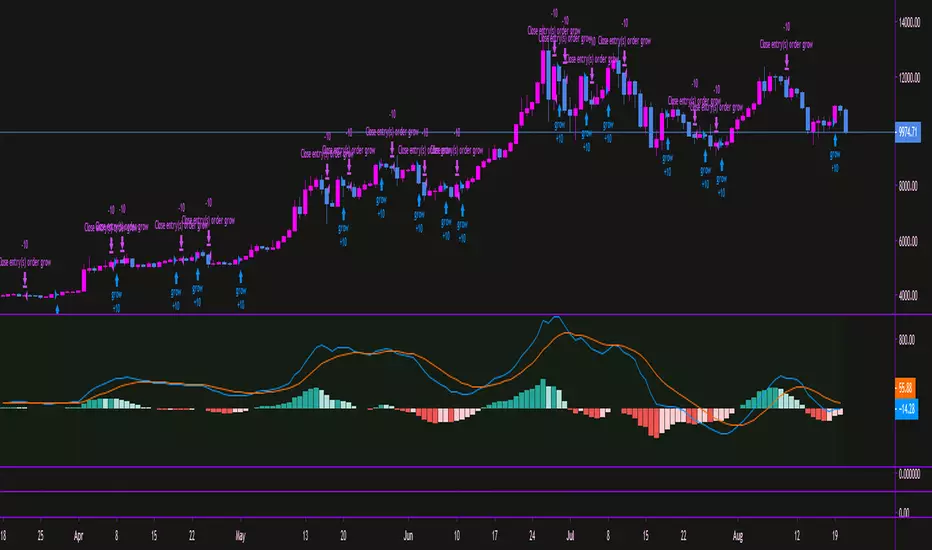
MACD MOMENTUM STRATEGYHey,
First of I'm not so familiar with Pine Editor, yet.
But a do need some help with a trick thing I*ve been working on.
As you can see I*ve merge the MACD and the MOMENTUM indicators in the same "chart" this have been working pretty well for me as a trading strategy. But now a chat tho create a real strategy with Pine Editor based on the same data. The thing is that I can't seem tho get the MOMENTUM indicator to and the MACD indicator in the same (different) scale in my strategy as when I merge them.
I suspect this got something to do with my chose of source för the MOMENTUM indicator, but I'm not 100.
I would be grateful for all kinds of feedback and tips for a solutions on this.
Thanks.
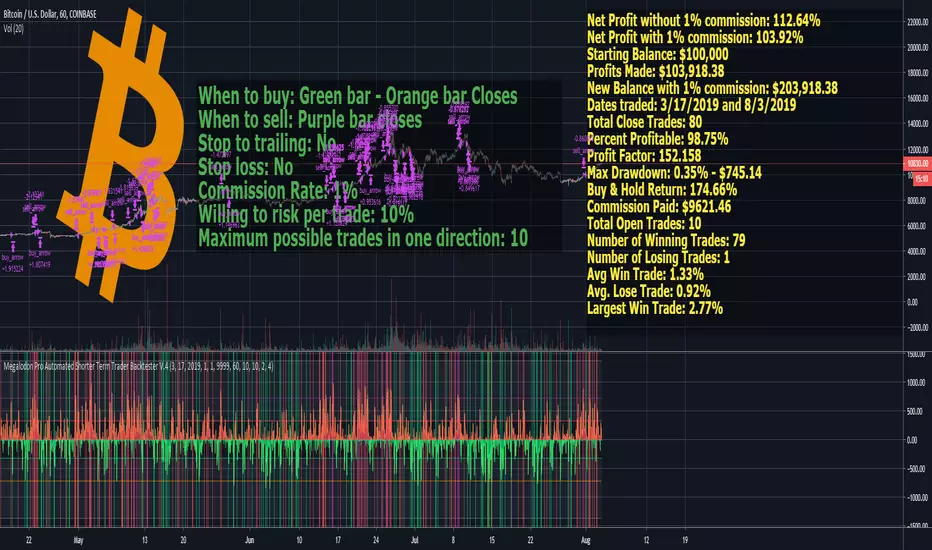
Megalodon Pro Automated Shorter Term Trader BacktesterSTRATEGY
When to buy: Green bar - Orange bar Closes
When to sell: Purple bar closes
Stop to trailing: No
Stop loss: No
Commission Rate: 1%
Willing to risk per trade: 10%
Maximum possible trades in one direction: 10
RESULTS
Net Profit without 1% commission: 112.64%
Net Profit with 1% commission: 103.92%
Starting Balance: $100,000
Profits Made: $103,918.38
New Balance with 1% commission: $203,918.38
Dates traded: 3/17/2019 and 8/3/2019
Total Close Trades: 80
Percent Profitable: 98.75%
Profit Factor: 152.158
Max Drawdown: 0.35% - $745.14
Buy & Hold Return: 174.66%
Commission Paid: $9621.46
Total Open Trades: 10
Number of Winning Trades: 79
Number of Losing Trades: 1
Avg Win Trade: 1.33%
Avg. Lose Trade: 0.92%
Largest Win Trade: 2.77%
Let me know what you guys think about the results?
Due to the tradingview's limitations on providing the shorter time frame price data, we had to provide a 60 minute time frame backtesting results.
The shorter time frames including 1 minute and 15 minutes backtesting results are way more accurate and precise than 60 minutes time frame results.
Megalodon Trading
Enlightening the Modern Investors
Dynasty Position Pickup by Tirano안녕하세요. 다이너스티 팀의 안드레아 입니다.
기존에 티라노라는 이름으로 활동했습니다.
Support-Resistance Cloud 소개
1. 한번이라도 지지 혹은 저항이 작용한 구간을 라인으로 표현합니다. 한번 맞고 튕긴 구간은 되돌림을 통한 리테스트가 있기 마련이고, 다시한번 튕길 가능성이 높습니다.
- 따라서 되돌림이 일어났을때 선으로 표현되는 구간에서 진입하면 수익으로 연계할 확률이 높습니다.
- 매물대를 표현한 PoC 라인이 보조적으로 사용됩니다. (피보나치 상으로 의미있는 구간에 표현됩니다)
- 박스권 상황에 유리합니다.
2. 전체적인 흐름을 구름과 채널의 형태로 표현합니다.
- 구름이 서서히 내려오며 하방 추세라면 매수신호에서 long으로 진입하기 보다는, 구름에 닿았을때 short으로 진입하는게 좋습니다.
- 전체적인 흐름(추세)를 거스르지 않고 매매할 수 있습니다.
- 한 방향으로 진행되는 one way 상황에 유리합니다.
기타 문의 사항은 댓글 남겨주시면 감사하겠습니다.
Hi. this is Andreas of the Dynasty team.
Introduction to Support-Resistance Cloud
1. The lines where the support or resistance acts once are expressed by lines. Once hit and bounced, there is a retest through bounce, and it is likely to bounce again.
- Therefore, if you enter from the section represented by the line when the recurrence occurs, the probability of linking with the profit is high.
- The PoC line representing the residential area is supplementary. (Expressed in Fibonacci sensible section)
- It is advantageous in the box case situation.
2. Express the overall flow in the form of clouds and channels.
- If the cloud is going down slowly, it is better to go into the short when touching the cloud, rather than going into long in the buy signal.
- You can trade without overtaking the whole flow (trend).
- It is advantageous for one way situation that goes in one direction.
If you have any other questions, please leave a comment.

Combo Backtest 123 Reversal & Chaikin Volatility This is combo strategies for get a cumulative signal.
First strategy
This System was created from the Book "How I Tripled My Money In The
Futures Market" by Ulf Jensen, Page 183. This is reverse type of strategies.
The strategy buys at market, if close price is higher than the previous close
during 2 days and the meaning of 9-days Stochastic Slow Oscillator is lower than 50.
The strategy sells at market, if close price is lower than the previous close price
during 2 days and the meaning of 9-days Stochastic Fast Oscillator is higher than 50.
Second strategy
Chaikin's Volatility indicator compares the spread between a security's
high and low prices. It quantifies volatility as a widening of the range
between the high and the low price.
You can use in the xPrice1 and xPrice2 any series: Open, High, Low, Close, HL2,
HLC3, OHLC4 and ect...
WARNING:
- For purpose educate only
- This script to change bars colors.

Equilibrium 3MIN TPUses 3 MIN TF - BTC/USD & BITMEX only
-Based on average price change and direction
-Smart Filters and Take Profits

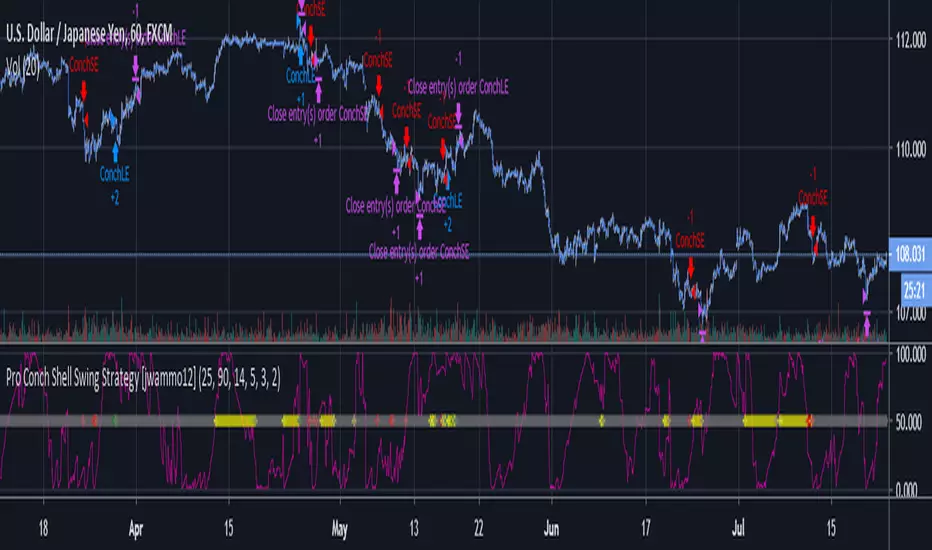
Pro Conch Shell Swing Strategy [jwammo12]This is a swing strategy that has been backtested and shown profitable over many instruments.
Message me for pricing and a free trial
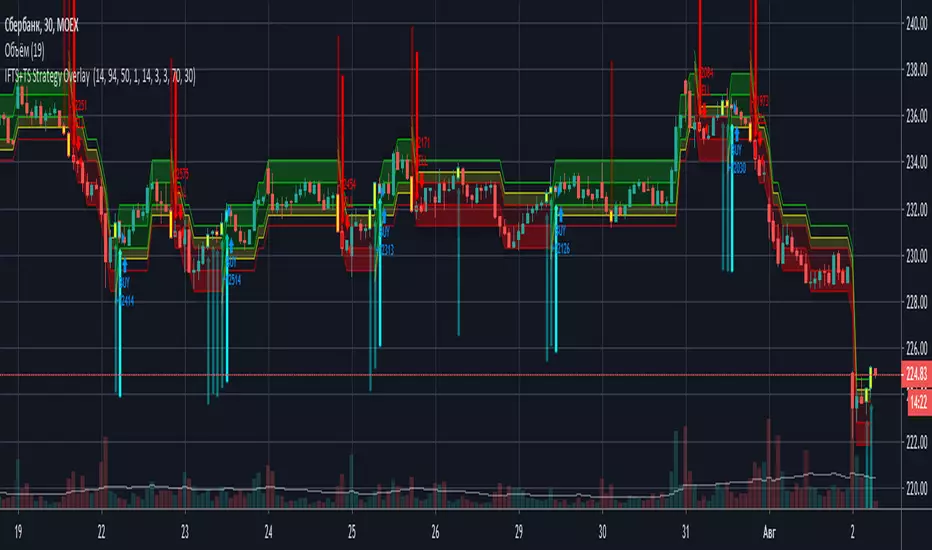
IFTS+TS Strategy OverlayInverse Fisher transform on stochastic with Hull MA and Donchian Channels with oversell/overbuy levels and dynamic trailing stop
Options:
Fixed trailing stop
Dynamic, based on ATR trailing stop
Re-enter after trailing stop
Includes Hull MA
Hull MA filtration for re-entering after trailing stop
Donchian channels, with overbuy/oversell levels
No repaints