Delbert SetupDelbert Setup is a clean, time-based session framework designed for traders who follow PNY, NYO, and evening market structure in IST (Asia/Kolkata) time.
It highlights key intra-day timing, PNY/NYO session highs/lows, and important schedule-based vertical markers for structured intraday planning.
🔍 What This Indicator Shows
1. PNY Session (09:30–18:55 IST)
Automatically draws:
PNY High (PNYH)
PNY Low (PNYL)
Thin solid levels from session start to session end
Vertical dotted lines at PNY open & close with timestamp labels
2. NYO Session (19:00–19:55 IST)
Displays:
NYOH / NYOL levels
NYO open/close vertical dotted lines
Session-only range levels (thin solid 1px)
3. 00:30 IST Marker
A dedicated vertical dotted line at 00:30 IST, useful for:
Timing bias
Session transitions
Trade management cutoffs
4. Optional NQ Reference Levels
If enabled, the script plots:
NQ open price at NYO start
Adjustable ± offset bands (default 100 points)
These assist traders correlating NQ behavior with their instrument.
🎨 Visual Style
All vertical lines → thinnest dotted black
PNY / NYO highs & lows → thin solid levels (1px)
Time labels → red, size-small, placed above chart structure
Designed for clean visual structure without clutter
🕒 Why IST Timing?
This indicator is tailored for traders who operate in India Standard Time, aligning PNY/NYO with local clock time without mental conversion.
All calculations use Asia/Kolkata timezone internally.
⚠ Notes
This indicator does not generate buy/sell signals.
It is meant as a market structure & session map, helping traders reference key liquidity and timing zones.
Works on any timeframe and across all assets.
✔ Ideal For Traders Who Use:
Session-based models (PNY, NYO, Pre-New York)
Liquidity sweeps near session highs/lows
Timing-based bias
Correlation models with NQ
Chart patterns

The5erThe5er is a money making tool
Wick trading is a price-action strategy that uses the shape and length of candlestick wicks to interpret market behavior and decide trades.

ORB + FVG + PDH/PDL ORB + FVG + PDH/PDL is an all-in-one day-trading overlay that plots:
Opening Range (ORB) high/low with optional box and extension
Fair Value Gaps (FVG) with optional “unmitigated” levels + mitigation lines
Previous Day High/Low history (PDH/PDL) drawn as one-day segments (yesterday’s levels plotted across today’s session only)
Includes presets (ORB only / FVG only / Both) and optional alerts for ORB touches, ORB break + retest, FVG entry, and PDH/PDL touches.

MACD ultimate with EMA overrideOverview
This Pine Script v5 indicator combines MACD zero-cross signals, SuperTrend trend validation, an EMA(50/200) trend filter and an EMA-crossover override to produce clean, session-constrained entry signals and robust exit logic. It draws labels and lines on the chart (entries, exits, SL lines) and supports alerts. Stop-losses use percentage-based sizing and are evaluated on bar close only to avoid intrabar noise.
Key features
Primary entry rule (MACD zero-cross):
Buy when MACD line crosses above zero (current bar MACD > 0 and previous bar MACD < 0).
Sell when MACD line crosses below zero (current bar MACD < 0 and previous bar MACD > 0).
Session-only entries: Entries are generated only inside a user-defined session (e.g., 09:30-11:30). Exits are evaluated at all times.
SuperTrend validation: Optional SuperTrend filter for entries and exits. Can be configured so exits require both MACD exit and SuperTrend flip (AND mode) or use OR mode.
EMA trend filter for entries: Optional EMA(50) vs EMA(200) filter — when enabled the indicator will only open buys in EMA-up trend and sells in EMA-down trend.
EMA crossover override (priority rule): If EMA fast crosses the slow:
EMA50 crosses above EMA200 → forced BUY override (bypasses session, SuperTrend, MACD). Exits any active short and opens long.
EMA50 crosses below EMA200 → forced SELL override (bypasses other validations). Exits any active long and opens short.
Overrides respect same-direction protection (won’t reopen an existing same-side position).
Opposite-entry immediate exit: When an opposite-direction raw entry (MACD zero-cross) occurs, any active opposite trade is exited immediately (then the script may open the opposite entry subject to entry validation). Same-direction repeated signals do not force an exit.
Stop-Loss (percentage): Parameterized SL (%) applied at entry; SL is checked and triggered only on bar close (e.g., long SL triggers if barstate.isconfirmed and close <= SL).
Labels & SL lines: Single-line, non-repainting labels for entries/exits; SL horizontal line drawn on open positions and greys out after closing.
Plots & visuals:
MACD panel (histogram, MACD, signal) optional.
SuperTrend plotted as a single color-coded line: green for bullish, red for bearish (no dots).
Optional EMA( fast / slow ) plots.
Entry markers (triangles) shown only for session-filtered entries.
Alerts: Entry and exit alerts are included and can be toggled on/off.
Inputs (high level)
MACD: fast, slow, signal lengths.
SL (%) and toggle to enable/disable SL.
SuperTrend: ATR length, multiplier; toggles: require for entry, allow/require for exit, show/hide.
EMA trend: enable/disable filter; fast/slow lengths; show/hide EMAs.
EMA override (built-in) — crossover detection triggers forced entry/exit.
Session: time range (HHMM-HHMM) — applies to entry generation only.
Misc: allow multiple entries flag, enable alerts, show/hide MACD panel.
Behavioral notes & caveats
The indicator is an overlay indicator (not a strategy()), so it draws visual signals and alerts but does not place real trades — use strategy() conversion to backtest trade P&L.
EMA override bypasses all validations by design — it forcibly exits the opposite side and opens the override side immediately (on the same bar). This is intentional to capture major trend flips.
SL is checked on bar close only. That reduces false SL triggers from intrabar spikes but means realized fills can differ in live trading depending on execution and slippage.
Opposite-entry exits are immediate (no SuperTrend/MACD requirement) except when a crossover override is the cause — the script guards so EMA overrides take precedence.
Pine Script runs on bar close for most accurate signals; intrabar behavior depends on your chart settings (realtime vs historical) — expect small differences between indicator labels and broker fills.
Plot/label density: many labels and SL lines can clutter the chart on lower timeframes. Consider hiding SL lines after N bars (optional enhancement) or use higher timeframe charts for less clutter.
Suggested default settings
MACD: 12, 26, 9
SL: 1.0 (%) with Use SL = on
SuperTrend: ATR 10, Multiplier 3.0, require for entry = true, require for exit = true (AND mode)
EMA trend filter: enabled (50/200)
Session: 0930-1130 (adjust to your exchange/timezone)
Alerts: on
How to use
Paste the full Pine v5 script into TradingView’s Pine Editor and add to chart.
Set the trade_session to the market hours you want entries in (chart timezone should match your intended exchange).
Toggle Use EMA trend / Require SuperTrend / Require ST for exit depending on how tight you want validation.
Use strategy() conversion before backtesting to verify the rules produce acceptable historical returns (indicator-only won’t generate P&L).
Recommended next steps
Convert to a strategy() script to backtest and measure win rate, drawdown, profit factor, and to validate the SL-on-close logic with realistic fills.
Add an input to auto-hide SL lines after N bars or compress labels to a compact trade status box.
Consider adding ATR- or volatility-based SL as an alternative to percentage SL.

Smart Money Alpha Signals (Performance Dashboard) Smart Money Alpha Signals: Identifying Market Leaders & Generating Alpha
GMP Alpha Signals (Global Market Performance Alpha) is a specialized analysis tool designed not merely to find stocks that are rising, but to identify "Alpha" assets—Market Leaders that defend their price or rise even under adverse conditions where the market index falls or consolidates.
This indicator visualizes the concept of Comparative Relative Strength (RS) and Smart Money accumulation patterns, helping traders capture profit opportunities even during bearish market phases.
Key Objectives (Purpose)
Alpha Capture: Identifying assets generating 'excess returns' that outperform the market Beta.
Smart Money Tracking: Detecting traces of 'institutional buying' and 'accumulation' that defend prices during index plunges.
Decoupling Identification: Spotting assets moving on independent catalysts or momentum, regardless of the broader market direction.
Stop Hunt Filtering: Distinguishing 'fake drops' where price dips temporarily, but Relative Strength remains intact.
Dashboard Guide
Interpretation of the information panel (Table) displayed on the chart.
Rel. Performance: Shows the excess return compared to the index over the set period. (Positive/Green = Stronger than the market).
Decoupling Strength: The correlation coefficient with the index. Lower values (0 or negative) indicate movement independent of market risk.
Bullish: The count/rate of rising or limiting losses when the index drops sharply (e.g., < -0.5%). (Gold = Market Crash Leader).
Defended: The count/rate of holding support levels when the index shows mild weakness (e.g., < -0.05%). (Gold = Strong Accumulation).
Bench. Defense: The defense rate of the comparison benchmark (e.g., TSLA, ETH). Your target asset must be higher to be considered the sector leader.
Input Options & Settings Guide
You can optimize settings according to your trading style and asset class (Stocks/Crypto).
(1) Main Settings
Major Index: The baseline market index for comparison.
(US Stocks: NASDAQ:NDX or TVC:SPX / Crypto: BINANCE:BTCUSDT)
Benchmark Symbol: A competitor within the sector.
(e.g., Set NVDA when analyzing Semiconductor stocks).
Correlation Lookback: The lookback period for judging decoupling. (Default: 30)
Performance Lookback: The number of bars to calculate cumulative returns and defense rates. (Default: 60)
(2) Dashboard Thresholds
These settings define the criteria for what qualifies as "Defended" or "Bullish".
Performance (Max %): Used to find assets that haven't pumped yet. Signals trigger only when Alpha is below this value.
Defended Logic:
Index Drop Condition: The index must drop by at least this amount to start checking. (e.g., -0.05%)
Asset Buffer: How much the asset must outperform the index drop.
(Example: If Index drops -1.0% and Buffer is 0.2%, the asset must be at least -0.8% to count as 'Defended').
Bullish Logic: Measures resilience during steeper market dumps (e.g., -0.5% drop) compared to the Defended Logic.
Volume Settings: Decides whether to count Defended/Bullish instances only when accompanied by volume above the SMA.
(3) Signal Logic Settings (Crucial)
Customize conditions to trigger alerts. The choice between AND / OR is crucial.
AND: Condition must be met SIMULTANEOUSLY with other active conditions (Conservative/High Certainty).
OR: Condition triggers the signal INDEPENDENTLY (Aggressive/Opportunity Capture).
Performance: Is the relative performance within the threshold? (Basic Filter).
Decoupling: Has the correlation dropped? (Start of independent move).
Bullish Rate: Is the Bullish rate high during market dumps?
Defended Rate (High): (Recommended) Is there continuous price defense occurring? (Accumulation detection).
Defended Rate (Low): (Warning) Has the defense rate broken down? (For Stop Loss).
Defended > Benchmark: Is it stronger than the Benchmark (2nd tier)?
Volume Spike: Has volume surged compared to the average? (Institutional involvement).
RSI Oversold: Is it in oversold territory? (Counter-trend trading).
Decoupling Move: Does the current bar show the "Index Down / Asset Up" pattern?
Min USD Volume: Transaction value filter (To exclude low liquidity assets).

Trend detection zero lag Trend Detection Zero-Lag (v6)
Trend Detection Zero-Lag is a high-performance trend identification indicator designed for intraday traders, scalpers, and swing traders who require fast trend recognition with minimal lag. It combines a zero-lag Hull Moving Average, slope analysis, swing structure logic, and adaptive volatility sensitivity to deliver early yet stable trend signals.
This indicator is optimized for real-time decision-making, particularly in fast markets where traditional moving averages react too slowly.
Core Features
🔹 Zero-Lag Trend Engine
Uses a Zero-Lag Hull Moving Average (HMA) to reduce lag by approximately 40–60% versus standard moving averages.
Provides earlier trend shifts while maintaining smoothness.
🔹 Multi-Factor Trend Detection
Trend direction is determined using a hybrid engine:
HMA slope (momentum direction)
Rising / falling confirmation
Swing structure detection (HH/HL vs LH/LL)
ATR-adjusted dynamic sensitivity
This approach allows fast flips when conditions change, without excessive noise.
Adaptive Volatility Sensitivity
Sensitivity dynamically adjusts based on ATR relative to price
In high volatility: faster reaction
In low volatility: smoother, more stable trend state
This ensures the indicator adapts across:
Trend days
Range days
Volatility expansion or contraction
Trend Duration Intelligence
The indicator tracks historical trend durations and maintains a rolling memory of recent bullish and bearish phases.
From this, it calculates:
Current trend duration
Average historical duration for the active trend direction
This helps traders gauge:
Whether a trend is early, mature, or extended
Probability of continuation vs exhaustion
Strength Scoring
A normalized Trend Strength Score (0–100) is calculated using:
Zero-lag slope magnitude
ATR normalization
This provides a quick read on:
Weak / choppy trends
Healthy trend continuation
Overextended momentum
Visual Design
Color-coded Zero-Lag HMA
Bullish trend → user-defined bullish color
Bearish trend → user-defined bearish color
Designed for dark mode / neon-style charts
Clean overlay with no clutter
Trend Detection Zero-Lag is built for traders who need:
Faster trend recognition
Adaptive behavior across market regimes
Structural confirmation beyond simple moving averages
Clear, actionable visual signals

11-MA Institutional System (ATR+HTF Filters)11-MA Institutional Trading System Analysis.
This is a comprehensive Trading View Pine Script indicator that implements a sophisticated multi-timeframe moving average system with institutional-grade filters. Let me break down its key components and functionality:
🎯 Core Features
1. 11 Moving Average System. The indicator plots 11 customizable moving averages with different roles:
MA1-MA4 (5, 8, 10, 12): Fast-moving averages for short-term trends
MA5 (21 EMA): Short-term anchor - critical pivot point
MA6 (34 EMA): Intermediate support/resistance
MA7 (50 EMA): Medium-term bridge between short and long trends
MA8-MA9 (89, 100): Transition zone indicators
MA10-MA11 (150, 200): Long-term anchors for major trend identification
Each MA is fully customizable:
Type: SMA, EMA, WMA, TMA, RMA
Color, width, and enable/disable toggle
📊 Signal Generation System
Three Signal Tiers: Short-Term Signals (ST)
Trigger: MA8 (EMA 8) crossing MA21 (EMA 21)
Filters Applied:
✅ ATR-based post-cross confirmation (optional)
✅ Momentum confirmation (RSI > 50, MACD positive)
✅ Volume spike requirement
✅ HTF (Higher Timeframe) alignment
✅ Strong candle body ratio (>50%)
✅ Multi-MA confirmation (3+ MAs supporting direction)
✅ Price beyond MA21 with conviction
✅ Minimum bar spacing (prevents signal clustering)
✅ Consolidation filter
✅ Whipsaw protection (ATR-based price threshold)
Medium-Term Signals (MT)
Trigger: MA21 crossing MA50
Less strict filtering for swing trades
Major Signals
Golden Cross: MA50 crossing above MA200 (major bullish)
Death Cross: MA50 crossing below MA200 (major bearish)
🔍 Advanced Filtering System1. ATR-Based ConfirmationPrice must move > (ATR × 0.25) beyond the MA after crossover
This prevents false signals during low-volatility consolidation.2. Momentum Filters
RSI (14)
MACD Histogram
Rate of Change (ROC)
Composite momentum score (-3 to +3)
3. Volume Analysis
Volume spike detection (2x MA)
Volume classification: LOW, MED, HIGH, EXPL
Directional volume confirmation
4. Higher Timeframe Alignment
HTF1: 60-minute (default)
HTF2: 4-hour (optional)
HTF3: Daily (optional)
Signals only trigger when current TF aligns with HTF trend
5. Market Structure Detection
Break of Structure (BOS): Price breaking recent swing highs/lows
Order Blocks (OB): Institutional demand/supply zones
Fair Value Gaps (FVG): Imbalance areas for potential fills
📈 Comprehensive DashboardReal-Time Metrics Display: {scrollbar-width:none;-ms-overflow-style:none;-webkit-overflow-scrolling:touch;} ::-webkit-scrollbar{display:none}MetricDescriptionPriceCurrent close priceTimeframeCurrent chart timeframeSHORT/MEDIUM/MAJORTrend classification (🟢BULL/🔴BEAR/⚪NEUT)HTF TrendsHigher timeframe alignment indicatorsMomentumSTR↑/MOD↑/WK↑/WK↓/MOD↓/STR↓VolatilityLOW/MOD/HIGH/EXTR (based on ATR%)RSI(14)Color-coded: >70 red, <30 greenATR%Volatility as % of priceAdvanced Dashboard Features (Optional):
Price Distance from Key MAs
vs MA21, MA50, MA200 (percentage)
Color-coded: green (above), red (below)
MA Alignment Score
Calculates % of MAs in proper order
🟢 for bullish alignment, 🔴 for bearish
Trend Strength
Based on separation between MA21 and MA200
NONE/WEAK/MODERATE/STRONG/EXTREME
Consolidation Detection
Identifies low-volatility ranges
Prevents signals during sideways markets
⚙️ Customization OptionsFilter Toggles:
☑️ Require Momentum
☑️ Require Volume
☑️ Require HTF Alignment
☑️ Use ATR post-cross confirmation
☑️ Whipsaw filter
Min bars between signals (default: 5)
Dashboard Styling:
9 position options
6 text sizes
Custom colors for header, rows, and text
Toggle individual metrics on/off
🎨 Visual Elements
Signal Labels:
ST▲/ST▼ (green/red) - Short-term
MT▲/MT▼ (blue/orange) - Medium-term
GOLDEN CROSS / DEATH CROSS - Major signals
Volume Spikes:
Small labels showing volume class + direction
Example: "HIGH🟢" or "EXPL🔴"
Market Structure:
Dashed lines for Break of Structure levels
Automatic detection of swing highs/lows
🔔 Alert Conditions
Pre-configured alerts for:
Short-term bullish/bearish crosses
Medium-term bullish/bearish crosses
Golden Cross / Death Cross
Volume spikes
💡 Key Strengths
Institutional-Grade Filtering: Multiple confirmation layers reduce false signals
Multi-Timeframe Analysis: Ensures alignment across timeframes
Adaptive to Market Conditions: ATR-based thresholds adjust to volatility
Comprehensive Dashboard: All critical metrics in one view
Highly Customizable: 100+ input parameters
Signal Quality Over Quantity: Strict filters prioritize high-probability setups
⚠️ Usage Recommendations
Best for: Swing trading and position trading
Timeframes: Works on all TFs, optimized for 15m-Daily
Markets: Stocks, Forex, Crypto, Indices
Signal Frequency: Conservative (quality over quantity)
Combine with: Support/resistance, price action, risk management
🔧 Technical Implementation Notes
Uses Pine Script v6 syntax
Efficient calculation with minimal repainting
Maximum 500 labels for performance
Security function for HTF data (no lookahead bias)
Array-based MA alignment calculation
State variables to track signal spacing
This is a professional-grade trading system that combines classical technical analysis (moving averages) with modern institutional concepts (market structure, order blocks, multi-timeframe alignment).
The extensive filtering system is designed to eliminate noise and focus on high-probability trade setups.


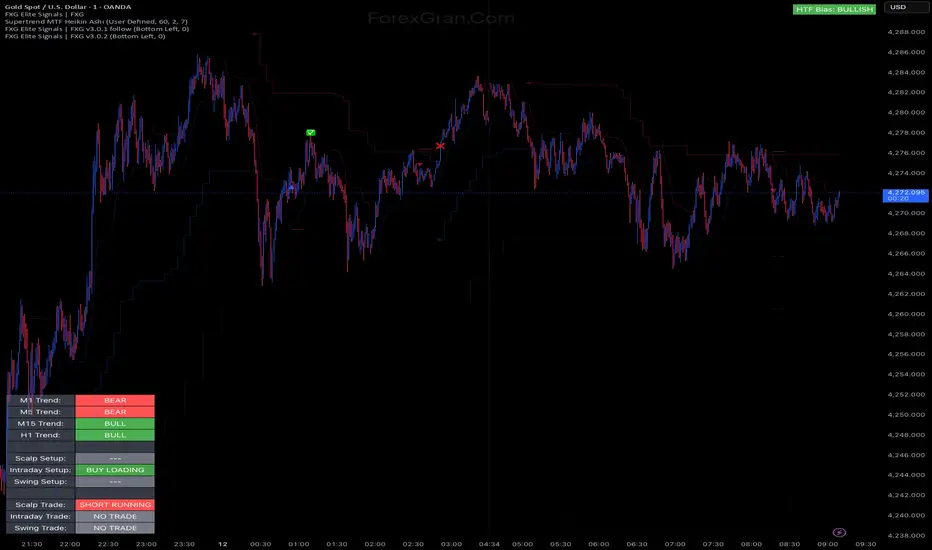
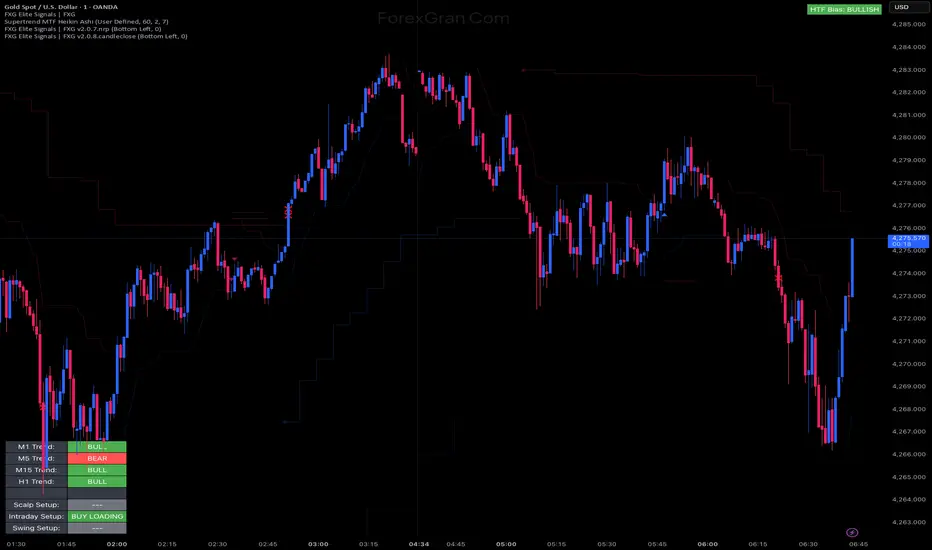
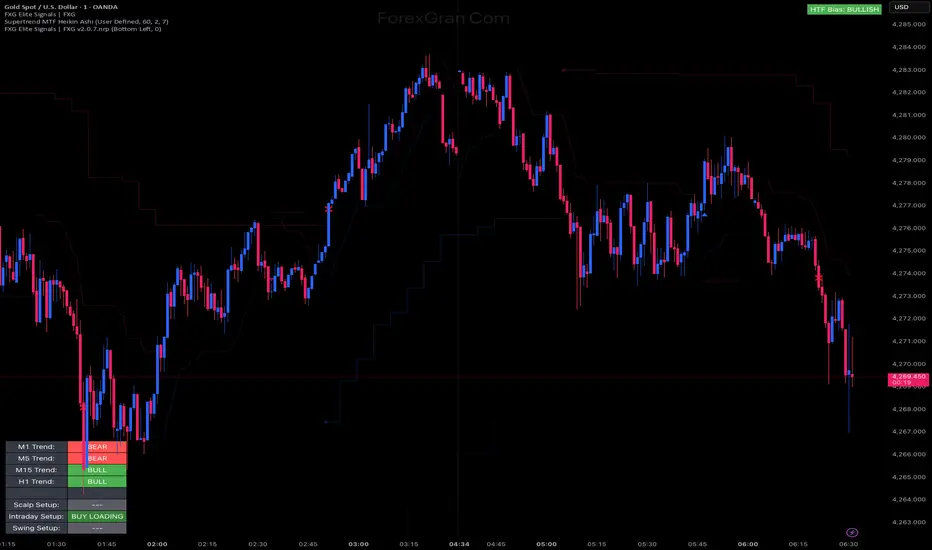
FXG Elite Signals | FXG v2.0.8.candlecloseReversal Zone Trading With Scalp , Intraday and Swing setups
Ichimoku + VWAP + OBV + ATR Full System (NQ Daytrade)This script provides optimized scalping signals for BTC, designed mainly for the 15-minute timeframe.
Long/short entries are generated using VWAP band position and trend confirmation logic.
OBV momentum is used as a secondary filter to validate breakout or reversal conditions.
Exit signals are displayed when volatility compression or mean-reversion conditions occur.
Simple visual markers (triangles and circles) are included for easy decision-making.
롱/숏 삼각형 시그널
동그라미 청산 시그널
VWAP 밴드 기반 방향성
OBV 보조지표
이름 (Name)
BTC Scalping Signal – VWAP + OBV
짧은 설명 (Short Description)
VWAP 밴드와 OBV를 기반으로 방향성, 진입·청산 시그널을 제공하는 스캘핑 지표입니다.
긴 설명 (Long Description)
이 지표는 BTC 단기 스캘핑을 위해 설계된 것으로, 특히 15분봉 환경에 최적화되어 있습니다.
VWAP 밴드의 위치와 추세 판별 로직을 기반으로 롱·숏 진입 신호를 제공합니다.
OBV 모멘텀을 보조 필터로 사용하여 돌파 및 되돌림 가능성을 판단합니다.
시장 변동성이 축소되거나 평균회귀 신호가 감지될 때 청산 시그널을 표시합니다.
삼각형(진입), 원형(청산) 등 직관적 시각 요소를 통해 빠른 의사결정을 지원합니다.

RSI Multi-Timeframe TableHow the RSI Multi-Timeframe Table Indicator Works
This indicator displays a table showing the RSI (14) from multiple timeframes at the same time.
It helps you quickly see whether the RSI is in overbought or oversold zones across different periods (1m, 5m, 15m, 30m, 1h, 4h, and 1D).
Below is a clear explanation of how each part works:
1) Timeframes Used
The indicator analyzes the RSI from the following timeframes:
1 minute (1m)
5 minutes (5m)
15 minutes (15m)
30 minutes (30m)
1 hour (1h)
4 hours (4h)
1 day (1D)
Each row of the table represents one of these timeframes.
2) How the RSI Is Retrieved
For each timeframe, the script uses the request.security() function to fetch the RSI(14) value from that specific timeframe, even if your current chart is set to a different one.
Example: On a 1h chart, you can still see the RSI from 1m, 5m, 30m, etc.
3) Table Structure
The table appears in the top-right corner and contains 8 columns:
TF – shows the timeframe name
RSI – shows the RSI value with two decimal places
10 – marks if RSI is ≤ 10
20 – marks if RSI is ≤ 20
30 – marks if RSI is ≤ 30
70 – marks if RSI is ≥ 70
80 – marks if RSI is ≥ 80
90 – marks if RSI is ≥ 90
The extreme levels (10, 20, 80, 90) help identify possible reversal zones.
4) Markings in the Table
When a condition is true, a ● circle appears in the corresponding cell.
Examples:
If the 5m RSI is ≤ 20, a circle appears in the 20 column for the 5m row.
If the 1H RSI is ≥ 80, a circle appears in the 80 column for the 1H row.
Colors also help interpretation:
Red for strong oversold levels (≤10)
Orange and yellow for intermediate levels
Green, teal, and blue for overbought levels
5) Alerts
The indicator includes four built-in alerts:
RSI ≤ 10
RSI ≤ 20
RSI ≥ 80
RSI ≥ 90
These alerts use the RSI from the current chart timeframe.
To enable them:
Open Alerts in TradingView
Click Create Alert
Select the indicator
Choose the alert you want
Confirm
6) Purpose of This Indicator
It is useful for:
Quickly checking market strength across multiple timeframes
Identifying when several periods are overbought or oversold
Avoiding trades against market momentum
Helping confirm potential reversal points
Summary
This indicator creates a table that shows RSI values from multiple timeframes and visually highlights overbought or oversold conditions in each one.
It also includes ready-to-use alerts for the most extreme RSI levels.

Fat Tony's Composite Momentum + ROC (v0.4)Fat Tony's Composite Momentum + ROC (v0.4)
Option guy settings and indicators

King StrategyKing Strategy is an all-in-one TradingView edge for scalpers, swing traders and prop- or hedge-fund pros alike. It blends classic pattern flags with institutional-grade filters to pinpoint high-probability long entries and exits—and displays them with instant visual cues (buy/sell flags, dynamic backgrounds, trend-lines, support/resistance and volume-zones).
Built-in time-of-day and cycle locks help tame overtrading, and every signal lives in a single Inputs panel so you can toggle filters, tweak risk parameters and dial in exits in seconds. Whether you’re chasing 1-minute scalps or planning multi-day swings, S85 keeps you in sync with the market—just fine-tune its tools to match your timeframe, liquidity and comfort with risk.

True Gap Finder with Revisit DetectionTrue Gap Finder with Revisit Detection
This indicator is a powerful tool for intraday traders to identify and track price gaps. Unlike simple gap indicators, this script actively tracks the status of the gap, visualizing the void until it is filled (revisited) by price.
Key Features:
Active Gap Tracking: Finds gap-up and gap-down occurrences (where Low > Previous High or High < Previous Low) and actively tracks them.
Gap Zones (Clouds): Visually shades the empty "gap zone" (the void between the gap candles), making it instantly obvious where price needs to travel to fill the gap. The cloud disappears automatically once the gap is filled.
Dynamic Labels: automatically displays price labels at the origin of the gap, showing the specific price range (High-Low) that constitutes the gap. Labels are positioned intelligently to avoid cluttering current price action.
Alerts: Configurable alerts notify you the moment a gap is filled.
Customization: Full control over colors, clouds, labels, and alert settings to match your chart style.
How it works: The indicator tracks the most recent gap. If a new gap forms, it becomes the active focus. When price moves back to "close" or "fill" this gap area, the lines and clouds automatically stop plotting, giving you a clean chart that focuses only on open business.

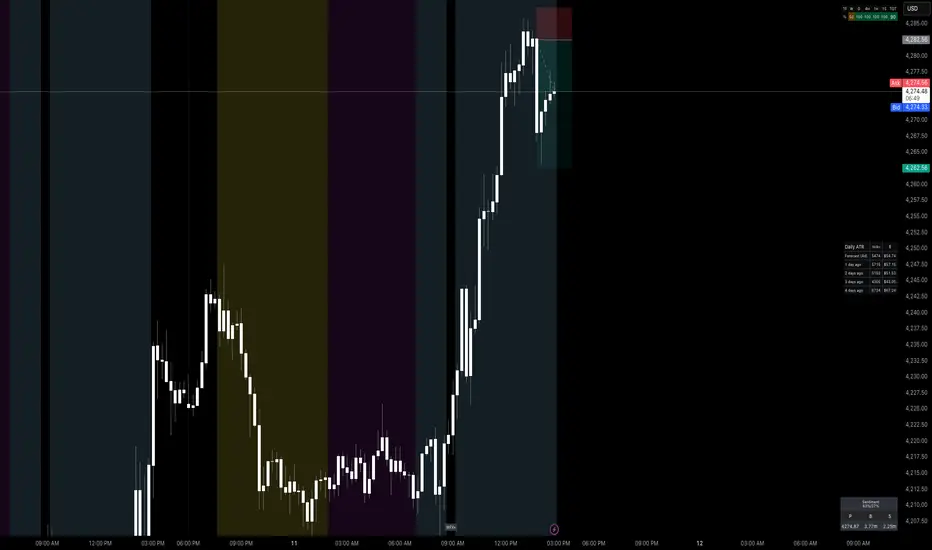
Worstfx Fractal Sessions 🧩 Worstfx Fractal Sessions Public — Features & Purpose
✔️ Includes clean session structure • Simple confluence • Built-in guardrails for your psychology
Worstfx Fractal Sessions Public is a stripped-back, clean version of the full Worstfx framework.
It’s designed to give every trader the core advantages of the fractal system:
• clear session structure
• simple trend/confluence read
• context from Daily ATR
• basic order-flow sentiment
• an on-chart help panel so nobody gets lost
All without overwhelming settings or “indicator soup.”
Use it to see the day as a story: Asia range → London expansion → Pre-NY setup → NY confirmation or reversal.
⸻
⚙️ Main Features
1️⃣ Session Shading (Asia / London / Pre NY / NY)
What it does
• Colors each session with soft, transparent shading:
• Asia – yellow tone
• London – purple tone
• Pre NY – light blue
• NY – light blue (separate time block)
• You can customize the session times and colors.
• Includes a 6:00 pm ET divider line to mark the start of a new “trading day” in your framework.
Why it matters (psychology)
• Your brain stops seeing random candles and starts seeing chapters:
• Asia = range / setup
• London = expansion / fakeouts
• NY = continuation / reversal
• This reduces FOMO and impulsive entries because you naturally ask:
“Which session am I in?”
“What is this session supposed to be doing?”
• The 6pm divider helps you mentally reset each day instead of carrying emotional baggage from yesterday into today.
⸻
2️⃣ Time-Frame Confluence Panel (Weekly → 15m)
What it does
• Checks a simple model on multiple timeframes (W, D, 4H, 1H, 15m):
• Above or below the 50 EMA
• RSI above or below 50
• Converts that into a 0–100% confluence score per TF.
• Gives a %TOTAL score that blends all TFs into a single number.
• Two display modes:
• Strip — horizontal bar with W/D/4H/1H/15m + %TOTAL
• Table — vertical list showing bull% / bear% per TF
• Mobile mode shrinks everything for smaller screens.
Why it matters (psychology)
• Instead of arguing with yourself about “trend,” you get a simple question:
“Are the higher timeframes mostly aligned or mixed?”
• Green/high %TOTAL = “permission” to press your bias, not to over-trade.
• Red/low %TOTAL = natural brake: “This is not the clean trend day. Size down or stay out.”
• It pulls you away from 1-minute tunnel vision and forces you to respect bigger structure.
⸻
3️⃣ Daily ATR Panel (Last 4–12 days + Forecast)
What it does
• Tracks true daily range (High–Low) over recent days.
• Shows:
• Last few days’ range in ticks and $
• Optional 4-day average forecast (projected typical daily move)
• Option to show just last 4 days, or full 12-day history.
• Two modes:
• Table – labeled rows with “ticks / $” columns
• Macro – compact text summary like “FC: 2000t | $20.00”
Why it matters (psychology)
• You stop expecting 5000-tick moves on a 600-tick average day.
• When the forecast is small, you naturally:
• avoid chasing huge targets
• respect partials
• recognize “maybe today just isn’t the big runner”
• On big ATR days, you recognize that volatility is here, so:
• you give your targets breathing room
• you’re less likely to panic when price swings
• This keeps your expectations in line with reality, which reduces tilt, frustration, and revenge trades.
⸻
4️⃣ Order-Flow Sentiment Panel (Compact OF Read)
What it does
• Estimates buy vs sell volume on the current and previous candles.
• Shows:
• Sentiment row with Buy% / Sell%
• Buy/Sell volumes (with “k/m” formatting if enabled)
• Optional extra rows for prior candles.
• Highlights imbalances when one side hits your imbalance threshold (e.g., 70%).
Why it matters (psychology)
• Gives you a quick “who’s in control right now” view without staring at raw volume.
• Imbalance flashes create micro-alerts:
• “This might be a stop run or strong continuation, pay attention.”
• Prevents you from blindly shorting into heavy buy pressure or buying into stacked sell pressure just because of greed or fear.
• Makes your entries feel more validated, which calms you during the trade.
⸻
🧠 Overall Psychological Goal
Worstfx Fractal Sessions Public is not just a visual skin for your charts.
It’s a behavior framework.
It tries to quietly enforce:
• Patience → by tying you to sessions and key time behavior.
• Selectivity → by checking multi-TF trend alignment.
• Realistic expectations → via ATR context.
• Non-impulsive entries → via order-flow imbalance checks.
• Accountability → via clear explanations and structure, not vibes.
Instead of chasing every move, you’re guided into a loop:
“What session am I in? What is ATR saying? Are TFs aligned? Is order-flow confirming? If not, I wait.”
🔋 The risk is minimized by structure & The reward is maximized by timing🔋
Trend Fibo 1.618This indicator is based on the Muslim strategy. I recommend studying it first and also working on a demo account.

Trading Playbook Panel (SMC + EW + Sniper)🔥 What This Script Does
The indicator creates a visual floating panel containing:
1. HTF Bias Framework (H4 → H1 → M15)
Guides you through determining trend, liquidity direction, imbalance zones, and institutional order flow.
2. Valid Setup Models
Covers both:
Continuation setups (displacement → OTE → FVG entry)
Reversal setups (liquidity sweep → CHoCH → retest)
3. 5-Minute Sniper Entry Checklist
Ensures high-precision entries with:
Liquidity sweep
CHoCH
Displacement
FVG formation
Retest entry
Strict invalidation rules
This is the exact logic used in prop-firm and institutional trading models.
4. Stop-Loss & Invalidation Rules
Built with institutional logic:
SL beyond liquidity sweep
SL beyond invalidation swing
Works for both BUY and SELL setups.
5. Multi-Stage Take Profit Mapping
Including:
Internal liquidity
Equal highs/lows
Imbalance
Opposite OB
HTF draw
Designed for partials + runners.
6. Risk-Management System
A complete discipline structure:
0.5–2% risk per setup
Max daily loss
Max trades per day
Stop-after-loss rule
No chasing / no mid-range entries
7. Pre-Trade Checklist
A professional assessment framework to verify trade quality.
8. Trading Psychology Principles
Reinforces mindset, discipline, and patience.
⭐ Who This Script Is For
This tool is ideal for:
SMC traders
ICT style traders
Elliott Wave traders
Scalpers & intraday traders
Prop-firm challengers
Anyone wanting to follow a repeatable, rules-based system
It keeps you consistent, structured, and focused on the highest-probability setups.
🧠 Why This Script Works
Most traders lose because they:
Enter impulsively
Skip rules
Don’t analyze multi-timeframe structure
Enter without liquidity confirmation
Use random entry zones
This script eliminates that.
It forces a clear, step-by-step process:
1️⃣ Top-down bias
2️⃣ Liquidity location
3️⃣ Sweep → CHoCH → Displacement
4️⃣ Refined 5M entry
5️⃣ Strict SL & TP rules
It removes emotion and replaces it with pure process.
⚙️ Customizable
Move the panel anywhere on the chart
Change panel colors
Change text colors
Perfect for dark or light mode
🎯 Summary
This is not a trading signal indicator.
This is your rulebook, your discipline engine, and your playbook — right on your chart.
It keeps you aligned with the highest-probability setups used by advanced SMC and EW traders.
Use it before every trade.
Trade like a professional — every day.

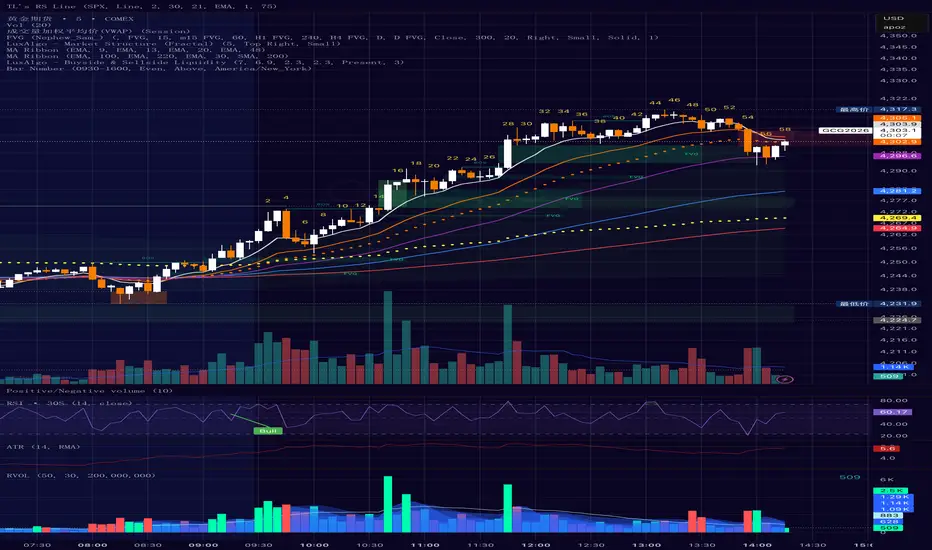
Bar Number IndicatorBar Number Indicator
This Pine Script indicator is designed to help intraday traders by automatically numbering candlesticks within a user-defined trading session. This is particularly useful for strategies that rely on specific bar counts (e.g., tracking the 1st, 18th, or 81st bar of the day).
Key Features:
Session-Based Counting: Automatically resets the count at the start of each new session (default 09:30 - 16:00).
Timezone Flexibility: Includes a dropdown to select your specific trading timezone (e.g., America/New_York), ensuring accurate session start times regardless of your local time or the exchange's default setting.
Smart Display Modes: Choose to show "All" numbers, or filter for "Odd" / "Even" numbers to keep your chart clean.
Custom Positioning: Easily place the numbers Above or Below the candlesticks.
Minimalist Design: Numbers are displayed as floating text without distracting background bubbles.
Dynamische Open/Close Levels mit Historie🎯 Key Features
This indicator provides clean, configurable horizontal lines showing the Open and Close prices of a higher chosen timeframe (e.g., the last 5-minute candle), serving as dynamic support and resistance levels.
Unlike traditional indicators that draw messy "steps" across your entire chart, this tool is designed for clarity and precise control.
Controlled History: Easily define how many of the last completed periods (e.g., 5-minute blocks) should remain visible on the chart. Set to 0 for only the current, active levels.
No Stepladder Effect: Uses advanced drawing methods (line.new and object management) to ensure the historical levels remain static and do not clutter your chart history.
Dynamic Labels: The labels (e.g., "Open (5)") automatically adjust to show the timeframe you configured in the indicator settings, eliminating confusion when switching timeframes.
Customizable: Full control over colors, line length, and label positioning/size.
💡 Ideal Use Case
Perfect for scalpers and day traders operating on lower timeframes (1m, 3m) who want to quickly visualize and respect crucial price action levels from a higher context (e.g., 5m, 15m, 1h).

Entry Scanner Conservative Option AKeeping it simple,
Trend,
RSI,
Stoch RSI,
MACD, checked.
Do not have entry where there is noise on selection, look for cluster of same entry signals.
If you can show enough discipline, you will be profitable.
CT

ADX Indicator with VisualADX Indicator with line and clear number. Identifies when ADX Index is weak, trending, or strong. Depending on timeframe, this indicator can be used to identify early signs of a change in trend.
This is my first time creating an indicator and coding, so please, use it at your own discretion. If anyone has any helpful suggestions, please leave a comment. I can email you the source code so you can revise it. In return, I ask that you share the updated code with me so everyone that uses this indicator can benefit. Thank you! :)
