Quintalytics Trend Sentry 19INDICATOR DESCRIPTION
Quintalytics Trend Sentry is a combination of a Trend direction, Momentum, Sideways/Chop Detection, Trade position setup and Trade position exit indicator. This indicator is suitable for use in all timeframes, chart types (Bar, Renko, Range, etc.) and markets.
Trend Sentry is presented on the chart as a Histogram (values above and below ZERO) along with a signal Trigger line.
TREND DIRECTION and MOMENTUM
The combination of the color and location of the Histogram and Trigger line can provide information on the direction and strength of the trend.
The Color GREEN indicates the presence of a Bullish Momentum.
The Color RED indicates the presence of a Bearish Momentum.
The Color YELLOW indicates that the market is Choppy. Extended periods of YELLOW are typical for a market that has no established trend in the current chart timeframe.
A Histogram ABOVE the ZERO LINE indicates a Bullish Trend.
A Histogram BELOW the ZERO LINE indicates a Bearish Trend.
TRADE POSITION SETUPS
The position of the signal Trigger line in relation to the Histogram can be used as criteria for trade entry, exit, or take profit conditions. These should not be used as the sole method of trading, but rather in conjunction with other indicators and trading strategies, as well as Trailing Stop Loss indicators such as the Quintalytics “Trend, Stop, and Chop”
FOR LONG TRADE POSITION ENTRY CRITERIA OPTIONS:
• A Trigger line Crossing UPWARDS across the ZERO LINE from BELOW
• A TRIGGER LINE Crossing UPWARDS from INSIDE to ABOVE the Histogram
• A Trigger line FALLING, Bouncing off of the ZERO LINE, and then RISING
• A Histogram Crossing UPWARDS across the ZERO LINE from BELOW
FOR SHORT TRADE POSITION ENTRY CRITERIA OPTIONS:
• A Trigger line Crossing DOWNWARDS across the ZERO LINE
• A TRIGGER LINE Crossing DOWNWARDS from INSIDE to BELOW the Histogram
• A Trigger line RISING, Bouncing off of the ZERO LINE, and then FALLING
• A Histogram Crossing DOWNWARDS across the ZERO LINE from ABOVE
FOR LONG TRADE POSITION EXIT/TAKE PROFIT CRITERIA OPTIONS:
• A TRIGGER LINE Crossing DOWNWARDS from ABOVE to INSIDE the Histogram
• A previously RISING Histogram is now FALLING
• The distance between the Histogram line and Trigger line is decreasing
FOR SHORT TRADE POSITION EXIT/TAKE PROFIT CRITERIA OPTIONS:
• A TRIGGER LINE Crossing UPWARDS from BELOW to INSIDE the Histogram
• A previously FALLING Histogram is now RISING
• The distance between the Histogram line and Trigger line is decreasing
SETTINGS
The indicator has FOUR parameters: “Lookback” (# of bars), “Trigger Line Smooth”, “Chop Detect Strength”, and “Color Bar?”. Changing these settings individually or in combination will yield varying results.
Adjusting the “Lookback” will affect the overall level of TREND detection. The larger this number, the longer the timeframe to determine the TREND direction will be used.
Adjusting the “Trigger Smoothing” with smooth the trigger line, but will also slow its reaction time to changes in the market price.
Adjusting “Chop Detect Strength” will control the level of CHOP and SIDEWAYS market detection.
You have the option of COLORING the BAR to match the Current Trend Sentry color.
CHOP

CHOP_LRSI_V1RSI in Laguerre Time with Embedded Fractal Energy
Includes all features of the CHOP_LRSI indicator
Added possibility to select 5x or 25x factor for HTF
All advanced features deactivated by default
Added LRSI crossover/crossunder alert conditions

AM HellachoppyThis script shows choppy zones and attempts to estimate the proceeding direction using a variety of methods. The methods used to calculate the estimate are user configurable.

AM Trend Exhaustion/ChopThis indicator lets you see when a trend may be exhausted and require consolidation, as well as choppy trading zones.
When the oscillator is in the bottom bar, the price is in a chop zone. When it reaches the top bar, it is due for consolidation.


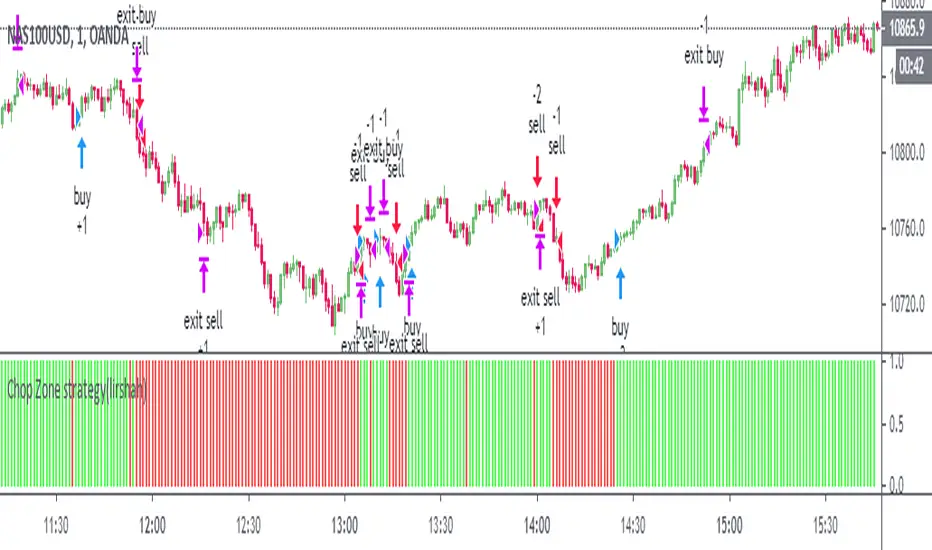
Chop Zone strategy(lirshah)This is a visual indicator designed to identify trends and choppiness.
the Chop Zone illustrates the difference between close price and its EMA by converting its values to colors.
this strategy has best performance on H1 timeframe and has a good results on several crypto pair.
Choppiness IndexThis is another implementation of the Chop index that also has a smoothed chop.
Marked for more visibility the extreme and danger zone crosses.
Colored areas for better visibility.
Added alerts on danger and extreme zone crosses (up/down).
!!! Don't use it as RSI to see overbought and oversold

Pork ChopApproach for detecting price 'chop'.
It's quite simple; instead of trying to detect chop, just measure the weakness of a trend.
This is done by essentially taking two moving averages, measuring their relative difference and then take a moving average of this difference of 'n' periods (Lookback)
The result can be measured against a threshold 'floor' which determines the weakness of the trend and thus, chop.
I use portions from NGBaltic's work: www.tradingview.com so the responsiveness of the detection is slightly higher than bog standard EMAs.
Might be of some interest to bot developers, play with the settings!
Cheers

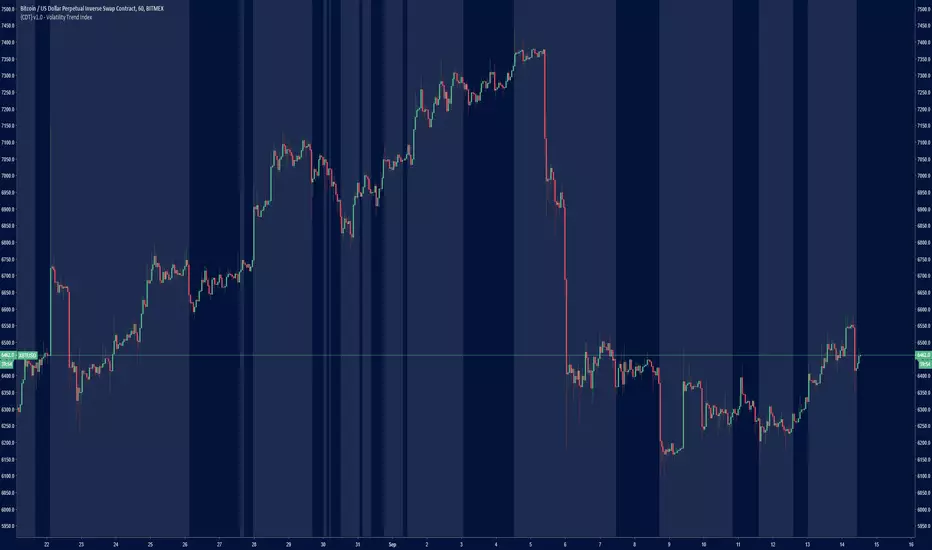
{CDT} v1.0 - Volatility Trend IndexHighlights areas where there is an increase in volatility and trend.
Does not determine direction, just good times to trade.
Action Section, Volatility Choppiness Indicator (by ChartArt)Here is a solution to find entry points to trade. This indicator highlights price sections with low choppiness, where both the ADX (Average Directional Index) indicator shows strong movement (up or down!) in the price and a customized Money Flow indicator (which uses only the change of the volume not the change of the price, hence a Volume Flow indicator), also shows volatility is present. Using higher filter values than the default setting of "30" reduces the noise, but also shows less 'action sections'. Vice versa using values lower than "30" increases the amount and duration of action sections which are shown.
The "action section" indicator does not show the direction if the price is going up or down. It shows if there is enough action worthy the time to trade (lower odds of a neutral sideways trend). Therefore in addition a Heikin-Ashi based price change indicator can optionally be plotted, which shows the actual direction of the price.
Action Section, High Volume Volatility & Low Price Choppiness Indicator
This indicator works only on charts which have volume data.

UCS_Ready Set Go2017 - First Code
This is a another way of looking at DMI indicator. Almost similar to any oscillator. You still need to understand the indicator and chart before you can trade with these.
---------------------------------------------------------------------------

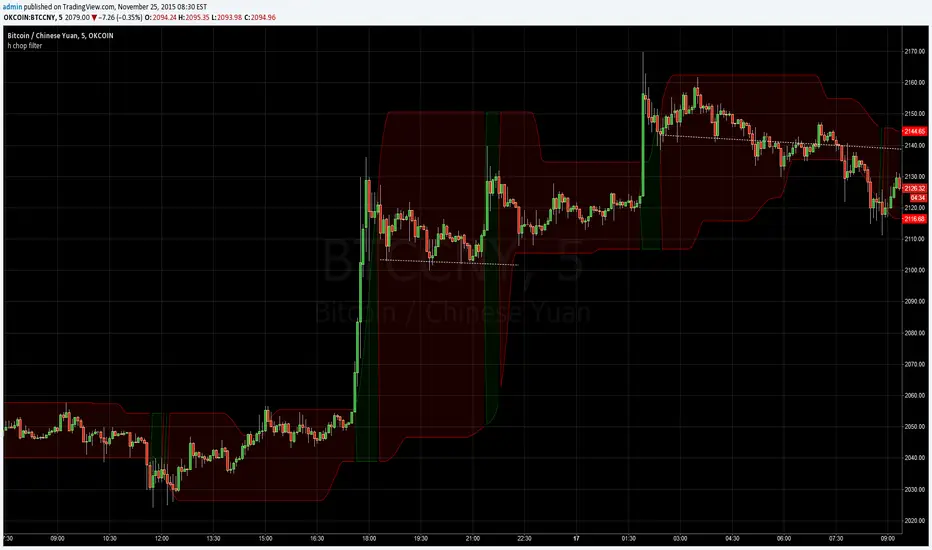
h chop filter v1.1
Chop Filter based on Chaikin's Volatility but faster with 0 lag.
Use it to filter out (in brown) when it is not worth trading as we are in chop zone.
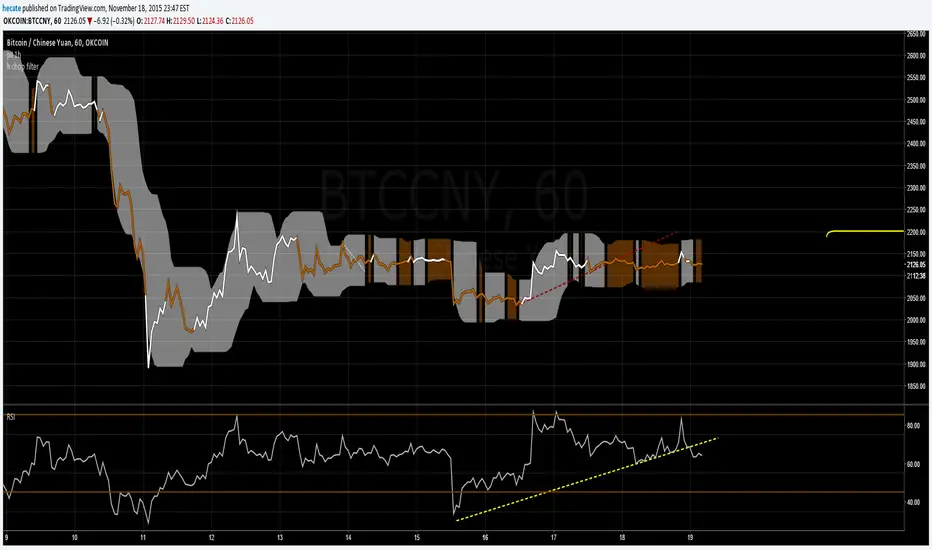
hecate chop filterChop Filter to remove lateral trade under a threshold. Change the FilterOut parameter to filter all you want. Example of a model using it with a filtering of 0.003 (use to filter out to the level you prefer):