Real-Time Price Comparator→ La version française se trouve plus bas ←
Real-Time Price Spread Comparator
This indicator allows you to compare the real-time price difference (spread) between two assets. It is particularly useful for spotting arbitrage opportunities or price discrepancies between different markets.
💡 Why is this useful?
This tool is especially practical for monitoring the gap between CME futures and the spot market. If the spread becomes too large, we can expect the market to rebalance, which can help anticipate potential price movements.
📌 Features:
✅ Compare two assets of your choice (default: BTC CME vs. BTC OANDA).
✅ Displays the spread as a real-time value on the chart.
✅ Customizable threshold for alerts when the spread exceeds a certain value.
✅ Visual alert: The label changes color and an alert icon appears when the threshold is exceeded.
✅ Adjustable label position to avoid obstructing candlestick wicks.
🛠️ How to Use:
1️⃣ Choose the asset to compare (for example, BTC CME).
2️⃣ Select the main chart (the one you are currently viewing, such as BTC OANDA).
3️⃣ Set the alert threshold (the spread value that will trigger an alert).
4️⃣ Adjust the label position using the offset settings if needed.
5️⃣ When the spread exceeds the threshold, an alert will be displayed!
-------------------------------------------------
Comparateur de Spread en Temps Réel
Cet indicateur permet de comparer en temps réel la différence de prix (spread) entre deux actifs. Il est particulièrement utile pour détecter des opportunités d’arbitrage ou des écarts de prix entre différents marchés.
💡 Pourquoi c'est utile ?
Cet outil est pratique pour surveiller l’écart entre les contrats à terme CME et le marché spot. Si l’écart devient trop important, on peut s’attendre à ce que le marché s’équilibre, ce qui peut nous orienter sur les futurs mouvements du prix.
📌 Fonctionnalités :
✅ Comparez deux actifs de votre choix (par défaut : BTC CME vs. BTC OANDA).
✅ Affiche le spread en temps réel directement sur le graphique.
✅ Définissez un seuil d’alerte pour être notifié visuellement sur le graphique si le spread dépasse une certaine valeur.
✅ Alerte visuelle : le label change de couleur et une icône d’alerte apparaît en cas de dépassement.
✅ Ajustez la position du label pour éviter qu’il ne cache les mèches des bougies.
🛠️ Comment l’utiliser :
1️⃣ Choisissez l’actif à comparer (exemple : BTC CME).
2️⃣ Sélectionnez ensuite l’actif affiché sur votre graphique principal (exemple : BTC OANDA).
3️⃣ Définissez le seuil d’alerte (valeur du spread qui déclenchera une alerte).
4️⃣ Ajustez la position du label grâce aux options d’offset si nécessaire.
5️⃣ Si le spread dépasse le seuil, une alerte visuelle apparaîtra !
Comparisontool

Time Based Comparison Tool [TFO]The goal of this indicator is to show how multiple assets are trading relative to their Previous Highs and Lows. Many traders have probably seen charts resembling this that may plot how asset prices are trading as a percent change over time, or something similar.
The key difference with this indicator is that all prices are normalized to reflect how they are trading with respect to the previous range of a user-defined timeframe. Without the normalization process, we would simply be observing some percent change from a given point in time; but this does not provide enough information to describe where price is trading relative to our desired frame of reference.
For example, if the timeframe setting was chosen to be 1 day, the indicator would plot the Previous High (PH) and Previous Low (PL) of the current symbol on the daily timeframe, denoted here by the black lines and labels. Then, the adjusted price of all selected symbols would be shown to visualize how each one is moving with respect its own PH and PL, using the current symbol's PH and PL as reference points.
In the above chart, we can see that CL was trading below its PDL from about 10:00-11:00 am EST, then broke above and retested it at around 11:20 am EST, before trading higher. To verify that this comparison works as intended, we can check to see that CL did in fact retest its PDL at this time before trading higher. Note that we are using the close price for this evaluation.
Since limiting the output to close prices can leave out some vital information, we can change the Plot Type setting from "Close" to "High to Low," which will instead show the range of prices from high to low instead of just the close.
We can expand on this by detecting when PH's and PL's have been raided (traded through), by displaying the text PHR (Previous High Raid) or PLR (Previous Low Raid) next to the symbol's label on the right. In this case below, where we're using the 1 week timeframe, we can observe that NQ1! (purple) traded through the PL level and thus its label (right) is updated to indicate a PLR.
Similarly, YM1! traded through its PH level and was updated to indicate a PHR; and ES1! raided both levels, with its label reflecting just that.
Due to the native limitation of output series in a single pine script, alerts have been consolidated to "Any PHR" or "Any PLR," meaning these alerts would fire if any of the selected symbols raided a PH or PL, respectively. If one wanted to be alerted for just a specific symbol, this could be achieved by deselecting all symbols except that which is desired, then setting an alert and adjusting its title for easier user recognition.

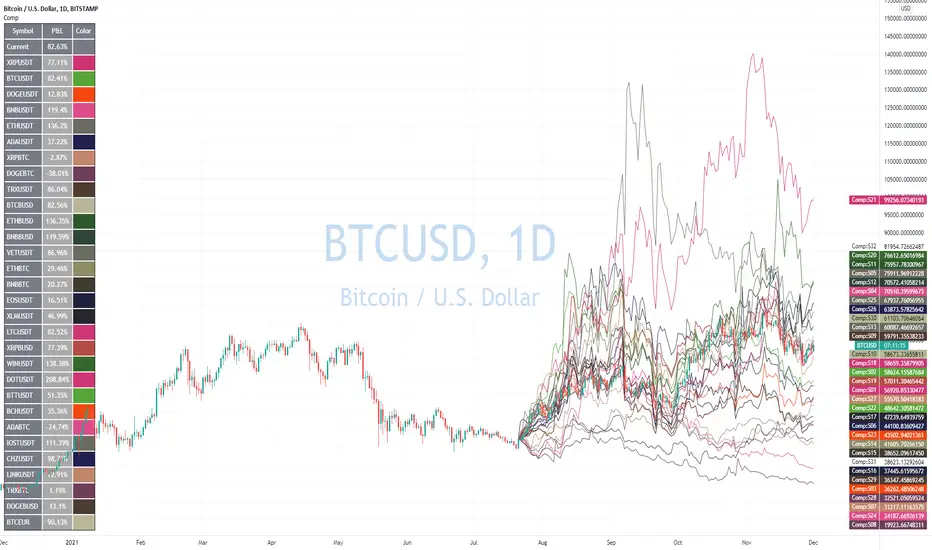
Advanced Comparison ToolWith the new Pine Script features you can build pretty interesting scripts.
Here is my try to expand functionality of basic comparison tool you have in TradingView.
When you apply it on your chart you can select a bar when do you want to start comparing your instrument from.
In parameters you can specify up to 32 symbols to compare. You can also disable symbols and change color for them as well.
As a result you'll see a table with summary and line for every instrument you selected as if it started from the close of the selected bar.
Disclaimer.
Please remember that past performance may not be indicative of future results.
Due to various factors, including changing market conditions, the strategy may no longer perform as well as in historical backtesting.
This post and the script don’t provide any financial advice