KIMATIX Info TableKIMATIX Info Table is an executive-grade market dashboard that brings real-time orderflow, volume dynamics, directional bias, and signal confirmation directly onto your chart.
Instead of guessing market conditions, this tool quantifies them and displays structured, colour-coded insights—giving traders the ability to read context at a glance.
It tracks live Buy/Sell pressure, session-based CumDelta behaviour, higher-timeframe directional flow, relative volume, heatmap sentiment, and signal strength.
The result is a transparent market interpreter—ideal for traders who want objective insight instead of subjective opinion.
The table shows:
Active Buy vs Sell volume
Buy/Sell probability weights
CumDelta bias & pressure shifts
Higher-timeframe trend direction (HTF Bias)
Negative-delta heatmap (selling pressure %)
Relative volume acceleration
Signal plots mark valid opportunities directly on the chart, and built-in alerts enable automation or notifications.
Designed for scalpers, orderflow traders, and systematic decision-makers who demand clarity without clutter.
Key Features
• Real-time orderflow breakdown (Buy vs Sell strength)
• Higher-timeframe directional bias confirmation
• Session-reset CumDelta tracking
• Dynamic sentiment heatmap
• Relative volume acceleration detection
• Trade signal classification with alerts
• Visual chart markers for Long/Short events
Benefits for Traders
• Understand whether buyers or sellers control the tape
• See whether momentum is supported or fading
• Identify when trend and orderflow align
• Receive confirmed timing signals without guessing
• Suitable for scalping, intraday trading, futures, indices, crypto, FX
A compact institutional-style dashboard for traders who think in probabilities—not emotions.
Cumulative Volume Index (CVI)

ZScore SemiConductoresZ-Score of Semiconductor Sector Volume
This custom Pine Script indicator applies a Z-Score calculation to the aggregated trading volume of leading semiconductor companies. The goal is to highlight statistical extremes in sector activity that may signal unusual market behavior.
🔧 How it works
- Fixed ticker list: NVDA, AVGO, TSM, AMD, ASML, MU, ARM, ON, TXN, QCOM, INTC.
- Aggregate volume: The script sums the trading volume of all tickers in the list for the selected timeframe.
- Z-Score calculation:
- Moving average and standard deviation are computed over a configurable window (default = 50 bars).
- Formula:
Z= (Current Volume - Mean) / Standard Deviation
Visualization:
- Z-Score plotted in green.
- Reference lines at 0, ±1σ, ±2σ.
- Labels (triangles) mark critical signals when Z > +2 or Z < -2.
📈 Why it matters
- Detects abnormal surges or drops in sector-wide volume.
- Highlights potential euphoria (+2σ) or panic (-2σ) moments.
- Useful as a filter for trading strategies or as a sector-level alert system.
⚠️ Disclaimer: This script is for educational purposes only and not financial advice

NC-ALPHA INDEX [Pro Pane] - Smart Money Flow01. THE PROBLEM: MARKET CAP IS A LAGGING INDICATOR
Standard crypto indices (like Coin50 or Total Market Cap) are weighted by capitalization. This is a flawed model for active traders because it prioritizes "Dino Coins"—older assets with massive supplies but very little active volume or price discovery. They are heavy, slow, and hide the real story.
02. THE SOLUTION: VOLUME-VELOCITY WEIGHTING
The NC-ALPHA INDEX is designed for SMC (Smart Money Concepts) traders who need to see where the real liquidity is flowing right now.
Instead of static weighting, this script dynamically adjusts the influence of each asset based on its Real-Time Dollar Volume.
High Volume = High Impact: If a specific asset (e.g., SOL, HYPE, or PEPE) is attracting massive liquidity inflow, its weight in the index increases instantly.
Low Volume = Low Impact: Assets with no volume ("Zombie coins") have minimal impact on the index line, preventing false signals.
03. THE "MARKET DRIVERS" BASKET
The index tracks a curated basket of 10 high-velocity assets representing the current market meta:
1 - Kings: BTC, ETH
2 - Market Leaders: SOL, BNB
3 - High Beta / L1s: SUI
Sector Proxies: DOGE (Memes), HYPE (DEX/Perps), AAVE (DeFi), LINK (Infra), XRP.
04. HOW TO TRADE WITH IT
A. The Divergence (Trap Detector) If Bitcoin is making a Higher High (HH) at a Key Resistance, but the NC-ALPHA Index is making a Lower High (LH) or stagnating:
Signal: The pump is unsupported by broad liquidity. It is likely a "Fake Pump" driven by wash trading or isolated manipulation. High probability of an SFP (Swing Failure Pattern).
B. The HUD (Heads-Up Display) The dashboard on the chart shows you exactly what is moving the market.
Look at the "W%" (Weight) column.
Signal: If an Altcoin (like SUI or HYPE) suddenly exceeds 15-20% weight, a Sector Rotation is occurring. Stop watching BTC and focus on that asset.
05. TECHNICAL NOTES
Crash Proof: Built with advanced nz() data handling to prevent the "disappearing line" bug common in composite indices.
Usage Rule: For accurate calculation, use this indicator on 24/7 Crypto Charts (BTC, ETH, SOL) rather than Traditional Finance charts (VIX, SPX) to avoid weekend data gaps.
Built by KheopsCrypto for the SMC Community.

mrD-Volume Profile HeatmapThis indicator combines advanced volume analysis with institutional-grade visualization techniques to provide traders with a comprehensive view of market structure and liquidity zones.
WHAT MAKES THIS UNIQUE:
• Proprietary bidirectional volume profiling algorithm that separates buying and selling pressure using VWAP deviation analysis, not standard volume bars
• Custom heatmap visualization engine with adaptive gradient calculation based on volume-weighted price distribution across multiple timeframes
• Integrated Weekly VWAP with hlc3 weighting for institutional reference levels
• Dynamic POC (Point of Control) detection with fixed-height text boxes for clarity
• Optimized rendering system that handles 500+ bars efficiently without lag
HOW IT WORKS:
The algorithm analyzes volume distribution at each price level within the lookback period, applying a proprietary weighting system that considers:
1. Volume-weighted average price (VWAP) deviation to classify volume as bullish/bearish
2. Price levels are binned into customizable rows (bins) for granular analysis
3. Volume bars extend bidirectionally: positive volume (green) extends left, negative volume (red) extends right
4. Heatmap overlay uses multi-level gradient mapping (6-color spectrum) to highlight high volume nodes
5. Weekly VWAP provides macro trend reference with session-based reset logic
VOLUME PROFILE MECHANICS:
• Calculates volume distribution across price levels using a grid-based binning system
• Each bin accumulates volume when the price touches that level
• Positive/negative classification based on VWAP position (above = bullish, below = bearish)
• POC automatically identifies the price level with maximum volume concentration
• Display shows volume intensity through color gradients and bar lengths
HEATMAP VISUALIZATION:
• Uses exponential gradient multiplier (default 1.9) for enhanced contrast
• Color transitions: Dark Blue (low volume) → Cyan → Green → Yellow (high volume)
• Transparency-adjusted overlays ensure chart readability
• Real-time updates as new volume data arrives
WEEKLY VWAP INTEGRATION:
• Resets at the start of each trading week (request.security logic)
• Uses hlc3 (typical price) as the volume-weighted source
• Provides institutional reference level for swing traders
• Yellow color (#FFEB3B) for easy identification
KEY PARAMETERS:
• Period: Lookback window for volume calculations (default: 500 bars)
• Bins: Number of price levels for volume distribution (default: 150 rows)
• Offset: Horizontal positioning of volume bars (default: 50)
• Heatmap Rows: Granularity of heatmap overlay (default: 250)
• POC displays actual volume numbers for transparency
TRADING APPLICATIONS:
→ Identify high-volume nodes as support/resistance zones
→ Detect liquidity clusters where institutional orders concentrate
→ Spot low-volume areas where price may move quickly (thin zones)
→ Use bidirectional volume to assess buying vs selling pressure
→ Combine with Weekly VWAP for multi-timeframe confluence
→ POC levels often act as price magnets (mean reversion targets)
TECHNICAL IMPLEMENTATION NOTES:
• Optimized for intraday to swing timeframes (1m to Daily charts)
• Volume calculations use session-based accumulation (no future data)
• Box rendering is limited to 500 objects for performance
• Gradient calculations use mathematical power functions for smooth transitions
• VWAP calculation follows institutional standard (volume-weighted hlc3)
RESTRICTIONS:
This is a proprietary algorithm. Redistribution, modification, or commercial use is strictly prohibited. The logic and methods contained herein are confidential and protected intellectual property.
═══════════════════════════════════════════
DISCLAIMER & RISK WARNING
This indicator is provided solely for educational and informational purposes. It is designed to help traders understand market structure, volume distribution, and price action analysis. This tool should be used as part of a comprehensive trading education program.
NOT FINANCIAL ADVICE:
The information and signals provided by this indicator DO NOT constitute financial advice, investment advice, trading advice, or any other sort of advice. You should not treat any of the indicators' content, outputs, or signals as such. Nothing contained in this indicator constitutes a solicitation, recommendation, endorsement, or offer to buy or sell any securities or other financial instruments in this or in any other jurisdiction.
NO GUARANTEED RESULTS:
Past performance is NOT indicative of future results. The historical backtesting results, volume patterns, and statistical data shown by this indicator do not guarantee future performance or success. Market conditions change constantly, and what worked in the past may not work in the future. Trading and investing involve substantial risk of loss.
MARKET VOLATILITY:
Financial markets are inherently volatile and unpredictable. Volume patterns, support/resistance levels, and other technical indicators can fail at any time. No indicator can predict market movements with certainty. Always use proper risk management and position sizing.
By using this indicator, you acknowledge that you have read, understood, and agree to this disclaimer in its entirety. If you do not agree with any part of this disclaimer, you should not use this indicator.

CVD Smart ReversalCVD Smart Reversal - Indicator Description
═══════════════════════════════════════════════════════════════
🎯 OVERVIEW
Advanced reversal detection system based on Cumulative Volume Delta (CVD) analysis with intelligent quality filtering. Each signal is rated 1-5 stars based on multiple confirmation factors.
═══════════════════════════════════════════════════════════════
🌟 KEY FEATURES
1. Quality Score System (⭐1-5)
• 5 independent criteria evaluate each signal
• Filter weak setups - show only 3+ star signals
• Higher scores = higher probability setups
2. Adaptive Thresholds
• Automatically adjusts to market volatility
• High volatility = stricter criteria
• Works across all market conditions
3. Volume Context Analysis
• Compares current vs historical volume
• Calculates buy/sell pressure (requires >60%)
• Filters reversals with weak volume
4. Multi-Timeframe Confirmation (Optional)
• Validates signals on higher timeframe
• Ensures trading with the trend
• Reduces counter-trend entries
5. Smart Signal Management
• Minimum 5-bar spacing between signals
• Automatic label cleanup (max 20)
• Clean chart, no clutter
═══════════════════════════════════════════════════════════════
📊 HOW IT WORKS
CVD Calculation:
Custom volume delta calculation using intrabar polarity estimation.
Signal Detection:
Combines CVD reversal, candlestick patterns (Hammer, Shooting Star, Engulfing, Pin Bar), and divergence analysis.
Quality Scoring:
Each signal scores 0-5 points based on:
• CVD strength (statistical deviation)
• Pattern quality (professional recognition)
• Divergence presence
• Volume context (ratio + pressure)
• Trend confirmation (MTF or acceleration)
═══════════════════════════════════════════════════════════════
🎮 USAGE MODES
Sniper Mode (High Quality):
• Min Score: 4-5 stars
• MTF: ON
• Result: 2-5 signals/day, highest win-rate
Active Mode (Balanced):
• Min Score: 3 stars
• MTF: OFF
• Result: 5-15 signals/day, good balance
Scalping Mode (High Frequency):
• Min Score: 2 stars
• Divergence: Weak
• Result: Many signals, fast execution needed
═══════════════════════════════════════════════════════════════
💡 BEST PRACTICES
• Use on liquid markets with reliable volume data
• Combine with key support/resistance levels
• Pay attention to quality scores - 4-5★ have significantly higher success
• Enable MTF confirmation for intraday trading
• Use stricter settings during high-impact news events
═══════════════════════════════════════════════════════════════
⚙️ DEFAULT SETTINGS
• Quality Filter: ON
• Minimum Score: 3 stars
• MTF Confirmation: OFF
• Volume Analysis: ON
• Divergence Strength: Medium
These settings provide 5-15 quality signals per day on active instruments.
═══════════════════════════════════════════════════════════════
🔔 ALERTS
Four alert types available:
• Strong Bullish Reversal (4-5★ only)
• Strong Bearish Reversal (4-5★ only)
• Regular Bullish Reversal (all qualified)
• Regular Bearish Reversal (all qualified)
═══════════════════════════════════════════════════════════════
⚠️ LIMITATIONS
• Requires volume data (not suitable for markets without volume)
• MTF confirmation adds lag by design
• Lower timeframes may need adjusted settings
• Quality filter reduces signal frequency by design
═══════════════════════════════════════════════════════════════
🎯 ORIGINALITY
This indicator combines multiple unique elements:
• Multi-factor quality scoring (not found in other CVD tools)
• Adaptive volatility-based thresholds
• Volume pressure calculation with directional filter
• Integrated MTF confirmation within scoring system
• Smart label management with automatic cleanup
The quality scoring system transforms CVD analysis from binary signals into a ranked opportunity system, allowing traders to prioritize setups based on confluence strength.
═══════════════════════════════════════════════════════════════
📈 DISPLAY ELEMENTS
• Background highlighting on signal bars
• Triangle markers at entry points
• Labels showing CVD, Delta, Divergence, Quality Score, Volume flag
• Real-time info panel with CVD metrics
• Clean visual presentation
═══════════════════════════════════════════════════════════════
✅ SUITABLE FOR
• Crypto (BTC, ETH, etc.)
• Stocks (AAPL, TSLA, SPY, etc.)
• Futures (ES, NQ, CL, etc.)
• Forex (brokers with volume data)
• All timeframes (1m to 1D)
═══════════════════════════════════════════════════════════════

NeuraEdge Delta Flow Pro V1.0INSTITUTIONAL ORDER FLOW ANALYSIS
NeuraEdge Delta Flow Pro reveals the hidden battle between buyers and sellers that traditional indicators miss. While price shows you WHAT happened, Delta Flow shows you WHO won the fight.
═══════════════════════════════════════════════
⚡ WHAT MAKES THIS UNIQUE?
Unlike basic volume indicators that just show size, Delta Flow analyzes:
- Bar-by-bar order flow direction (buying vs selling pressure)
- Cumulative Volume Delta (CVD) for institutional accumulation/distribution tracking
- Normalized strength metrics (0-100%) for conviction measurement
- Hidden divergences that predict reversals before they happen
Most order flow tools require expensive data feeds. Delta Flow uses advanced price action algorithms to estimate institutional flow on ANY timeframe, ANY market - all within TradingView.
═══════════════════════════════════════════════
📊 VISUAL COMPONENTS
DELTA HISTOGRAM
- Green bars = Buying pressure dominates
- Red bars = Selling pressure dominates
- Bright colors = Strong conviction (>70% threshold)
- Faded colors = Weak/normal pressure
CVD LINE (Blue)
- Rising = Buyers accumulating (institutions buying dips)
- Falling = Sellers distributing (institutions selling rallies)
- Divergence from price = Early reversal warning
DIVERGENCE SIGNALS
- Green Triangle = Bullish divergence (price LL, delta HL)
- Red Triangle = Bearish divergence (price HH, delta LH)
REAL-TIME DASHBOARD
- Current delta state (Strong Buy/Sell/Neutral)
- Normalized strength percentage
- CVD trend direction
- 20-bar pressure statistics
═══════════════════════════════════════════════
🎯 HOW TO USE IT:
1. SIGNAL CONFIRMATION
Your indicator says BUY → Check delta → Green = Take it ✅ | Red = Skip ⚠️
2. DETECT WEAK MOVES
Price rallies but delta is red = Distribution (sellers unloading into strength)
Price drops but delta is green = Accumulation (buyers absorbing weakness)
3. SPOT REVERSALS EARLY
Divergence triangles often precede major turning points by several bars
4. GAUGE CONVICTION
Strong delta (bright colors) = High probability the move continues
Weak delta (near zero) = Chop zone, reduce size or stay flat
═══════════════════════════════════════════════
💎 WHY CLOSED SOURCE?
Delta Flow uses a proprietary calculation method developed through extensive testing to provide the most accurate order flow estimation possible within TradingView's data limitations.
The closed-source model protects the methodology and ensures consistent results for all users, while preventing modifications that could lead to confusion or misinterpretation of signals.
═══════════════════════════════════════════════
⚙️ CUSTOMIZABLE SETTINGS
DELTA CALCULATION
- 3 estimation methods (Price Action, Candle Body, Wick Weighted)
- Smoothing options (1-10 periods)
CUMULATIVE DELTA
- CVD line toggle
- Auto-reset period (0-100 bars, or never)
- Custom line color
DISPLAY OPTIONS
- Toggle histogram on/off
- Toggle divergence signals
- Toggle dashboard
- Custom buying/selling/neutral colors
THRESHOLDS
- Strong delta percentage (50-95%, default 70%)
- Threshold line display toggle
DIVERGENCES
- Pivot lookback length (2-15 bars)
- Sensitivity control
═══════════════════════════════════════════════
📊 REAL MARKET EXAMPLE: EXHAUSTION PATTERN
The chart above shows SPY on the 1-hour timeframe with two critical exhaustion points where Delta Flow provided early reversal warnings:
Exhaustion Point 1 (Left):
- Price: Made higher high
- Delta: RED bars (selling pressure)
- CVD: Falling (net sellers)
- Signal: Green divergence triangle
- Outcome: Reversal down
Exhaustion Point 2 (Right):
- Price: Pushed to new high
- Delta: RED bars persist (weak buyers)
- CVD: Continued bearish
- Signal: Red divergence triangle
- Outcome: Sharp decline
The Pattern:
When price makes new highs but delta remains negative with falling CVD, it indicates:
1. Institutional selling into retail buying
2. Weak hands driving price (exhaustion)
3. Smart money distributing (preparing for reversal)
The divergence triangles appeared BEFORE the major moves down, giving traders advance notice to either exit longs or prepare shorts.
This is why Delta Flow is most powerful when used to FILTER signals from other indicators - it reveals when rallies/selloffs lack conviction.
═══════════════════════════════════════════════
📈 BEST PRACTICES
✅ Use with your primary trading system as confirmation
✅ Works on all timeframes (best on 15m+)
✅ Most effective on liquid markets (major pairs, indices, popular crypto)
✅ Pay attention to CVD trend for bigger picture
✅ Divergences are powerful but wait for price confirmation
❌ Not a standalone system - designed for confluence
❌ Less reliable on low-volume instruments
❌ Avoid trading when delta is near zero (indecision zone)
═══════════════════════════════════════════════
🔔 ALERT SYSTEM
6 customizable alerts:
- Strong Buying Pressure
- Strong Selling Pressure
- Bullish Divergence
- Bearish Divergence
- Delta Flip Bullish
- Delta Flip Bearish
═══════════════════════════════════════════════
🎓 INCLUDED RESOURCES
Upon invite approval, you receive:
- Complete user guide (PDF)
═══════════════════════════════════════════════
⚠️ IMPORTANT NOTES
- This is an ESTIMATION of order flow based on price action and volume
- TradingView does not provide tick-by-tick data required for true order flow
- Works as a highly effective proxy for institutional pressure
- Designed for traders who understand order flow concepts
- Best results when combined with structure-based analysis
═══════════════════════════════════════════════
💬 TO REQUEST INVITE ACCESS FOR 7 DAYS TRIAL
write email to support@neura-edge.com with your username
═══════════════════════════════════════════════
💬 Questions or feedback? Leave a comment below.
🌐 Check out our full Indicator Suite: neura-edge.com/
📧 Support: support@neura-edge.com
INSTITUTIONAL PRECISION. RETAIL EXECUTION.

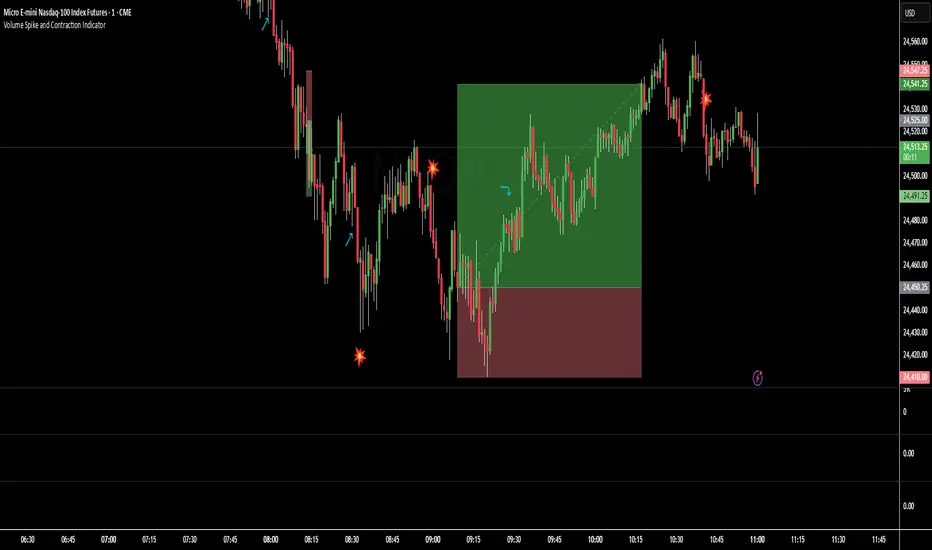
Volume Spike and Contraction IndicatorSimple script to map volume contractions and spikes with emojis and plots above or below depending on the flow of the signal
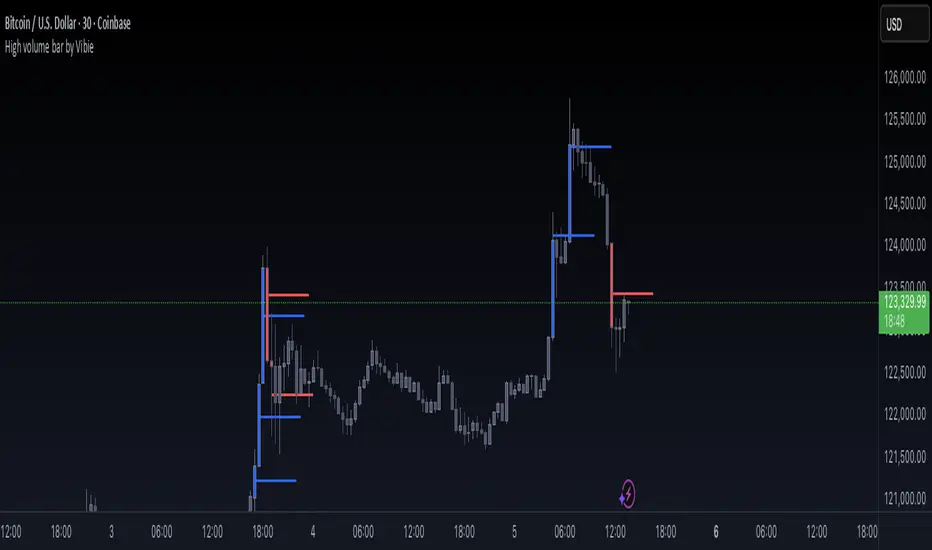
High volume bar by VibieHigh Volume Bar with Extended vPOC (Aggregation Enabled)
🧠 Concept
This indicator is designed to detect institutional activity and large traders by using statistical volume analysis and identifying key intrabar liquidity levels.
It applies Z-Score volume analysis to highlight unusually high volume candles and marks the Volume Point of Control (vPOC) inside each detected bar — the price level where the most volume was transacted.
⸻
⚙️ How It Works
1. Z-Score Volume Analysis
• The indicator calculates how far current volume deviates from its historical average using standard deviations (Z-Score).
• When the Z-Score exceeds the user-defined threshold, the candle is flagged as a High Volume Bar (HVB).
2. Multi-Exchange Aggregation
• Volumes from Binance, Bybit, and Coinbase can be aggregated into a composite volume metric.
• This provides a broader and more accurate market perspective, minimizing anomalies from individual exchanges.
3. Candle Coloring
• Bullish HVB → entire candle (body + wicks) is colored blue.
• Bearish HVB → entire candle is colored red.
• This makes large volume events immediately visible on the chart.
4. vPOC Detection
• The script examines a lower timeframe (e.g., 1 minute) within the HVB to find the price level with the highest traded volume.
• A horizontal line is drawn at that price and can be extended for multiple bars, marking a short-term liquidity zone that often acts as support or resistance.
⸻
🧭 How to Use
• vPOC levels frequently act as liquidity magnets and are often retested after the HVB appears.
• Bullish HVB + vPOC below current price = potential long entry zone.
• Bearish HVB + vPOC above price = potential short entry zone.
• Useful for identifying institutional absorption, stop runs, or hidden accumulation/distribution.
⸻
🌟 Why It’s Original and Useful
• Combines statistical volume analysis (Z-Score) with intrabar volume profiling.
• Aggregates multiple exchanges for broader accuracy.
• Offers precise liquidity levels that classic indicators don’t provide.
• Especially valuable for advanced traders looking for institutional footprints.
Volume Aggregated Spot & Futures -- Crypto (by plyst & more)📊 Volume Aggregated Spot & Futures - Enhanced Edition
🎯 Overview
Advanced volume aggregation indicator that combines spot and perpetual futures volume across the top 10 cryptocurrency exchanges. This enhanced version builds upon the original work by @HALDRO Project with optimized calculations and expanded functionality.
✨ Key Features
- 📈 Real-time aggregated volume from 10 major exchanges (Binance, Bybit, OKX, Coinbase, Bitget, KuCoin, Kraken, MEXC, Gate.io, HTX)
- 🔄 Multiple visualization modes: Volume, Delta, Cumulative Delta, Spot vs Perp analysis, Liquidations, OBV, and MFI
- 💱 Multi-currency support: Display volume in COIN, USD, or EUR
- 🎨 Clean, single-color bar chart showing total cumulative volume
- 📊 Multiple calculation methods: SUM, AVG, MEDIAN, VARIANCE
- 🎯 Separate spot (USDT, USD, USDC, etc.) and perpetual futures (.P contracts) tracking
🔧 Technical Improvements
✓ Corrected MFI formula for accurate money flow calculations
✓ Optimized volume aggregation logic with proper NA handling
✓ Support for 10 exchanges (up from 9)
✓ Streamlined codebase for better performance
✓ Updated perpetual contract naming conventions (.P format)
📖 Usage
Perfect for analyzing total market volume, identifying liquidation events, tracking buyer/seller pressure through delta analysis, and understanding the spot vs futures market dynamics.
🙏 Credits
Original concept and framework by @HALDRO Project. This version includes mathematical corrections, code optimizations, and expanded exchange support.
⚠️ Note
Aggregated volume is calculated from external exchange data using request.security(). Ensure your plan supports the necessary security calls for optimal performance.
CCI PKTELUGUTRADERThe Commodity Channel Index (CCI) is a momentum oscillator that helps traders identify potential buy and sell opportunities by measuring how far the price of a security deviates from its average price over a specific period. It’s widely used for spotting new trends, overbought and oversold conditions, and possible price reversals in various financial markets.
Description of CCI
The CCI calculates the difference between the current price and its historical average price, normalized by mean deviation. Unlike indicators such as RSI, the CCI is an unbounded oscillator, meaning its values can go above +100 or below -100, providing broader insights into momentum shifts in prices.
The formula for CCI is:
CCI
=
Typical Price
−
SMA of Typical Price
0.015
×
Mean Deviation
CCI=
0.015×Mean Deviation
Typical Price−SMA of Typical Price
where:
Typical Price = (High + Low + Close) / 3
SMA is the Simple Moving Average of the Typical Price over the chosen period
Mean Deviation is the average deviation from the SMA.
Buy and Sell Signals
A buy signal is typically generated when the CCI moves above +100, indicating the start of a strong uptrend.
A sell signal occurs when the CCI drops below -100, signaling a strong downtrend.
Many traders close their buy positions when the CCI falls back below +100 and close their sell positions when it rises above -100, or use price action confirmation to validate signals.
Values above +100 suggest overbought conditions, while below -100 indicate oversold; extreme values (like +200 or -200) suggest even stronger momentum.
CCI divergences (price moves not confirmed by the indicator) may indicate potential reversals.
Summary Table: CCI Signals
CCI Level Market Condition Potential Action
Above +100 Overbought/Uptrend Consider Buying
Below -100 Oversold/Downtrend Consider Selling
Back between -100 and +100 Neutral/Indecision Exit or Wait
The CCI is best used alongside other technical indicators for confirmation, as it can generate false signals during sideways markets.
References:
Guide to Commodity Channel Index
What Is CCI?
CCI Trading Strategies
CCI: Technical Indicator
Commodity channel index

Rapid Cumulative Delta Proxy (Close vs Close)Rapid Cumulative Delta Proxy (Close vs Close)
1. Summary
This indicator provides a powerful proxy for Cumulative Delta , offering insight into the buying and selling pressure within each candle without requiring access to specialized tick data. It works by analyzing a Lower Timeframe (LTF) of your choice and accumulating the volume based on simple price changes, then displaying the results in a clean, customizable "footprint-style" table on your main chart.
This tool is designed for traders who want to understand the underlying order flow dynamics and see whether buyers or sellers were more aggressive during the formation of a candle.
2. Key Features
Cumulative Delta Proxy: Calculates delta by comparing the close of each LTF bar to the previous one, assigning volume to either buyers or sellers.
Lower Timeframe Analysis: Gives you the flexibility to choose any LTF (e.g., 1-minute, 5-minute, or even seconds) to build your delta analysis, allowing for granular or broad views.
Historical "Footprint" Table: Displays data for the current, developing bar as well as a user-defined number of previous bars, allowing for immediate historical context.
Live Data Monitoring: The top row of the table always shows the real-time, developing values for the current bar.
Full Visual Customization: Provides extensive options to control the table's position, colors, and text styles to perfectly match your chart's theme.
3. Calculation Mechanism
The logic of this indicator is straightforward and transparent. For every single bar on your main (Higher Timeframe) chart, the script performs the following steps:
Data Collection: The script uses the request.security_lower_tf() function to gather all the close and volume data from the user-specified Lower Timeframe that falls within the current HTF bar.
Volume Allocation: It then iterates through each of these LTF bars to determine if it represented buying or selling pressure.
If an LTF bar's close is greater than the close of the previous LTF bar, its entire volume is added to a running total of Buy Volume.
If an LTF bar's close is less than the close of the previous LTF bar, its volume is added to a running total of Sell Volume.
If the closes are identical, the volume is considered neutral and is ignored.
Final Calculations: Once all the LTF bars have been processed, the final metrics for that single HTF bar are calculated:
Delta: This is the net difference between the accumulated volumes. The formula is:
Delta=TotalBuyVolume−TotalSellVolume
Imbalance %: This shows the percentage dominance of buyers or sellers relative to the total activity. The formula is:
Imbalance%= Delta / (TotalBuyVolume+TotalSellVolume) ×100
This entire process repeats for each bar on your chart, with the results stored and displayed in the historical table.
4. Settings Explained
Lower Timeframe: The most important setting. This is the timeframe the script will analyze to calculate delta. It must be a lower interval than your main chart's timeframe.
History Bar Count: Controls how many previous, closed bars of data are displayed in the table below the "Live" bar.
Table Visuals (Group):
Header Colors: Customize the text color for each column header (Buy, Sell, Delta, Imbalance).
Background Colors: Set the colors used for the conditional backgrounds on the Delta and Imbalance columns (Positive, Negative, and Neutral values).
Data Text Style: Control the color and size of all standard text in the table. Placed on one line for convenience.
Table Position: A dropdown menu to place the table in any of nine positions on your chart.
5. Trading Concepts & Examples
This is where the Delta Table truly shines. By comparing the delta data (the "Effort") with the candle on your chart (the "Result"), you can gain powerful insights.
A. Effort vs. Result Analysis
This concept helps you determine if the trading activity is actually succeeding in moving the price.
Confirmation:
High positive delta on a large green candle that closes strong. This confirms the buying pressure was effective and the trend is likely to continue.
High negative delta on a large red candle that closes weak. This confirms the selling pressure was effective.
Divergence (Sign of Reversal):
Absorption: You see very high positive delta, but the candle on the chart is small, with a long upper wick (a shooting star). This is a major warning sign. It means buyers exerted massive effort, but the result was poor because a large seller absorbed all their buying, preventing the price from rising. This often precedes a move down.
Exhaustion: You see very high negative delta, but the candle is small with a long lower wick (a hammer). This means sellers tried their best to push the price down but failed. Their effort was met with strong buying pressure, signaling selling exhaustion and a potential bottom.
B. Identifying Traps (Two-Bar Analysis)
Traps occur when a breakout or breakdown fails, catching traders on the wrong side of the market. The Delta Table makes these easy to spot.
Example of a Bull Trap:
The Bait (Bar 1): A strong green candle breaks above a key resistance level. You look at the table and see a strong positive delta, convincing traders to go long.
The Trap (Bar 2): The very next candle is a powerful red candle that closes back below the resistance level. Now, check the table for this candle—you will often see an equally strong or even stronger negative delta.
Interpretation: The initial breakout buyers are now "trapped." The aggressive negative delta on the second bar confirms that sellers have taken control, and the trapped longs will be forced to sell, fueling a sharper decline.
Example of a Bear Trap:
The Bait (Bar 1): A strong red candle breaks below a key support level, showing a strong negative delta in the table. Traders are convinced to go short.
The Trap (Bar 2): The next candle is a powerful green candle closing back above support, accompanied by a very strong positive delta.
Interpretation: The breakdown has failed. Aggressive buyers have stepped in, "trapping" the short-sellers who must now buy back their positions, adding fuel to the rally.
6. Important Notes
Repainting: This indicator does not repaint. Once a bar on your main chart closes, its calculated values in the historical table are fixed and will not change. The "Live" data row updates in real-time as the current bar forms, which is the intended and expected behavior.
1-Second Timeframe: The script allows for using second-based intervals (e.g., "1S"). Please be aware that access to second-based timeframes on TradingView requires a Premium subscription. If you do not have one, please use a minute-based interval (e.g., "1").
Historic Bars: The script can accommodate large range, does not have any max bar limit. Please be aware that large table will require heavy computing power.
7. Disclaimer
The information provided by this indicator is for educational and informational purposes only and does not constitute financial advice. All trading and investment decisions are your own and should be made with the help of a qualified financial professional. Trading financial markets involves substantial risk, and past performance is not indicative of future results. The author is not responsible for any losses you may incur as a result of using this script.

Volume gaps Volume gaps (white-highlighted zones) are unfinished business in the market. Mark them between low–high, and expect price to revisit them. They’re excellent targets for mean reversion trades and confluence levels for continuation setups
% of Average Volume% of Average Volume (RVOL)
What it is
This indicator measures cumulative volume during pre market and separately during the first 10 minutes of trading and compares it to the average 30 day volume. This matters as a high ratio of volume within the premarket and then during the first 10 minutes of trading can correlate to a stock that has a higher probability of trending in that direction throughout the day.
What it’s meant to do
Identify abnormally high or low participation early in the day.
Normalize volume by time of session, so 9:40 volume is compared to past 9:40 volume—not to the full-day total.
Provide consistent RVOL across 1–5–15–60 minute charts (the same market state yields similar readings).
Handle pre-market cleanly (optional) without inflating RVOL.
How it works (plain English)
Cumulative Intraday Volume: Adds up all bars from the session (or pre-market, if enabled) up to “now.”
Time-Matched Baseline: For each prior day in your lookback, it accumulates only up to the same intraday minute and averages those values.
RVOL %: RVOL = (Today cumulative / Average cumulative at same time) × 100.
This “like-for-like” approach prevents the classic mistakes that overstate RVOL in pre-market or make it drift with timeframe changes.
Works best on
Intraday charts: 1, 2, 3, 4, 5, 10, 15, 30, 45, 60 min
Regular & extended hours: NYSE/Nasdaq equities, futures, ETFs
Daily/weekly views are supported for reference, but the edge comes from intraday time-matched analysis.
Tip: For thin names or very early pre-market, expect more variability—lower liquidity increases noise.
Customization (Inputs → Settings)
Lookback Sessions (e.g., 20): How many prior trading days to build the average.
Include Pre-Market (on/off): If on, RVOL accumulates from pre-market start and compares to historical pre-market at the same time; if off, it begins at the regular session open only.
Session Timezone / Exchange Hours: Choose the session definition that matches your market (e.g., NYSE) so “time-matched” means the same thing every day.
Cutoff Minute (Optional): Fix a reference minute (e.g., 6:40 a.m. PT / 9:40 a.m. ET) to evaluate RVOL at a standard check-in time.
Smoothing (Optional): Apply a short moving average to the RVOL line to reduce jitter.
Thresholds & Colors: Set levels (e.g., 150%, 300%) to color the plot/labels and trigger alerts.
Show Labels/Debug: Toggle on-chart labels (current RVOL%, baseline vols) for quick audits.
On-chart visuals & alerts
RVOL% Line/Histogram: Color-coded by thresholds (e.g., >300% “exceptional”, >150% “elevated”).
Session Markers: Optional vertical lines for pre-market/regular open.
Alerts:
RVOL Crosses Above X% (e.g., 150%, 300%)
RVOL Crosses Below X%
RVOL Rising/Falling (slope-based, optional)
Good defaults to start
Lookback: 20 sessions
Pre-market: Off for large caps, On for momentum screens
Thresholds: 150% (notable), 300% (exceptional)
Smoothing: 0–3 bars (or off for fastest response)
Notes & best practices
Timeframe consistency: Because calculations are time-matched, RVOL should remain directionally consistent across intraday timeframes. If you see divergences, confirm your session hours & timezone match your instrument’s exchange.
Holiday/half days: These are included in history; you can shorten lookback or exclude such sessions if your workflow prefers.
Low-float names: Consider a slightly longer lookback to reduce outlier effects.
TL;DR
A time-matched RVOL that treats pre-market correctly, stays stable across intraday timeframes, and is fully customizable for your exchange hours, thresholds, and alerts—so you can spot real participation when it matters.

(LES/SES) Compliment Net Volume(LES/SES) Compliment Net Volume
(LES/SES) Compliment Net Volume is a volume-based confirmation tool designed to show whether buyers or sellers are truly in control behind the candles. It acts as a compliment to the Long Elite Squeeze (LES) and Short Elite Squeeze (SES) frameworks, giving traders a clearer view of momentum strength.
Note! {Short Elite Squeeze (SES) Will be released in the Future}
-Designed to take shorts opposite of the long trades from LES
🔹 Core Logic
Net Volume Calculation – Positive volume when price closes higher, negative when price closes lower.
Cumulative Smoothing – Uses a rolling SMA of cumulative differences to remove noise.
Color Coding –
Green → Buyer dominance
Red → Seller dominance
Gray → Neutral pressure
🔹 How to Use
Above zero (green) → Buyers dominate → supports long setups (LES).
Below zero (red) → Sellers dominate → supports short setups (SES).
Flat/gray → No clear pressure → signals caution or chop.
This makes it easier to confirm when market participation aligns with a potential entry or exit.
🔹 Credit
The Compliment Net Volume was developed by Hunter Hammond (Elite x FineFir) as part of the LES/SES system.
The concept builds on classic Net Volume and cumulative volume analysis principles shared by the TradingView community, but has been uniquely adapted into the LES/SES framework.
⚠️ Disclaimer: This is a framework tool, not financial advice. Use with proper risk management.

CVD Strength | VTS Pro🔷 CVD Strength | VTS Pro
By Alireza Mossaheb
Description:
CVD Strength is a powerful tool designed to analyze market momentum by visualizing the Cumulative Volume Delta (CVD) using advanced techniques. This indicator provides a multi-timeframe view of volume delta behavior and highlights strong and weak bullish/bearish conditions based on volume spikes, candle size, and optional moving average filters.
Key Features:
Multi-timeframe CVD candle plotting with color-coded strength signals
Optional EMA (21), WMA (30), and SMA (50) overlays for trend filtering
Smart strength detection logic using volume, candle size, and moving average crossovers
Bullish and bearish crossover signals marked on chart
Customizable anchor and lower timeframes for flexible analysis
Alerts users when data vendor does not supply volume information
This script is particularly useful for identifying institutional buying/selling pressure and can be used effectively in both trend-following and mean-reversion strategies.

Real Cumulative Delta VolumeReal Cumulative Delta Volume (CDV) - Enhanced Volume Flow Analysis
What This Indicator Does
This indicator calculates cumulative delta volume using an enhanced approximation methodology that analyzes buying and selling pressure within each candlestick. It provides traders with insights into volume flow dynamics by tracking the cumulative difference between estimated buy and sell volumes over time.
Technical Methodology & Calculation Details
Volume Distribution Algorithm: The indicator uses a price-weighted distribution method to estimate buy and sell volumes within each bar:
Delta multiplier = (close - low) / (high - low)
Buy volume = total volume × delta multiplier
Sell volume = total volume × (1 - delta multiplier)
Net delta = buy volume - sell volume
Cumulative Delta Tracking: Unlike basic volume indicators, this approach maintains a running cumulative total of net delta values:
CDV Open = Previous CDV Close
CDV Close = Previous CDV Close + Net Delta
CDV High/Low = Previous CDV Close + estimated intrabar extremes
Enhanced Features Beyond Standard CDV:
Divergence Detection: Automatically identifies when price direction conflicts with volume flow direction
Body Size Analysis: Compares current vs previous CDV candle body sizes to detect momentum changes
Conditional Color Coding: Special visual alerts when specific price/volume relationships occur
Signal Generation: Buy/sell signals based on divergence resolution patterns
How This Differs from Basic Cumulative Delta
Standard Limitations Addressed:
Most cumulative delta indicators on TradingView use simple uptick/downtick classification. This indicator enhances the approach by:
Price-Weighted Distribution: Instead of assuming 50/50 volume splits, uses the bar's price action (close relative to high/low) to estimate volume distribution
OHLC Representation: Displays CDV as candlesticks rather than just a line, showing intrabar volume dynamics
Integrated Divergence Detection: Built-in algorithms identify price/volume conflicts automatically
Advanced Signal Logic: Multi-condition signal generation beyond simple crossovers
Visual Enhancement Features:
Dual display modes (candlestick or line)
Special color coding for divergence conditions
Moving average overlays for trend confirmation
Optional buy/sell signal markers
Signal Generation Logic
Buy Signals Generated When:
Previous bar showed bearish divergence (price down, CDV up)
Current CDV candle shows specific color condition
Current CDV body is contained within previous divergence body
Price closes above previous high
Sell Signals Generated When:
Previous bar showed bullish divergence (price up, CDV down)
Current CDV candle shows specific color condition
Current CDV body is contained within previous divergence body
Price closes below previous low
Trading Applications
Volume Flow Analysis:
Identify periods of hidden accumulation or distribution
Spot when large players are buying/selling against the price trend
Confirm trend strength through volume alignment
Divergence Trading:
Early warning system for potential reversals
Identify when price movements lack volume support
Time entries based on divergence resolution
Trend Confirmation:
Use CDV direction to confirm price trend validity
Moving averages on CDV provide additional trend context
Volume momentum changes often precede price momentum shifts
Display Options & Settings
Visual Modes:
Candlestick: Full OHLC representation of cumulative delta
Line: Simplified cumulative line display
Moving Averages:
Optional SMA overlays (default: 50, 200 periods)
Optional EMA overlays (default: 50, 200 periods)
Customizable periods and colors
Signal Controls:
Toggle buy/sell signals on/off independently
Customizable colors for all visual elements
Adjustable transparency and styling options
Usage Guidelines & Limitations
Best Practices:
Most effective on timeframes 15m and higher due to volume data quality
Works best in liquid markets with consistent volume
Should be used alongside price action analysis and support/resistance levels
Signals are more reliable during trending market conditions
Technical Limitations:
Uses approximation methods due to lack of tick-by-tick data in Pine Script
Volume distribution estimates may be less accurate during gaps or low-volume periods
Effectiveness depends on quality of volume data from your broker/exchange
Market Context Considerations:
Less reliable during market holidays or extremely low volume sessions
News events and earnings can cause volume anomalies that affect calculations
Consider market microstructure when interpreting signals on very short timeframes
Important Disclaimers
Educational Purpose: This indicator is designed for educational and analysis purposes. It does not constitute financial or investment advice.
Risk Warning: All trading involves risk of loss. Past performance of any indicator signals does not guarantee future results.
Testing Required: Users should thoroughly backtest and forward test this indicator before using it in live trading. Paper trading is recommended to understand signal behavior.
No Guarantees: The developer makes no claims about profitability or accuracy. Market conditions change and historical effectiveness may not continue.
Proper Usage: This is a technical analysis tool, not a complete trading system. Always use appropriate risk management, position sizing, and combine with other forms of analysis.
Developer: Delta Merge Professional Trading Applications
Access Instructions: Send a private message through TradingView explaining your trading experience and how you plan to use this indicator. Access is provided to traders who demonstrate understanding of volume analysis concepts and proper risk management practices.

Cumulative Intraday Volume with Long/Short LabelsThis indicator calculates a running total of volume for each trading day, then shows on the price chart when that total crosses levels you choose. Every day at 6:00 PM Eastern Time, the total goes back to zero so it always reflects only the current day’s activity. From that moment on, each time a new candle appears the indicator looks at whether the candle closed higher than it opened or lower. If it closed higher, the candle’s volume is added to the running total; if it closed lower, the same volume amount is subtracted. As a result, the total becomes positive when buyers have dominated so far today and negative when sellers have dominated.
Because futures markets close at 6 PM ET, the running total resets exactly then, mirroring the way most intraday traders think in terms of a single session. Throughout the day, you will see this running total move up or down according to whether more volume is happening on green or red candles. Once the total goes above a number you specify (for example, one hundred thousand contracts), the indicator will place a small “Long” label at that candle on the main price chart to let you know buying pressure has reached that level. Similarly, once the total goes below a negative number you choose (for example, minus one hundred thousand), a “Short” label will appear at that candle to signal that selling pressure has reached your chosen threshold. You can set these threshold numbers to whatever makes sense for your trading style or the market you follow.
Because raw volume alone never turns negative, this design uses candle direction as a sign. Green candles (where the close is higher than the open) add volume, and red candles (where the close is lower than the open) subtract volume. Summing those signed volume values tells you in a single number whether buying or selling has been stronger so far today. That number resets every evening, so it does not carry over any buying or selling from previous sessions.
Once you have this indicator on your chart, you simply watch the “summed volume” line as it moves throughout the day. If it climbs past your long threshold, you know buyers are firmly in control and a long entry might make sense. If it falls past your short threshold, you know sellers are firmly in control and a short entry might make sense. In quieter markets or times of low volume, you might use a smaller threshold so that even modest buying or selling pressure will trigger a label. During very active periods, a larger threshold will prevent too many signals when volume spikes frequently.
This approach is straightforward but can be surprisingly powerful. It does not rely on complex formulas or hidden statistical measures. Instead, it simply adds and subtracts daily volume based on candle color, then alerts you when that total reaches levels you care about. Over several years of historical testing, this formula has shown an ability to highlight moments when intraday sentiment shifts decisively from buyers to sellers or vice versa. Because the indicator resets every day at 6 PM, it always reflects only today’s sentiment and remains easy to interpret without carrying over past data. You can use it on any intraday timeframe, but it works especially well on five-minute or fifteen-minute charts for futures contracts.
If you want a clear gauge of whether buyers or sellers are dominating in real time, and you prefer a rule-based method rather than a complex model, this indicator gives you exactly that. It shows net buying or selling pressure at a glance, resets each session like most intraday traders do, and marks the moments when that pressure crosses the levels you decide are important. By combining a daily reset with signed volume, you get a single number that tells you precisely what the crowd is doing at any given moment, without any of the guesswork or hidden calculations that more complicated indicators often carry.

VOLD Ratio Histogram [Th16rry]How to Use the VOLD Ratio Histogram Indicator
The VOLD Ratio Histogram Indicator is a powerful tool for identifying buying and selling volume dominance over a selected period. It provides traders with visual cues about volume pressure in the market, helping them make more informed trading decisions.
How to Read the Indicator:
1. Green Bars (Positive Histogram):
- Indicates that buying volume is stronger than selling volume.
- Higher green bars suggest increasing bullish pressure.
- Useful for confirming uptrends or identifying potential accumulation phases.
2. Red Bars (Negative Histogram):
- Indicates that selling volume is stronger than buying volume.
- Lower red bars suggest increasing bearish pressure.
- Useful for confirming downtrends or identifying potential distribution phases.
3. Zero Line (Gray Line):
- Acts as a neutral reference point where buying and selling volumes are balanced.
- Crossing above zero suggests buying dominance; crossing below zero suggests selling dominance.
How to Use It:
1. Confirming Trends:
- A strong positive histogram during an uptrend supports bullish momentum.
- A strong negative histogram during a downtrend supports bearish momentum.
2. Detecting Reversals:
- Monitor for changes from positive (green) to negative (red) or vice versa as potential reversal signals.
- Divergences between price action and histogram direction can indicate weakening trends.
3. Identifying Volume Surges:
- Sharp spikes in the histogram may indicate strong buying or selling interest.
- Use these spikes to investigate potential breakout or breakdown scenarios.
4. Filtering Noise:
- Adjust the period length to control sensitivity:
- Shorter periods (e.g., 10) are more responsive but may produce more noise.
- Longer periods (e.g., 50) provide smoother signals, better for identifying broader trends.
Recommended Markets:
- Cryptocurrencies: Works effectively with real volume data from exchanges.
- Forex: Useful with tick volume, though interpretation may vary.
- Stocks & Commodities: Particularly effective for analyzing high-volume assets.
Best Practices:
- Combine the VOLD Ratio Histogram with other indicators like moving averages or RSI for confirmation.
- Use different period lengths depending on your trading style (scalping, swing trading, long-term investing).
- Observe volume spikes and divergences to anticipate potential market moves.
The VOLD Ratio Histogram Indicator is ideal for traders looking to enhance their volume analysis and gain a deeper understanding of market dynamics.

PVSRA Volume Suite with Volume DeltaPVSRA Volume Suite with Volume Delta
🔹 Overview
This indicator is a Volume Suite that enhances PVSRA (Price, Volume, Support, Resistance Analysis) by incorporating Volume Delta and AI-driven predictive alerts. It is designed to help traders analyze volume pressure, market trends, and price movements with color-coded visualizations.
📌 Key Features
PVSRA Volume Color Coding – Highlights vector candles based on extreme volume/spread conditions.
Volume Delta Analysis – Tracks buying/selling pressure using up/down volume data.
AI-Powered Predictive Alerts – Identifies potential trend shifts based on volume and trend context.
Volatility-Adjusted Thresholds – Dynamically adapts volume conditions based on ATR (Average True Range).
Customizable MA & Symbol Overrides – Allows traders to tweak settings for personalized market insights.
Debug & Diagnostic Labels – Shows statistical z-scores, thresholds, and volume dynamics.
How It Works
PVSRA Color Coding – The script classifies candles into four categories based on volume and spread analysis:
🔴 Red Vector → Extreme bearish volume/spread
🟢 Green Vector → Extreme bullish volume/spread
🟣 Violet Vector → Above-average bearish volume
🔵 Blue Vector → Above-average bullish volume
Volume Delta Calculation – Uses lower timeframe volume analysis to estimate up/down volume differentials.
Trend & Predictive Alerts – Combines EMA crossovers with statistical volume analysis to detect potential trend shifts.
Volatility Adaptation – Adjusts volume thresholds based on ATR, making signals more reliable in changing market conditions.
Custom Symbol Override – Fetches PVSRA data from a different instrument, useful for index-based volume analysis.
Customizable Inputs
PVSRA Color Settings – Modify candle color schemes for better visual clarity.
Volume Delta Colors – Customize delta volume body, wick, and border colors.
AI Settings – Tune z-score thresholds, lookback periods, and enable predictive alerts.
Symbol Overrides – Analyze volume from a different market or asset.
Moving Average (MA) Settings – Display a volume-based moving average for trend confirmation.
Important Notes
Works best on intraday timeframes where volume data is reliable.
Lower timeframe volume delta estimates might not be precise for all assets.
No guarantees of accuracy – Use alongside other confluence tools for decision-making.
Credits & Open-Source Notice
This script is based on PVSRA methodologies and integrates Volume Delta analysis. Special thanks to Traders Reality and TradingView for their contributions to volume-based analysis.

CVD Oscillator - Short Term SwiftEdgeOverview
The CVD Oscillator - Short Term is a technical indicator designed to assist traders in identifying short-term buying and selling pressure in the market. It calculates the Cumulative Volume Delta (CVD) to measure the net volume difference between buying and selling activity, displayed as an oscillator in a separate panel. This indicator is tailored for short-term trading strategies, such as scalping or day trading, on low timeframes (e.g., 1-minute, 5-minute, or 15-minute charts).
How It Works
Cumulative Volume Delta (CVD): The indicator calculates CVD by assigning volume to buyers (when close > open) or sellers (when close < open). If close = open, the volume is neutral.
Short-Term Focus: The CVD is calculated over a user-defined lookback period (default: 10 candles), making it sensitive to recent market activity.
Normalization: The raw CVD is normalized by dividing it by the average volume (over a short period, default: 5 candles) and scaled to fit within a range of -100 to +100, creating an oscillator-like behavior.
Reset Options: Users can reset the CVD at specific intervals (e.g., every minute, 5 minutes, 15 minutes, or daily) to focus on intraday movements.
Live CVD Value: The raw (unnormalized) CVD value is displayed as a label on each candle for real-time monitoring.
Key Features
Customizable Lookback Period: Adjust the number of recent candles (default: 10) to calculate CVD, allowing for precise short-term analysis.
Flexible Reset Periods: Choose to reset the CVD every 1 minute, 5 minutes, 15 minutes, daily, or never, to suit your trading style.
Normalized Oscillator: The CVD is scaled between -100 and +100, making it easier to visualize short-term momentum.
Live CVD Labels: Displays the raw CVD value on each candle, with options to position the label above or below the oscillator line.
How to Use
Add to Chart: Apply the indicator to your chart on a low timeframe (e.g., 1m, 5m, or 15m) for short-term trading.
Interpret the Oscillator:
Above 0 (Green): Indicates buying pressure dominates.
Below 0 (Red): Indicates selling pressure dominates.
Near 0: Suggests neutral market conditions.
Monitor Live CVD: Use the raw CVD value (shown in the label) to assess the exact net volume difference over the lookback period.
Combine with Other Tools: Use the oscillator alongside price action, support/resistance levels, or other indicators to confirm trading decisions.
Adjust Settings:
CVD Lookback Period: Set to a small value (e.g., 5-20 candles) for scalping.
CVD Reset Period: Choose "1m" or "5m" for intraday resets to focus on very short-term trends.
Volume Average Length: Use a short length (e.g., 3-5) for faster responsiveness.
Scale Factor: Increase (e.g., 2.0-3.0) to amplify small changes in CVD.
Settings
CVD Reset Period: Defines when to reset the CVD calculation ("None", "D" for daily, "15m", "5m", "1m").
CVD Lookback Period (Candles): Number of recent candles to calculate CVD (default: 10).
Volume Average Length: Period for averaging volume to normalize CVD (default: 5).
CVD Scale Factor: Adjusts the sensitivity of the normalized CVD (default: 2.0).
CVD Label Position: Choose to display the raw CVD label above or below the oscillator line.
CVD Label Color: Customize the color of the CVD label (default: white).
Limitations
Not a Standalone Tool: This indicator should be used in conjunction with other technical analysis tools, as it does not guarantee profitable trades.
Volume Dependency: The accuracy of CVD relies on the quality of volume data provided by your broker or exchange.
Short-Term Focus: The indicator is optimized for low timeframes and may produce noise on higher timeframes unless adjusted.
No Predictive Claims: The CVD Oscillator reflects past and current market activity but does not predict future price movements.
Notes
This indicator is designed for informational purposes and does not constitute financial advice. Trading involves risk, and past performance is not indicative of future results.
Test the indicator on a demo account to understand its behavior before using it in live trading.
Feedback is welcome! If you have suggestions for improvements, feel free to share them in the comments.

Footprint Chart by Th16rryDescription of the "Footprint Chart" Indicator
This indicator is an approximation of a true **Footprint Chart** adapted for TradingView, which does not provide access to tick-by-tick data or detailed order book information. It relies on **heuristics** to estimate the distribution of volume between buyers and sellers for each candlestick.
Key Features:
- Estimation of Buy/Sell Volume:
The indicator splits the total volume of a candlestick into two parts based on the candle's nature:
- For a bullish candle (close > open), it assumes that **60% of the volume** is executed on the ask (buys) and **40% on the bid** (sells).
- For a bearish candle (close < open), the estimation is reversed (40% buys, 60% sells).
- For a neutral candle (close = open), the volume is evenly distributed at 50% for each side.
- Calculation of a Simplified Delta:
The delta is defined as the difference between the estimated buy volume and sell volume. This delta helps quickly identify the dominant market pressure—positive for buyer dominance and negative for seller dominance.
- Visual Display:
- A label is placed on each candlestick displaying the delta value, with a green background for a positive delta (indicating buying pressure) and red for a negative delta (indicating selling pressure).
- A table in the top-right corner of the chart summarizes the estimated volumes for the current candle: buy volume, sell volume, and total volume.
#### How to Use the Indicator:
- Analyzing Buy/Sell Pressure:
By observing the label's color and the delta value, a trader can quickly assess whether the market shows a dominant buying or selling pressure during a given candle.
- Complementing Other Tools:
This indicator can be used alongside other technical analysis tools, such as the Volume Profile or trend indicators, to gain a more comprehensive understanding of market behavior.
- Supporting Decision Making:
By providing a visual estimate of the volume distribution, it can help identify divergences between price movement and volume activity, which may signal potential reversals or confirm ongoing trends.
Limitations:
- Heuristic Approximation:
The method of volume distribution is based on simple assumptions and does not reflect the actual order flow, which would require tick-by-tick data to be accurately represented.
- Data Limitations on TradingView:
Due to TradingView’s restrictions on accessing detailed order book data, this indicator can only approximate a Footprint Chart and does not replace specialized tools.
In summary, the "Footprint Chart" indicator provides a visual and quick estimation of the volume distribution between buyers and sellers for each candlestick, offering valuable insights into order flow dynamics while remaining aware of its heuristic limitations.

Volume Alert with Adaptive Trend - MissouriTimElevate your market analysis with our "Volume Alert with Adaptive Trend" indicator. This powerful tool combines real-time volume spike notifications with a sophisticated adaptive trend channel, providing traders with both immediate and long-term market insights. Customize your trading experience with adjustable volume alert thresholds and trend visualization options.
Features Summary
Volume Alert Features:
Volume Spike Detection:
Alerts you when volume exceeds a user-defined multiplier of the 20-period Simple Moving Average (SMA) of volume, helping identify potential market interest or significant price movements.
Visual Notification:
A "Volume Alert" label appears on the chart in a striking purple color (#7300E6) with white text, making high volume bars easily noticeable.
Customizable Sensitivity:
The volume spike threshold is adjustable, allowing you to set how sensitive the alert should be to volume changes, tailored to your trading strategy.
Alerts:
An alert condition is set to notify you when a volume spike occurs, ensuring you don't miss potential trading opportunities.
Adaptive Trend Features
Adaptive Channel:
Visualizes market trends through a dynamic channel that adjusts to price movements, offering insights into trend direction, strength, and potential reversal points.
Lookback Period:
Choose between short-term or long-term trend analysis with a toggle that adjusts the calculation period for the trend channel.
Channel Customization:
Fine-tune the trend channel with options for deviation multiplier, line styles, colors, transparency, and extension preferences to match your visual trading preferences.
Non-Repainting:
The trend lines are updated only on the current bar, ensuring the integrity of historical data for backtesting and strategy development.
Integrated Utility
Combination of Tools: This indicator marries the immediacy of volume alerts with the strategic depth of trend analysis, offering a comprehensive view of market dynamics.
User Customization: With inputs for both volume alerts and trend visualization, the indicator can be tailored to suit various trading styles, from scalping to swing trading.
This indicator ensures you're always in tune with market movements, providing crucial information at a glance to inform your trading decisions.
Daily Buy/Sell Volumeindicator that The Daily Buy/Sell Volume Indicator is a custom-built tool that helps traders track and visualize the buying and selling volumes throughout a trading day. This indicator separates the total volume into two categories:
1. Buy Volume: Calculated when the closing price is higher than the opening price for a given candle. This represents the volume of bullish (buy) activity for the day.
2. Sell Volume: Calculated when the closing price is lower than the opening price for a given candle. This represents the volume of bearish (sell) activity for the day.
Key Features:
• Buy/Sell Volume Calculation: The indicator tracks the buying and selling volumes based on the relationship between the open and close prices of each candle.
• Daily Reset: The indicator resets at the start of each trading day, providing fresh calculations for the daily buy and sell volumes.
• Visual Representation: The buy volume is shown with a green line, while the sell volume is displayed with a red line, making it easy to identify bullish and bearish activity over the course of the day.
