Daily Levels [cryptalent]Daily High / Low / Mid / Open Levels is a session-based reference indicator designed to visualize key daily price levels directly on the chart.
This indicator automatically plots the Daily High, Daily Low, Daily Midpoint (High + Low / 2), and Daily Open as horizontal lines for each trading day. These levels help traders quickly identify important structural prices where liquidity, reactions, or acceptance often occur.
Key Features
Automatic Daily Levels
Plots Daily High (H), Low (L), Mid (M), and Open (O) using higher-timeframe daily data.
Levels update in real time as the current day develops.
Multi-Day History
Displays daily levels for a configurable number of past days.
Older levels are automatically removed to keep the chart clean.
Line Extension
Current day levels can be extended forward by a user-defined number of bars.
Useful for projecting intraday reaction zones and liquidity targets.
Visual Customization
Independent line width and color settings for each level.
Mid level is shown as a dashed line for quick visual distinction.
Labels & Price Tags
Optional letter labels (H / L / M / O) displayed near the extended levels.
Optional price labels showing the exact level values on the right side of the chart.
Labels update dynamically and only display for the active trading day.
Performance-Oriented Design
Efficient line and label management using arrays.
Automatically cleans up unused objects to stay within TradingView limits.
Use Cases
Identifying intraday support and resistance
Tracking daily range behavior
Monitoring mean reversion vs. range expansion
Aligning intraday execution with higher-timeframe structure
This indicator is particularly useful for traders who rely on market structure, session behavior, and objective price references rather than subjective trend lines.
Dailyopen

HybridWhales DAY TRADINGThis indicator offers a streamlined view of prevailing market trends on lower timeframes, empowering day traders to execute their strategies with greater precision
It incorporates two widely used exponential moving averages (EMAs)—the 50-period and 200-period—alongside an 800-period EMA, which effectively mirrors the 200-period EMA on the next higher timeframe. This setup provides enhanced flexibility, delivering multi-timeframe insights without the need to switch charts manually.
In addition, the indicator highlights essential intraday levels for quick reference:
Daily Open, denoted in yellow
Monday Highs, marked in red
Monday Lows, indicated in green
The indicator's core strength lies in its ability to detect market maker activity through color-coded candlesticks, based on volume analysis. Candles exhibiting significantly higher volume than the average of the prior eight candles are colored green (for bullish closes) or red (for bearish closes), signaling active market maker positioning—either entering shorts or longs.
Candles with moderately elevated volume (above average but not extreme) are shaded blue (bullish) or pink (bearish), suggesting market makers are accumulating short or long positions.
Interpretation is key: Red or pink candles (bearish) imply that market makers have initiated long positions, with price likely to revisit and fill these areas in the future. Conversely, green or blue candles (bullish) indicate market makers establishing shorts, anticipating a eventual pullback to these levels
To pinpoint the precise zones where price may return, the indicator places a white marker on each colored candle at its 50% retracement level, representing a fair value gap or imbalance.
Overall, this tool enables traders to spot market maker footprints, identify critical support and resistance zones, gauge weekly ranges, and assess potential momentum. While it fosters stronger confluence in analysis, results are not guaranteed and depend on individual trading execution.

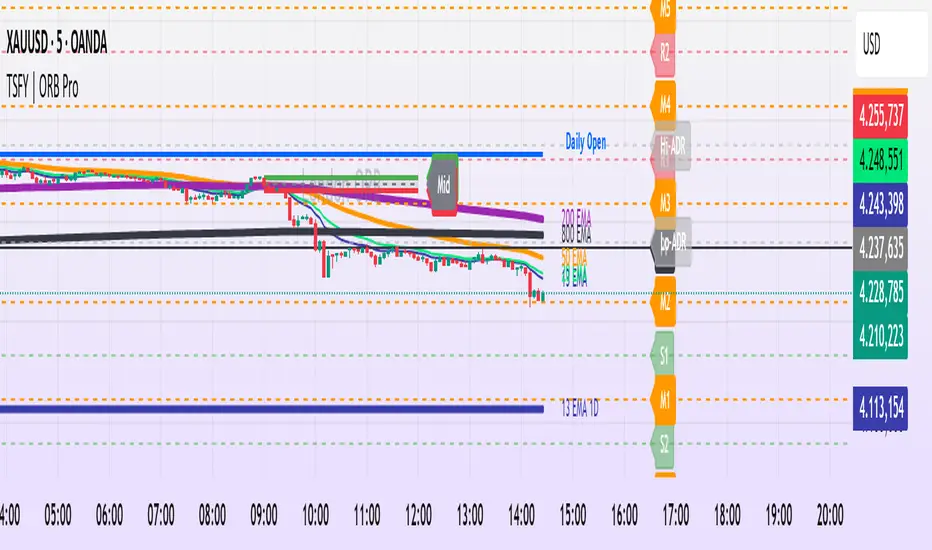
Tradisfy | TSFY | ORB Pro**TSFY | ORB Pro**
Introduction
TSFY | ORB Pro combines the classic Opening Range Breakout (ORB) logic with professional market structure tools such as EMAs, the Daily Open, ADR, and Pivot Points.
The goal: A clean and logically structured intraday visualization of volatility, trend, and key price zones — without visual clutter.
Timezone: Europe/Berlin
---
Core Features
Multi-Session ORB: Separate Opening Ranges for London, Gold, and New York sessions with ORH, ORL, and Mid levels, optionally extendable to the end of the trading day.
EMAs (Intraday & Daily): Adaptive trend filters from 4 to 800 periods plus Daily 13/50/200 EMAs for higher-timeframe structure context.
Classic Pivots: Automatic calculation of daily PP, R, S, and Mid levels with fully customizable colors, styles, and extensions.
Daily Open: Marks the daily opening price as a bias reference point.
ADR (Average Daily Range): Calculates the average true range of the last X days, optionally anchored to the Daily Open with an optional 50% midpoint.
---
Interpretation
Break above ORH → bullish momentum; break below ORL → bearish weakness.
Combine ORB zones with EMAs, Pivots, or ADR for higher confluence.
Daily Open provides intraday bias, ADR defines realistic target zones.
Reactions around R/S levels or OR Mid often indicate short-term turning points.
---
Usage
Use the ORB zone as the basis for breakout, retest, or mean-reversion setups.
Plan realistic take-profit zones using ADR and Pivot levels.
Daily EMAs define the overall market bias.
All components can be toggled on or off individually.
---
Notes
Optimized for intraday ORB trading.
No alerts integrated (yet).
All colors, line widths, and transparency levels are fully customizable.
Non-repainting — lines are extended forward, not redrawn.
Performance-friendly despite multiple visual components (max. 500 lines/labels).
---
TSFY | ORB Pro is a complete framework for modern intraday traders who want to combine session logic, trend filters, and market structure into one clean and efficient tool.
Key LevelsKey Levels Indicator
Description
The Key Levels indicator is a powerful tool for traders, displaying major institutional price levels from daily, weekly, and monthly timeframes on your chart. It plots horizontal lines for previous period highs, lows, and midpoints (50% levels), as well as current period opens, helping you identify critical support and resistance zones used by institutional traders. Labels are provided for the most recent levels, positioned at the rightmost bar for easy reference.
Features
Daily Levels: Plots Previous Day High, Previous Day Low, Day Open, and Previous Day 50% Level.
Weekly Levels: Plots Previous Week High, Previous Week Low, Week Open, and Previous Week 50% Level.
Monthly Levels: Plots Previous Month High, Previous Month Low, Month Open, and Previous Month 50% Level.
Customizable Colors: Adjust the color of each line via the settings panel to suit your chart preferences.
Customizable Labels: Enable/disable labels, adjust label size, and change the label background color for optimal visibility.
Clean Visualization: Lines are plotted with breaks at the start of each period, ensuring a clear and uncluttered display.
Settings
Show Labels: Toggle to show or hide all labels (default: enabled).
Label Size: Choose from "tiny," "small," "normal," "large," or "huge" to adjust label text size (default: normal).
Label Background Color: Customize the background color of labels to ensure text visibility (default: black).
Line Colors: Individual color pickers for each level (e.g., Previous Day High, Day Open), allowing full customization of line colors.
Usage
The Key Levels indicator is designed for futures markets, such as S&P 500 futures (ES), Nasdaq futures (NQ), or crude oil futures (CL), where institutional price levels like daily, weekly, and monthly highs, lows, and opens are key for getting into positions. For day trading, use these levels to identify short-term support and resistance for intraday entries and exits. For long-term trading, they provide context for swing positions or trend continuation, helping you align with institutional flow. Apply the indicator to a 1-hour or 15-minute timeframe to capture precise market structure. While optimized for futures, the indicator's key levels apply to every single thing that can be traded, including forex, stocks, and cryptocurrencies, making it versatile for all asset classes.
Notes
Labels are shown only for the current day, week, and month to focus on recent price action.
For best visibility, adjust the label background color if text blends into your chart background.
Ideal for traders analyzing major institutional levels for market structure and trading decisions.

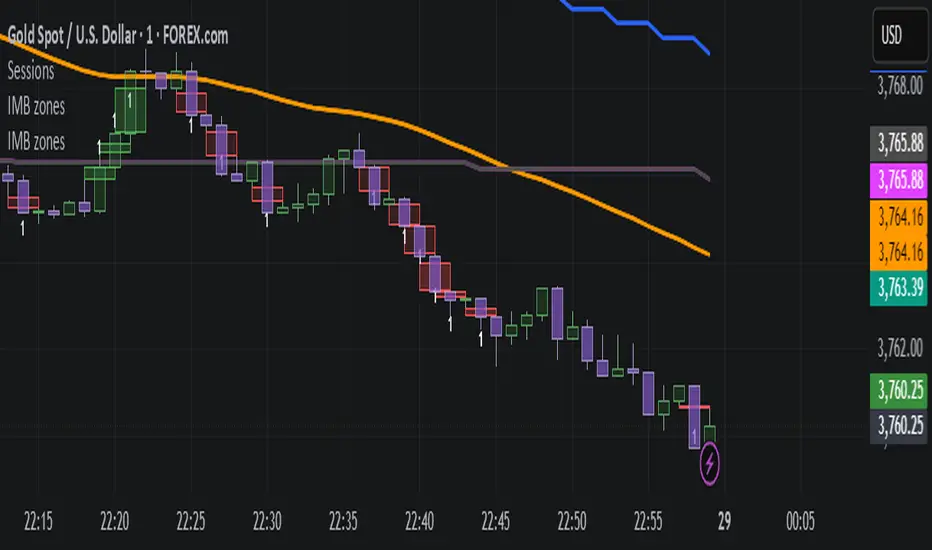
IMB zones, alerts, 8 EMAs, DO lvlThis indicator was created to be a combined indicator for those who use DO levels, IMBs, and EMAs in their daily trading, helping them by providing a script that allows them to customize these indicators to their liking.
Here you can set the IMBs, DO levels, and EMAs. Its special feature is that it uses alerts to indicate which IMB zones have been created, along with the invalidation line for the new potential IMB.
The program always calculates the Daily Opening (DO) level from the opening of the broker, and you can set how many hours the line should be drawn.
Help for use:
There are 3 types of alerts:
- Use the "Bullish IMB formed" alert if you are looking for Bull IMBs.
- Use the "Bearish IMB formed" alert if you are looking for Bear IMBs.
- Use the "Either IMB" alert if you are looking for Bull and Bear IMBs.
Tip: Set the alert type "Once per bar close" if you do not want to set new alerts after an IMB is formed.
IMBs:
- Customizable IMB quantity (1-500 pcs)
- Zone colors and borders can be customized
- Potential IMB line can be customized
EMAs:
- You can set and customize 8 EMA lengths
- Only the current and higher timeframe EMAs are displayed
Daily Open Level:
- Displays today's Daily Open level
- Note: The DO level does not work in Replay mode
Last OFR:
"Show True OFR" checkbox added.
It displays the latest OFR, and hides the old ones.
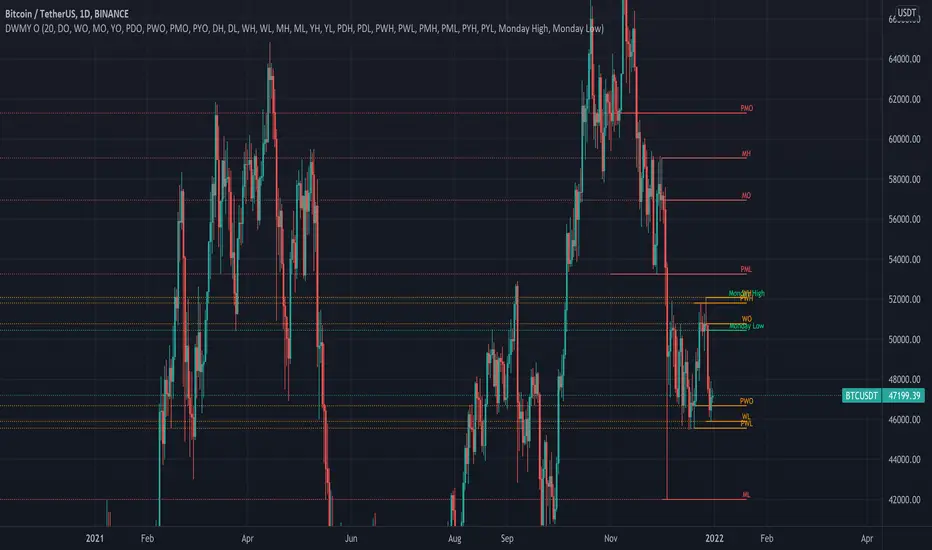
Key Levels: Daily, Weekly, Monthly [BackQuant]Key Levels: Daily, Weekly, Monthly
Map the market’s “memory” in one glance—yesterday’s range, this week’s chosen day high/low, and D/W/M opens—then auto-clean levels once they break.
What it does
This tool plots three families of high-signal reference lines and keeps them tidy as price evolves:
Chosen Day High/Low (per week) — Pick a weekday (e.g., Monday). For each past week, the script records that day’s session high and low and projects them forward for a configurable number of bars. These act like “memory levels” that price often revisits.
Daily / Weekly / Monthly Opens — Plots the opening price of each new day, week, and month with separate styling. These opens frequently behave like magnets/flip lines intraday and anchors for regime on higher timeframes.
Auto-pruning — When price breaks a stored level, the script can automatically remove it to reduce clutter and refocus you on still-active lines. See: (broken levels removed).
Why these levels matter
Liquidity pockets — Prior day’s high/low and the daily open concentrate stops and pending orders. Mapping them quickly reveals likely sweep or fade zones. Example: previous day highs + daily open highlighting liquidity:
Context & regime — Monthly opens frame macro bias; trading above a rising cluster of monthly opens vs. below gives a clean top-down read. Example: monthly-only “macro outlook” view:
Cleaner charts — Auto-remove broken lines so you focus on what still matters right now.
What it plots (at a glance)
Past Chosen Day High/Low for up to N prior weeks (your choice), extended right.
Current Daily Open , Weekly Open , and Monthly Open , each with its own color, label, and forward extension.
Optional short labels (e.g., “Mon High”) or full labels (with week/month info).
How breaks are detected & cleaned
You control both the evidence and the timing of a “break”:
Break uses — Choose Close (more conservative) or Wick (more sensitive).
Inclusive? — If enabled, equality counts (≥ high or ≤ low). If disabled, you need a strict cross.
Allow intraday breaks? — If on, a level can break during the tracked day; if off, the script only counts breaks after the session completes.
Remove Broken Levels — When a break is confirmed, the line/label is deleted automatically. (See the demo: )
Quick start
Pick a Day of Week to Track (e.g., Monday).
Set how many weeks back to show (e.g., 8–10).
Choose how far to extend each family (bars to the right for chosen-day H/L and D/W/M opens).
Decide if a break uses Close or Wick , and whether equality counts.
Toggle Remove Broken Levels to keep the chart clean automatically.
Tips by use-case
Intraday bias — Watch the Daily Open as a magnet/flip. If price gaps above and holds, pullbacks to the daily open often decide direction. Pair with last day’s high/low for sweep→reversal or true breakout cues. See:
Weekly structure — Track the week’s chosen day (e.g., Monday) high/low across prior weeks. If price stalls near a cluster of old “Monday Highs,” look for sweep/reject patterns or continuation on reclaim.
Macro regime — Hide daily/weekly lines and keep only Monthly Opens to read bigger cycles at a glance (BTC/crypto especially). Example:
Customization
Use wicks or bodies for highs/lows (wicks capture extremes; bodies are stricter).
Line style & thickness — solid/dashed/dotted, width 1–5, plus global transparency.
Labels — Abbreviated (“Mon High”, “D Open”) or full (month/week/day info).
Color scheme — Separate colors for highs, lows, and each of D/W/M opens.
Capacity controls — Set how many daily/weekly/monthly opens and how many weeks of chosen-day H/L to keep visible.
What’s under the hood
On your selected weekday, the script records that session’s true high and true low (using wicks or body-based extremes—your choice), then projects a horizontal line forward for the next bars.
At each new day/week/month , it records the opening price and projects that line forward as well.
Each bar, the script checks your “break” rules; once broken, lines/labels are removed if auto-cleaning is on.
Everything updates in real time; past levels don’t repaint after the session finishes.
Recommended presets
Day trading — Weeks back: 6–10; extend D/W opens: 50–100 bars; Break uses: Close ; Inclusive: off; Auto-remove: on.
Swing — Fewer daily opens, more weekly opens (2–6), and 8–12 weeks of chosen-day H/L.
Macro — Show only Monthly Opens (1–6 months), dashed style, thicker lines for clarity.
Reading the examples
Broken lines disappear — decluttering in action:
Macro outlook — monthly opens as cycle rails:
Liquidity map — previous day highs + daily open:
Final note
These are not “signals”—they’re reference points that many participants watch. By standardising how you draw them and automatically clearing the ones that no longer matter, you turn a noisy chart into a focused map: where liquidity likely sits, where price memory lives, and which lines are still in play.

Daily Session DividerThis script draws vertical lines showing the new daily sessions. These will only be displayed when it's on an intraday timeframe (lower than daily timeframe).
Settings:
Line Color: Choose the color you want and change the opacity
Line Width: If you want a thicc line. Defaults to 1 (recommended setting)
Line Style: Choose between solid (default), dashed, or dotted

Daily Open [Kintsugi Trading]Daily Open
The "Daily Open" indicator by Kintsugi Trading is designed to give traders clear and immediate access to daily open prices, enhancing their ability to spot key market levels and make informed trading decisions. The indicator dynamically changes the color of the plotted line based on the current price's relationship to the opening price of the regular market session. This visual aid helps traders quickly assess whether the current price is trading above or below the opening price of the session.
Key Features:
Daily Open Visualization: Automatically plots the daily open price on your chart, providing a clear reference point for daily price action.
Configurable Market Open Time: The indicator allows users to input the start time of the regular market session (default is set to 9:30 AM).
Color-Coded: The indicator dynamically adjusts the color of the daily open line and price labels based on whether the price is above or below the open, giving you quick visual cues about market sentiment.
Customization Options: Users can modify the line's appearance, including the color and style, to better fit their chart preferences.
Ideal For:
This indicator is particularly useful for day traders and those looking to closely monitor price action in relation to the market's opening level. It serves as a quick reference point for identifying potential bullish or bearish sentiment throughout the trading day.
Good luck with your trading!

B A N K $ - Opening Lines / Daily Separators This is a simple indicator that aids the trader in being able to visualise each trading day of the week;
Key Features
Weekly Open Line
Daily Open Line
Option for Background Lines
Weekly & Daily Open Lines
Information ℹ️
These are vertical lines that are anchored to the hour of the Weekly Open and the hour of each Daily Candle Open. The settings are customisable, allowing to you edit the Width, Style & Colour. You can also select Monday as the Weekly Open if Monday is a no-trade day for you.
Settings ⚙️
1h Toggle - by default Daily Open Lines are only visible under the 1h, you can select to also make them visible on the 1h.
Background Lines - you can replace the chart lines with background lines, this can improve performance and allow you to load more lines on the chart when going back in price.
Show Days of Week - this prints the current day on the chart.

MUJBOT - ADVANCED DAILY OPENTitle: MUJBOT - ADVANCED DAILY OPEN
Description:
The "MUJBOT - ADVANCED DAILY OPEN" is a versatile and user-friendly TradingView indicator designed to enhance daily trading strategies by highlighting the daily open price on the chart. This indicator is particularly useful for traders who focus on intraday price movements around the opening price of the trading day.
Key Features:
Daily Open Line: Visually represents the opening price of each trading day on the chart, providing a clear reference point for the day's initial market sentiment.
Dynamic Testing Counter: Keeps track of how many times the price tests or crosses the daily open level within the day. This feature offers insight into the significance and market reaction to the daily open price.
Customizable Display: Includes an option to show or hide the daily open line and the testing counter label. Traders can easily toggle the display according to their preference, keeping their charts uncluttered.
Real-Time Updates: The label and line are dynamically updated in real-time with each new price bar, ensuring traders have the most current information at their fingertips.
Simplicity and Efficiency: With a straightforward design, the indicator adds minimal complexity to the chart while providing valuable trading information.
Usage:
Intraday Trading: Ideal for intraday traders, the indicator helps in identifying how the current price is behaving relative to the opening price, which can be a crucial factor in decision-making.
Support and Resistance: The daily open can act as a natural support or resistance level. Monitoring how the price interacts with this level can provide insights into potential breakout or reversal opportunities.
Trend Analysis: Observing the frequency of the daily open price being tested can give clues about the day's trend strength and potential continuation or reversal.
Customization Options:
Toggle the visibility of the daily open line and label.
The line extends six bars ahead from the daily open for clear visibility.
The label displays the daily open price and the count of how many times it has been tested.
Conclusion:
The "MUJBOT - ADVANCED DAILY OPEN" indicator is a valuable tool for traders who emphasize the importance of the daily open in their trading strategy. Its simplicity, combined with real-time tracking features, makes it an essential addition to the trader's toolkit on TradingView.
Feel free to modify or add any additional details specific to your trading strategy or indicator functionality.

Apeiron Jail RangeThe Apeiron Jail Range is an experimental use of proprietary standard deviation calculations.
It calculates price standard deviations based of previous data & a MA, which it applies and anchors to an automatically (can also be done manually) selected TF open. Finally, the standard deviation bands are plotted and create a "Jail" range with up to 12 levels (6 above and 6 below) that can potentially work as support and resistance during the TF period anchor time.
The indicator is meant to help traders identify potential support and resistance levels which can then be used in confluence with other indicators and strategies. It can also be potentially used for testing automation strategies such as grid trading.
The anchor time and the lenght of the MA used for the calculation can be manually or automatically selected.
The example shown uses the same indicator twice to show all levels from 0.5 - 1 - 1.5 ... 5.5 - 6

YDH/YDL to Current Day H/L - Zones- Draw boxes on the intersections between yesterday's high/low and the day's after high/low
This will help you to visualize areas at extreme points where algo hasn't yet pushed price to recover them

Current price & Daily openFor those who likes clean chart:
I made a simple script that shows Current price based on the last candle color.
Also can show Daily open line based on the daily candle color.
Daily open line is same as strong support and resistance levels.
Mostly price shows strong responces on daily open line.
1: Daily open line color is blue if current price is above the daily open line.
And daily open line is red if current price is below the daily open line.
This means blue daily open line represents bullish daily candle and red daily open line represents bearish daily candle.
Simply you can expect Buy setup on the daily open line if it is blue and vice versa. That means you are following the daily trend, nothing else.
Always double confirm with your own trading style. It's not guaranteed.
You can use this script when you want to see daily price action or to find daily high lows.
This script helps to identify the following day high and lows too on the lower timeframe.
2: When you add drawing tools on your chart price labels are overlapping or if you choose not overlap then price moves up or down so you are not able to see current price easily.
This script helps to show current price on the last candle. You can easily see the current price.
Current price color is blue when last candle is bullish and it's red when last candle is bearish .
It always calculates last candle. So it could be weekly or 1 minute candle, whatever timeframe you working on.
Thank you.

Order Block and Daily Levels VTRENDThe Order Block and Daily Levels is my first script designed to add context with order blocks to how i trade.
I have included a volume weighted band in green, as it's use is core to my trading style. I have often found however, there needs to be more clarify in structure which some of my previous scripts did not provide, so i have coded up some custom order blocks, which can be altered along the lines of how sensitive they are.
There is also a high time frame volume average line to combine the green volume weighted band to identify a bullish or bearish trend.
The other key change I am experimenting with, is trading off the daily levels, this is reflected here with a change is barcolor, above or below the daily level and a 'cross' symbol.
Included are 'chance of reversal' diamonds.
You can see here with the trend, volume and structure information given, there is a clearer idea of where price might head to next. Combine this with yur own levels too.
This can be useful on low time frames too.
So far I have experimented with this script on the 4/2/1 hour and 25 / 5 minutes

Short Volume Weighted Trend Band VTrendThe Short Volume Weighted Trend band, combined with the custom supertrend and barcolor, which changes according to price going above or below the bollinger band basis line. Is designed for you to identify the high time frame trend, and take short to long term entries.
The short volume band in green, acts as dynamic support and resistance, and price respects this quite well. I find it great for taking entries off and placing stops below or above depending on the position being taken.
It really helps identify when price is actually changing trend. The barcolor change assists in acting as confluence for this.
Included is a custom supertrend, which is better at 1h timeframe an above. And daily open levels only, as i find the daily key to take trades off when i am scalping on an intraday basis.
The reversal calculations are based off candle close types, these are 'R' either in black or red. The difference in black and red is a type only, and means no significance between the two.
Timeframes I like using on this script, 2H, 1H, 30min, 25min, 15min

WMA combined with Barcolor VTRENDThis script centers around a weighted moving average band, to show price action when its in a bull or bear trend.
Included for trend purposes are two volume weighted moving averages, a 99 and 500 length respectively.
Above the weighted moving average band, barcolor is green and below it is red.
We also have key open levels, the daily, weekly, monthly and yearly. The candle colors are different when it closes above or below the daily open, purple for above and maroon for below. I have also have taken the liberty of putting crosses on chart for when this happens too, as to help identify the direction of price action more easily.
I recommend using the 1hr timeframe for most trades, the open and close crosses can be noisy at low timeframes, 15 - 30 minutes is good enough for low timeframe scalping.

Trend and Key Levels combined with Barcolor VTRENDThe Trend and Key Levels combined with Barcolor is designed to be used more on higher timeframes, 1 hour and above to show long term trend by volume weighted moving average. And allowing you to play entries off key levels. This script will not be useful on the daily or weekly timeframes if you are using the key levels.
This script changes barcolor eitherside of the volume weighted moving average to show bull or bear trend. You can see the price action at this timeframe of 1 hour, respects the volume weighted moving average as support and resistance.
The key levels to play off are the daily levels in orange, a close above results in a candle color of purple, a close below the daily open results in a candle color of maroon.
Included as levels, are the weekly, monthly and yearly.
Included are alerts for the candle color change for the daily alerts and change of trend green to red.
I hope you find this script useful!

Daily Weekly Monthly Yearly OpensThis indicator draws key level lines such as daily open, weekly open, monthly open, yearly open, previous daily open, previous weekly open, previous monthly open, previous yearly open, monday daily high and monday daily low to chart. This lines can act either support or resistance but it is just possibility. This lines will help you to find buy and sell places.
Daily Open Horizontal LineThis script draws a horizontal line that starts in the daily open (00:00 UTC)
Basically I did this since lots of times price come back down/up to the daily open and then bounces, meaning we can take trades based on this.
Hope you enjoy it.
PD: Took the code from infernix, all the credits to him, I know shit about coding.
Infernix TDV Profile: tradingview.com/u/infernixx
Key Levels by RifeMy take on Key Levels script that plots:
- Daily Open
- Weekly Open
- Monthly Open
- Day of Week Range (i.e. Monday Range)
- Initial Balance
Open levels are not visible on higher time frames, such as Daily Open is not visible on Weekly Open nor Monthly Open.
Initial Balance is not visible on the following timeframes: 2H, 4H, 6H, 8H, 1D, 1W and 1M. All other time frames will show it.

Static + Dynamic LevelsShows static and dynamic levels which can act as support/resistance. These are important as there is a lot of users who are interested in buying/selling at these prices.
Static Levels include -
Daily/Weekly/Monthly/Yearly Open (changes color depending on if below or above price)
Previous Daily/Weekly/Monthly/Yearly Open
Previous day's High/Low
Dynamic Levels include -
100/200 Daily MA
100/200 Weekly MA

Scrooge quarter points and Daily open IndicatorHello Friends ,
This indicator is mainly used in Market maker methods as well as quarter point theory .
This indicator plots the quarter points which is a whole number like 00, 50 , 25 of price levels in the chart as well as daily open line.
Price tend to trap traders in this zones .
hope you will enjoy the indicator.

All in OneSettings
Inputs for Lines
1. Last Price - Price follows the candle. Bullish candle - price level green, Bearish candle - price level red
2. Daily Open - Today's Daily Open line. Price above Daily open line - color green, Price below Daily open line - color red
3. Previous High Low/b] - Shows Yesterday's High Low lines. (PH - Previous High, PL - Previous Low) Yesterday's Range (Pips range)
4. Daily Zone - Shows Zones calculated by 5% of Yesterday's Range. High Low zones
Color - Color option for Previous High Low, Daily Zone and Daily range
Inputs for PPL's
1. Show PPL 300 pips range - Shows Round numbers between 300 pips range. Follows price. (PPL-Perfect Price Levels .500 1.000 levels
2. Show Minor PPL - Shows round numbers between 50 pips range. Minor PPL .200 .800 levels
3. Add PPL 500 pips range/b] - Shows round numbers between 500 pips range.
Inputs for Session
Show X days Candle History - Shows X days Forex Session open close candle history. 0 shows only today's session.
1. Show Full candle history - Shows all days Session open close candle history. For Replay mode. Default is false
2. PreLondon Open candle - Arrow appears above or below candle.(PL - PreLondon 2 hours before London Open) Bullish candle - green arrow below the candle, Bearish candle - red arrow above the candle
3. London Open Close - Arrow appears above or below candle.(LO - London Open, LC - London Close) Bullish candle - green arrow below the candle, Bearish candle - red arrow above the candle
4. Newyork Open Close - Arrow appears above or below candle.(NO - Newyork Open, NC - Newyork Close) Bullish candle - green arrow below the candle, Bearish candle - red arrow above the candle
5. Daylight Saving Time shift? - Arrow shifts 1 hour.(Winter time - Oct to Mar, Summer time - Mar to Oct) Default is for summer time
Style
1. Labels - Shows labels and prices for lines. DO price, PH and PL prices, Daily Pips range and PPL price levels
2. Lines - Shows lines and Last Session break. DO line, PH and PL lines, Daily zone lines, Last Session break and PPL lines [/i
Recommended Forex brokers - Forex.com, OANDO, FXCM, Saxo and CURRENCYCOM for indicies
