Indicators, Strategies and Libraries
Hello Traders! As most of you know that Moving Averages with the lengths 50, 100, 150 and 200 are very important. We should use these this moving averages to figure out S/R levels, the possible reversals points, trend direction etc. we should check these moving averages on Higher Time Frames as well. for example if you look at the chart with 5mins time frame,...
Hello All, This is Market Profile script. "Market Profile is an intra-day charting technique (price vertical, time/activity horizontal) devised by J. Peter Steidlmayer. Steidlmayer was seeking a way to determine and to evaluate market value as it developed in the day time frame. The concept was to display price on a vertical axis against time on the horizontal,...
Hello Traders, This is Cumulative Delta Volume script. Delta refers to the difference between buying and selling volume at each price level. Cumulative Delta builds upon this concept by recording a cumulative tally of these differences in buying vs selling volume. The Cumulative Delta indicator plots as candlesticks or line. One of the main uses of Cumulative...
Hello Traders! After the addition of "Arrays" to the Pine, I developed new and improved version of Support Resistance - Dynamic script as version 2. In this script Arrays were used. This can be used as Support Resistance tool, also it will be an example for the people who want to learn Array usage in Pine. Many thanks to Pine Team for adding Arrays! The...
Hello Traders, With the info "Trend is Your Friend ", you should not take position against the trend. This script checks multipte moving averages if they are above/below the closing price and try to find trend. The moving averages with the length 8, 13, 21, 34, 55, 89, 144, 233, 377 used. these are fibonacci numbers, but optionally you can change the lengths...
Hello Traders, This is Support Resistance script that uses Multi Time Frame. While getting Close/Open/High/Low values of Higher Time Frames the script does NOT use Security function , instead it calculates them. while choosing Higher Time Frame, you can use "Auto" option so it uses predefined Higher Time Frames, or you can choose the Higher Time Frame...
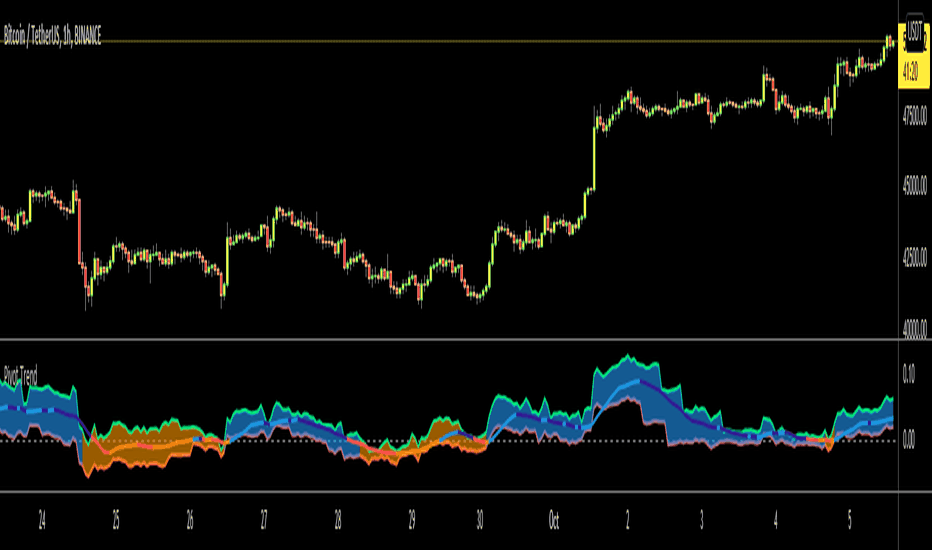
Hello Traders, Another original idea is here with you. Actualy I can say that it's a breakout strategy that uses multiple Pivot Point's averages. How it works? - it finds the Pivot Points, you can set the length as you want - it gets averages of Pivot Highs and Pivot Lows, you can set the number of Pivot Points to be included - it compares the current closing...
So here's an updated version of my automatic Pivot Point detector. If you don't like having a bunch of Pivots on your chart at once, or having to cycle through various resolutions to see different ones, this is for you! What does this indicator do? It automatically detects the nearest daily, weekly, and monthly pivot points both above and below the current...
Hello All, This is Moving Averages Trend Following 3D indicator. The idea is based on direction of MAs and relation between 20 moving averages (5 to 100 period). Option to show different type of MAs: EMA, SMA, RMA, WMA, VWMA. As I haved tested it looks succesful at calculating trend direction and trend strength. For a better look I tried to make it 3D, it...
Hi Everyone Usually I need Price Change info and I believe most of you need this info too. I want to see how it increased/decreased. I automate this by using Pivot Points. it works dynamically and it uses Pivot Highs and Pivot Lows accordingly. That means it calculates which one to use. Please watch following video: Enjoy!
Hello Everyone. Almost one year later, with Pine version 4, I developed new version of the Divergence for many Indicator. It analyses divergences for 10 predefined indicators and then draws line on the graph. Red for negatif divergence (means prices may go down or trend reversal), Lime for positive divergences (means prices may go up or trend...
Hello Everyone! This is my new trend lines script (after beta version that was published almost one year ago) The idea is to find Pivot Highs (PH) and Pivot Lows(PL) first. Then, If current PH is smaller then previous PH (means no new higher high and possible downtrend) then draw trend line using them. and also it checks previous trend line (if exits) and if...
This script finds pivot highs and pivot lows then calculates higher highs & lower lows. And also it calculates support/resistance by using HH-HL-LL-LH points. Generally HH and HL shows up-trend, LL and LH shows down-trend. If price breaks resistance levels it means the trend is up or if price breaks support level it means the trend is down, so the script...
This indicator plots the weekly and daily open in addition to a current close price line. It also signals when price closes above or below the daily and weekly opens. Also, the bull/bear bias is painted on this indicator as well. Black is the weekly open Silver is the daily open Weekly is default black arrows. Up is going above open, down is going below ...


