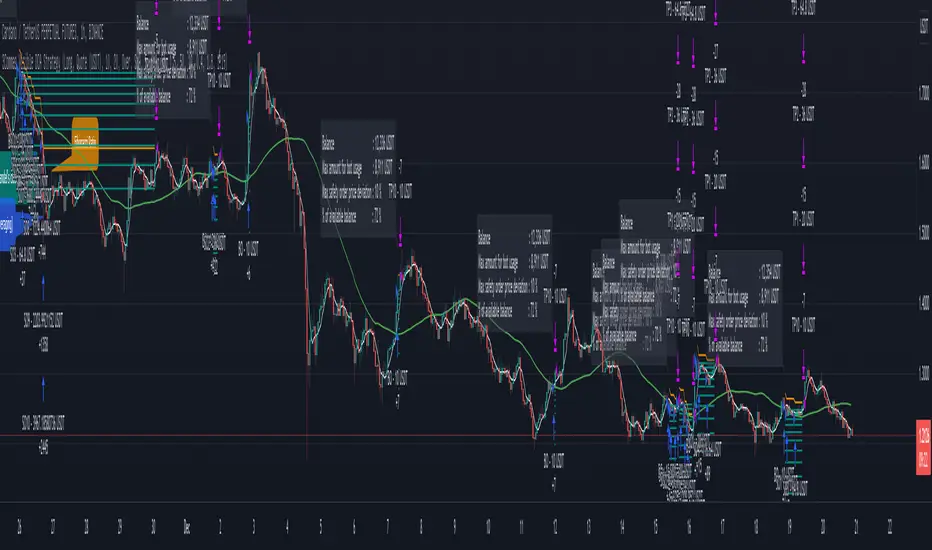
3Commas Visible DCA StrategyThis strategy consists of the following elements and can all be set by the user.
1. Entry by moving average cross.
1) Selection of moving average line.
- SMA(Simple Moving Average)
- EMA(Exponential Moving Average)
- HMA(Hull Moving Average)
2) Selection of Cross over / Cross under
2. Add Entry by DCA(Dollar Cost Averaging)
- A DCA strategy is the practice of investing into a currency at preset intervals to reduce the entry price of a position over time and mitigate volatility risk.
For example,
Base Order = 10 Dollar at Price 100%
Safety Order1 = 20 Dollar at Price 90%
Safety Order2 = 40 Dollar at Price 80%
Average Price => Price 80~90%
thereby getting a better average price for your position and greatly reducing risks from the consequences of volatility.
3. Target Price and Stop Loss.
1) Target Price : Realize profits at % set from the average unit price.
2) Stop Loss : Stop Loss % set from the last safety order.
You can easily find out what's related by changing the setting value after setting the strategy.
This strategy has the following Good characteristics.
1. It informs you of the assets required according to DCA settings.
If you are short of assets, a warning sign will appear.
2. Amount of assets invested in each long entry and long entry close.
3. Visibility of the lowest purchase price line and DCA purchase location according to DCA setting.
easily check the values set in the backtest.
I hope it will help you. Thank you.
DCA
Orion Algo Strategy v2.0Hi everyone.
I decided to make the latest Orion Algo open to people. I don't have enough time to work on it lately, so I figured it would be best that everyone can have it to work on it. I took out some stuff from the original but it should give an idea on how things work. I made two strategies with this so far so you can use that to come up with your own. I recommend the DCA strategy because it gives you the most bang for Orion Algo's buck. It's pretty good at finding long entries.
Overall I hope you guys like this one. Also, Banano is the best crypto currency :)
-INFO-
Orion Algo is a trading algorithm designed to help traders find the highs and lows of the market before, during, and after they happen. We wanted to give an indicator to people that was simple to use. In fact we created the algorithm in such a way that it currently only needs a single input from the user. Since no indicator can predict the market perfectly, Orion should be used as just another tool (although quite a sharp one) for you to trade with. Fundamental knowledge of price action and TA should be used with Orion Algo.
Being an oscillator, Orion currently has a bias towards market volatility . So you will want to be trading markets over 30% volatility . We have plans to develop future versions that take this into account and adjust automatically for dead conditions. Also, while there are some similarities across all oscillators, what sets ours apart is the prediction curve. The prediction curve looks at the current signal values and gives it a relative score to approximate tops and bottoms 1-2 bars ahead of the signal curve. We also designed a velocity curve that attempts to predict the signal curve 2+ bars ahead. You can find the relative change in velocity in the Info panel. The bottom momentum wave is based on the signal curve and helps find overall market direction of higher time-frames while in a lower one.
Settings and How to Use them:
User Agreement – Orion Algo is a tool for you to use while trading. We aren’t responsible for losses OR the gains you make with it. By clicking the checkbox on the left you are agreeing to the terms.
Super Smooth – Smooths the main signal line based on the value inside the box. Lower values shift the pivot points to the left but also make things more noisy. Higher values move things to the right making it lag a bit more while creating a smoother signal. 8 is a good value to start with.
Theme – Changes the color scheme of Orion.
Dashboard – Turns on a dashboard with useful stats, such as Delta v, Volatility , Rsi , etc. Changing the value box will move the dashboard left and right.
Prediction – A secondary prediction model that attempts to predict a reversal before it happens (0-2bars). This can be noisy some times so make your best judgement. Curve will toggle a curve view of the prediction. Pivots will toggle bull/bear dots.
∆v – Delta v (change in velocity). This shows momentum of the signal. Crossing 0 signals a reversal. If you see the delta v changing direction, it may signify a reversal in the several bars depending on the overall momentum of the market.
Momentum Wave – Uses the signal as a macro trend indicator. Changes in direction of the wave can signify macro changes in the market. Average will toggle an averaging algorithm of the momentum waves and makes it easy to understand.
-STRATEGIES-
Simple - Just buy and sell on the dots
DCA - Uses the settings in the script for entries. If a buy dot appears then it will buy, if the price goes below the percentage it will wait for another dot before entering. This drastically improves DCA potential.

cowen risk indexThis is my attempt at remaking the cowen risk index. It's definitely not correct, but should give a rough estimate of where his indicator is at. I am taking the price divided by the 400sma to get an oscillator, then we need to account for diminishing returns so I just made an exponentially increasing variable and mutliplying that by the oscillator value. Then I normalized the data as best as I could. Not sure exactly how to do that so if anyone has any suggestions, please let me know.
This only works on the daily and weekly timeframe. You will need to edit the code if you want to have it work for other timeframes.

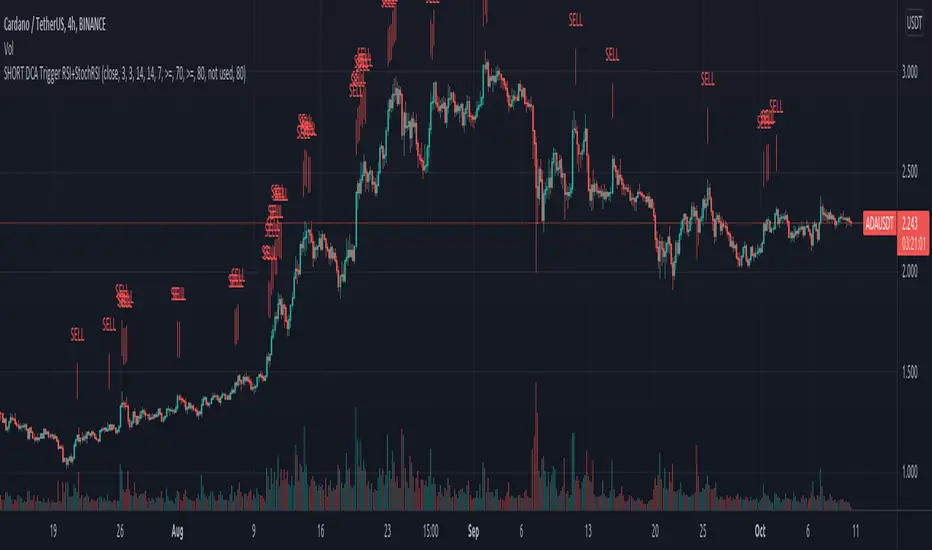
Zendog SHORT DCA Trigger RSI+StochRSIThis is a script that generates a SELL signal by combining RSI and Stochastic RSI into the same script and that can easily be integrated into an external Backtester like the one I published.
The script uses default values for RSI and Stochastic RSI overbought conditions.
They should be adjusted for specific assets and timeframes so they better match the current trend. Please beware you might overfit settings to match a short timeframe trend (like a few days or hours). If this is the case once the trend changes the signals will not be accurate.
The purpose of this script is to provide some pine code that can be used to further combine multiple indicators into a SHORT Deal Start signal.
Integration with the Zendog Backtster:
- add the backtester on the chart
- add this script on the chart
- in the Zendog backtester Deal start type select "External indicator"
- in the Zendog backtester Indicator source and value select "Zendog SHORT DCA Trigger RSI+StochRSI: SIGNAL"
DCA Bot Long/Short Thanks to @TheTradingParrot for the inspiration and knowledge shared.
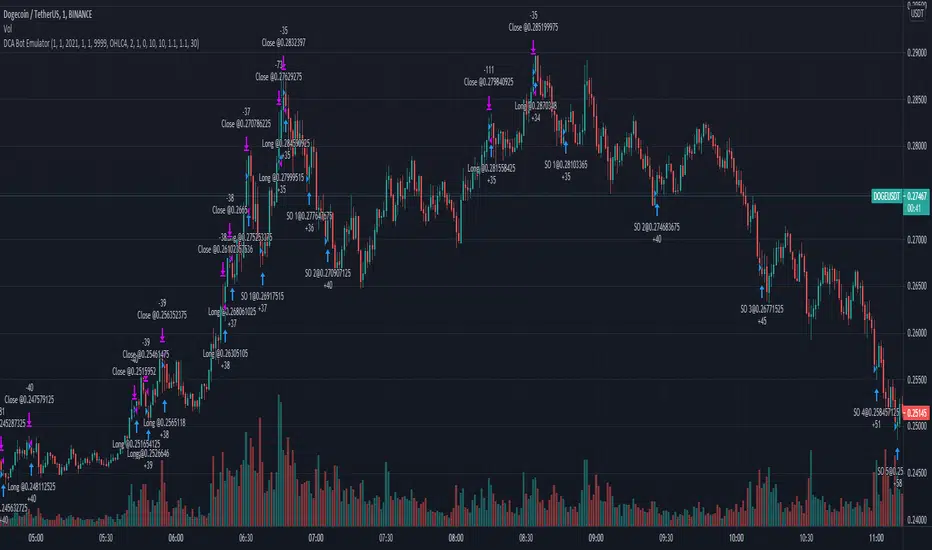
Thanks to @ericlin0122 for the original DCA Bot Emulator which is the backbone of this strategy.
The script simulates DCA strategy with parameters used in 3commas DCA bots for futures trading. Experiment with parameters
to find your trading setup.
Beware how large your total leveraged position is and how far can market go before you get liquidated!
Do that with the help of futures liquidation calculators you can find online!
I`ve added:
1) an internal average price and profit calculating, instead of TV`s native one, which is subject to severe slippage.
2) I`ve built a graphic interface, so levels are clearly visible and back-test analyzing made easier.
3) now both Long & Short direction of the strategy exist.
4) trailing TP which was featured in the initial script has been removed because TV`s execution model makes
it impossible to know how the real world trailing would have unfolded.
5) the table is self explanatory, and it is there to help you discover what happened and where.
6) vertical colored lines appear when the new maximum deviation from the original price has
been reached
All the trading happens with total account capital, and all order sizes inputs are expressed in percent.
Known issues:
When deviation is small, and the same candle triggers safety AND the close order, the initial orders are closed, but a
new one opens on the next candle. This is "resolved" by closing the unwanted trade forcefully on the next candle, affecting
profit calculating minimally and guaranteeing that what should be closed has been closed.
The code could be improved through use of arrays, making the table flexible so the number of rows should be dynamic depending
on the number of SOs.
!!!!! IMPORTANT!!!!!
This strategy script is made to receive a signal from an exterior study script, which should plot +100 for long or -100 for short
entry (that is by default - values can be changed in the strategy settings menu). That plot should be found in "Enter Trigger" input
dropdown menu at the bottom of strategy settings menu. Removing the "and trigger == long/short_trigger" condition from strategy entry
conditions makes the strategy open trades ASAP.
Cheers!

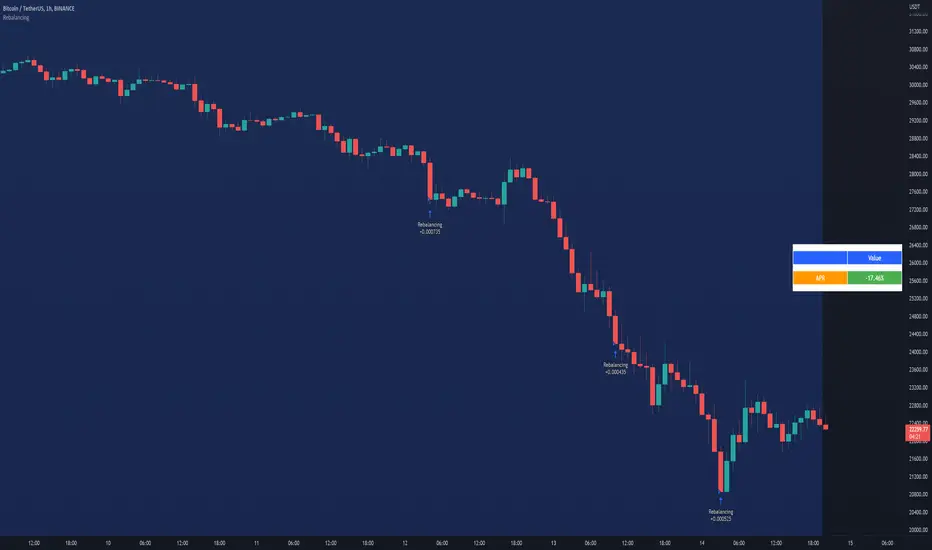
RebalancingThis script gives you an approximation of the APR you can get when using the technique of Rebalancing.
Further discription are embeded in the script.
HOW TO USE:
- Start date: Choose start date
- Settings: Change settings to your own needs
- Base currency: Select Base currency
- Portfolio: Select the coins (MAX 9 pcs.) you want to use in your portfolio for the rebalancing algoritm
- Click "Data Window" to see the APR (appr.)
Markets:
It can be used to all markets.
NOTE:
Some Exchanges don't go very far back in the past and for this reason this may have impact on this Indicator.
Make sure the coins you selected are available at the Exchange you select in the settings section. If you dont do this, the script generates an error.
Zendog V2 backtest DCA bot 3commasHi everyone,
After a few iterations and additional implemented features this version of the Backtester is now open source.
The Strategy is a Backtester for 3commas DCA bots. The main usage scenario is to plugin your external indicator, and backtest it using different DCA settings.
Before using this script please make sure you read these explanations and make sure you understand how it works.
Features:
- Because of Tradingview limitations on how orders are grouped into Trades, this Strategy statistics are calculated by the script, so please ignore the Strategy Tester statistics completely
Statistics Table explained:
- Status: either all deals are closed or there is a deal still running, in which case additional info
is provided below, as when the deal started, current PnL, current SO
- Finished deals: Total number of closed deals both Winning and Losing.
A deal is comprised as the Base Order (BO) + all Safety Orders (SO) related to that deal, so this number
will be different than the Strategy Tester List of Trades
- Winning Deals: Deal ended in profit
- Losing deals: Deals ended with loss due to Stop Loss. In the future I might add a Deal Stop condition to
the script, so that will count towards this number as well.
- Total days ( Max / Avg days in Deal ):
Total Days in the Backtest given by either Tradingview limitation on the number of candles or by the
config of the script regarding "Limit Date Range".
Max Days spent in a deal + which period this happened.
Avg days spent in a deal.
- Required capital: This is the total capital required to run the Backtester and it is automatically calculated by
the script taking into consideration BO size, SO size, SO volume scale. This should be the same as 3commas.
This number overwrites strategy.initial_capital and is used to calculate Profit and other stats, so you don't need
to update strategy.initial_capital every time you change BO/SO settings
- Profit after commission
- Buy and Hold return: The PnL that could have been obtained by buying at the close of the first candle of the
backtester and selling at the last.
- Covered deviation: The % of price move from initial BO order covered by SO settings
- Max Deviation: Biggest market % price move vs BO price, in the other direction (for long
is down, for short it is up)
- Max Drawdown: Biggest market % price move vs Avg price of the whole Trade (BO + any SO), in the other
direction (for long price goes down, for short it goes up)
This is calculated for the whole Trade so it is different than List of Trades
- Max / Avg bars in deal
- Total volume / Commission calculated by the strategy. For correct commission please set Commission in the
Inputs Tab and you may ignore Properties Tab
- Close stats for deals: This is a list of how many Trades were closed at each step, including Stop Loss (if
configured), together with covered deviation for that step, the number of deals, and the percentage of this
number from all the deals
TODO: Might add deal avg value for each step
- Settings Table that can be enabled / disabled just to have an overview of your configs on the chart, this is a
drawn on bottom left
- Steps Table similar to 3commas, this is also drawn on bottom left, so please disable Settings table if you want
to see this one
TODO: Might add extra stats here
- Deal start condition: built in RSI-7 or plugin any external indicator and compare with any value the indicator plots
(main purpose of this strategy is to connect your own studies, so using external indicator is recommended)
- Base order and safety orders configs similar to 3commas (order size, percent deviation, safety orders,
percent scale and volume scale)
- Long and Short
- Stop Loss
- Support for Take profit from base order or from Total volume of the deal
- Configs help (besides self explanatory):
- Chart theme: Adjust according to the theme you run on. There is no way to detect theme at the moment.
This adjust different colors
- Deal Start Type: Either a builtin RSI7 or "External indicator"
- Indicator Source an value: If using External Indicator then select source, comparison and value.
For example you could start a deal when Volume is greater than xxxx, or code a custom indicator that plots
different values based on your conditions and test those values
- Visuals / Decimals for display: Adjust according to your symbol
- BO Entry Price for steps table: This is the BO start deal price used to calculate the steps in the table

ROC_PA_Strategy (A3Sh)Hi there,
An experiment with rate of price change in combination with price averaging. The strategy is inspired by Price Change Scalping Strategy developed by Prosum Solutions and Scalping Dips On Trend Strategy developed by Coinrule. Both strategies look at the percentage of price change to open orders.
When the price drops beyond a specified percentage, a order entry threshold (yellow line) is setup. The order entry threshold is only active for a specified number of bars and will de-activate when not crossed within the specified number of bars. When the price drops further and crosses the entry threshold with a minimum of a specified percentage, a long position is entered. The same reverse logic (white line) used to close the long position.
I first ran the strategy without stop loss and take profit and that worked very well in a bullish market. I later added stop loss and take profit and that seems to work better in a side ways or bearisch market. There are a lot of tweaking possibilities in the settings.
In the settings you can specify the percentage of portfolio to use for each trade to spread the risk and for each order a trading fee of 0.075% is calculated.

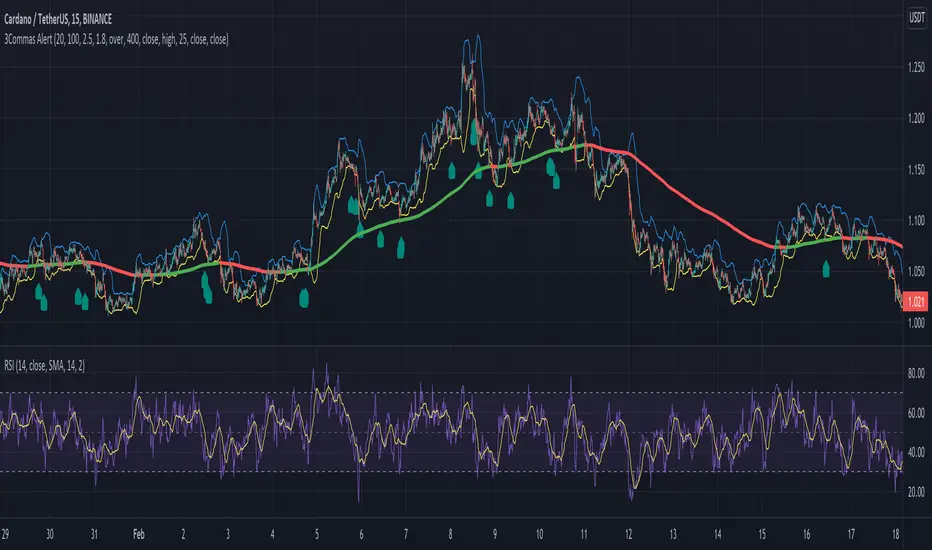
Alert for 3Commas Bollinger StrategyThis is just an alert for the 3Commas Bollinger Strategy written by tedwardd
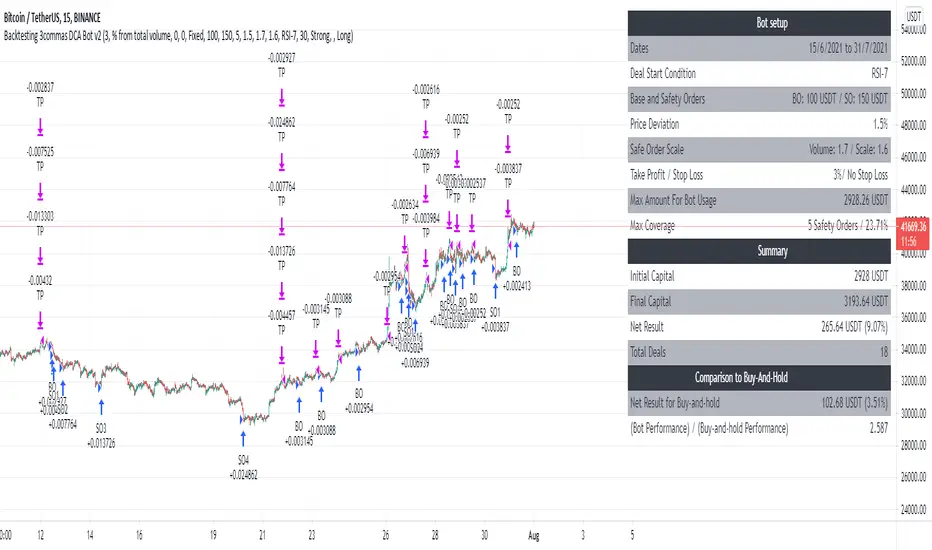
Backtesting 3commas DCA Bot v2Updating previously published simulated 3commas DCA logic with a sexier insert and more meaningful default parameters.
Bollinger DCA v1Simple "benchmark" strategy for ETFs, Stocks and Crypto! Super-easy to implement for beginners, a BTD (buy-the-dip) strategy means that you buy a fixed amount of an ETF / Stock / Crypto every time it falls. For instance, to BTD the S&P 500 ( SPY ), you could purchase $500 USD each time the price falls. Assuming the macro-economic conditions of the underlying country remain favourable, BTD strategies will result in capital gains over a period of many years, e.g. 10 years.
Recommended Chart Settings:
Asset Class: ETF / Stocks / Crypto
Time Frame: H1 (Hourly) / D1 (Daily) / W1 (Weekly) / M1 (Monthly)
Necessary ETF Macro Conditions:
1. Country must have healthy demographics, good ratio of young > old
2. Country population must be increasing
3. Country must be experiencing price-inflation
Necessary Stock Conditions:
1. Growing revenue
2. Growing net income
3. Consistent net margins
4. Higher gross/net profit margin compared to its peers in the industry
5. Growing share holders equity
6. Current ratios > 1
7. Debt to equity ratio (compare to peers )
8. Debt servicing ratio < 30%
9. Wide economic moat
10. Products and services used daily, and will stay relevant for at least 1 decade
Necessary Crypto Conditions:
1. Honest founders
2. Competent technical co-founders
3. Fair or non-existent pre-mine
4. Solid marketing and PR
5. Legitimate use-cases / adoption
Default Robot Settings:
Contribution (USD): $500
When: Dips below lower Bollinger Band
*Robot buys $500 worth of ETF , Stock, Crypto, every time price falls below the lower Bollinger Band
*Equity curve can be seen from the bottom panel*
Risk Warning:
This strategy is low-risk, however it assumes you have a long time horizon of at least 5 to 10 years. The longer your holding-period, the better your returns. The only thing the user has to keep-in-mind are the macro-economic conditions as stated above. If unsure, please stick to ETFs rather than buying individual stocks or cryptocurrencies.

Bollinger Bands + RSI Alerts for 3commas/DCA botHey Folks !
This is in indicator that generates buy alerts combining Bollinger Bands and RSI.
RSI validates the BB signal by confirming we are not in an oversold area.
Interval: 3m to 15m
Recommended settings for 3commas DCA bot
- TP/TTP: 0.3%/0.1%,
- Base Order: Your choice ,
- Safety Order: 1.2 * Your choice of base order
- Safety Order Volume Scale: 1.2,
- Safety Order Step Scale: 1.5,
- Price Deviation to Open Safety Order (% from initial order): 0.25%,
- Max Safety Trades Count: 7
- DO NOT USE STOP LOSS
> Create Alert with Buy Alert and link it to "Message for deal start signal"

Bitcoin Difficult Model [ChuckBanger]Simple script that graphically represents the mining difficulty of Bitcoin. It is ment to be used as a tool to decide when it is good time to dollar cost average (DCA) in your Bitcoin hodl position. When Price is below the difficulty model it is usually a good time to DCA.
Formula for the model used in this calculation is 0.002 * difficulty ^ 0.51. It is possible to change this numbers if necessarily.

Bollinger Bands and RSI mix with DCAThis strategy uses a mix of Bollinger Bands and RSI to enter long positions. It impliments DCA.

ETF / Stocks / Crypto - DCA Strategy v1Simple "benchmark" strategy for ETFs, Stocks and Crypto! Super-easy to implement for beginners, a DCA (dollar-cost-averaging) strategy means that you buy a fixed amount of an ETF / Stock / Crypto every several months. For instance, to DCA the S&P 500 (SPY), you could purchase $10,000 USD every 12 months, irrespective of the market price. Assuming the macro-economic conditions of the underlying country remain favourable, DCA strategies will result in capital gains over a period of many years, e.g. 10 years. DCA is the safest strategy that beginners can employ to make money in the markets, and all other types of strategies should be "benchmarked" against DCA; if your strategy cannot outperform DCA, then your strategy is useless.
Recommended Chart Settings:
Asset Class: ETF / Stocks / Crypto
Time Frame: H1 (Hourly) / D1 (Daily) / W1 (Weekly) / M1 (Monthly)
Necessary ETF Macro Conditions:
1. Country must have healthy demographics, good ratio of young > old
2. Country population must be increasing
3. Country must be experiencing price-inflation
Necessary Stock Conditions:
1. Growing revenue
2. Growing net income
3. Consistent net margins
4. Higher gross/net profit margin compared to its peers in the industry
5. Growing share holders equity
6. Current ratios > 1
7. Debt to equity ratio (compare to peers)
8. Debt servicing ratio < 30%
9. Wide economic moat
10. Products and services used daily, and will stay relevant for at least 1 decade
Necessary Crypto Conditions:
1. Honest founders
2. Competent technical co-founders
3. Fair or non-existent pre-mine
4. Solid marketing and PR
5. Legitimate use-cases / adoption
Default Robot Settings:
Contribution (USD): $10,000
Frequency (Months): 12
*Robot buys $10,000 worth of ETF, Stock, Crypto, regardless of the market price, every 12 months since its founding time.*
*Equity curve can be seen from the bottom panel*
Risk Warning:
This strategy is low-risk, however it assumes you have a long time horizon of at least 5 to 10 years. The longer your holding-period, the better your returns. The only thing the user has to keep-in-mind are the macro-economic conditions as stated above. If unsure, please stick to ETFs rather than buying individual stocks or cryptocurrencies.

Daily Risk RangesThis indictor creates daily Risk Ranges using historical volatility, volatility skew and vol-of-vol.

msoro daily DCATool to estimate PnL of your investment if you put in a fixed $ amount daily into btc for past year. It takes input as 365 days which can be changed as per need.

BEST Dollar Cost AverageHello traders
This is an upgraded version of my Dollar Cost Average (Data Window) script
1 - What is Dollar-Cost Averaging ( DCA )?
Dollar-Cost Averaging is a strategy that allows an investor to buy the same dollar amount of investment at regular intervals. The purchases occur regardless of the asset's price.
I hope you're hungry because that one is a biggie and gave me a few headaches. Happy that it's getting out of my way finally and I can offer it
🔸 This indicator will analyze for the defined date range, how a dollar-cost average ( DCA ) method would have performed (green panel) versus investing all the hard earnt money at the beginning (orange panel)
=> green versus orange
2- What's on the menu today?
My indicator works with all asset classes and with the daily/weekly/monthly inputs.
⚠️⚠️⚠️ However, results are only visible on the DAILY timeframe chart
As always, let's review quickly the different fields so that you'll understand how to use it (and I won't get spammed with questions in DM ^^)
🔸 Use current resolution: if checked will use the resolution of the chart
🔸 The timeframe used for DCA: different timeframe to be used if Use current resolution is unchecked
🔸 Amount invested in your local currency: The amount in Fiat money that will be invested at each period selected above
🔸 Starting Date
🔸 Ending Date
🔹 The script screenshot shows a DCA with 100 USD invested daily from 01.01.2017 to 01.28.2020
3- Bonus (DATA WINDOW)
🔸 Please check this screenshot to understand what you're supposed to see: Data window
And a quick video that I did months ago explaining how we can use this data window effectively
4 - Specifications used
I got the idea from this website dcabtc.com and the result shown by this website and my indicator are very interesting in general and for your own trading
The formula used for the DCA calculation is the one from the Investopedia website.
Best regards and best of luck
Dave

Blockchain Fundamentals - Satoshies Per Dollar by Cryptorhythms🔗Blockchain Fundamentals - Satoshis Per Dollar by Cryptorhythms
Intro
SPD is a new metric I propose which can be used to determine general sentiment and help narrow down periods to DCA .
Description
In the most basic sense this indicator is simply showing you how many satoshies are equal to one US dollar . This can be a useful metric to keep stored in the back of your mind. It can also give you a new satoshi based perspective on bitcoin pricing.
I simply added an MA selection option to give a basic sentiment reading. You could also use the red areas as a modified DCA (i.e. only do dollar cost averaging when red zone is in effect.
The indicator is not really meant for buy/sell signaling but more as a reference
👍 We hope you enjoyed this indicator and find it useful! We post free crypto analysis, strategies and indicators regularly. This is our 71st script on Tradingview!
💬Check my Signature for other information

Dollar Cost Average (Data Window Edition)Hi everyone
Hope you had a nice weekend and you're all excited for the week to come. At least I am (thanks to a few coffee but that still counts !!!)
This indicator is inspired from Dollar-Cost-Average-Cost-Basis
EDUCATIONAL POST
The educational post is coming a bit later this afternoon explaining how to use the indicator so I would advise to follow me so that you'll get updated in real-time :) (shameless self-advertising)
1 - What is Dollar-Cost Averaging (DCA)?
Dollar-Cost Averaging is a strategy that allows an investor to buy the same dollar amount of an investment on regular intervals. The purchases occur regardless of the asset's price.
I hope you're hungry because that one is a biggie and gave me a few headaches. Happy that it's getting out of my way finally and I can offer it
This indicator will analyse for the defined date range, how a dollar cost average (DCA) method would have performed vs investing all the hard earnt money at the beginning
2- What's on the menu today ?
Please check this screenshot to understand what you're supposed to see : CLICK ME I'M A SCREENSHOT (I'll repeat this URL one more time below as I noticed some don't read the information on my description and then will come pinging me saying "sir me no understand your indicator, itz buggy sir"
(yes I finally thought about a way to share screenshots on TradingView, took me 4 weeks, I'm slow to understand things apparently)
My indicator works with all asset classes and with the daily/weekly/monthly timeframes
As always, let's review quickly the different fields so that you'll understand how to use it (and I won't get spammed with questions in DM ^^)
- Use current resolution : if checked will use the resolution of the chart
- Timeframe used for DCA : different timeframe to be used if Use current resolution is unchecked
- Amount invested in your local currency : The amount in Fiat money that will be invested at each period selected above
- Starting Date
- Ending Date
- Select a candle level for the desired timeframe : If you want to use the open or close of the selected period above. Might make a diffence when the timeframe is weekly or monthly
3 - Specifications used
I got the idea from this website dcabtc.com and the result shown by this website and my indicator are very interesting in general and for your own trading
The formula used for the DCA calculation is that one : Investopedia Dollar Cost Average
4 - How to interpret the results
"But sir which results ??"...... those ones : CLICK ME I'M A SCREENSHOT :) (strike #2 with the screenshot)
It will draw all the plots and will give you some nice data to analyze in the Data Window section of TradingView
I'm not completely satisfied with the tool yet but the results are very closed to the dcabtc website mentioned above
If you're trading a very bullish asset class (who said crypto ?), it's very interesting to see what a DCA strategy could bring in term of performance. But DCA is not magic, there is a time component which is the day/week/month you'll start to invest (those who invested in crypto beginning of 2018 in altcoins know what I'm talking about and ..............will hate me for this joke)
5 - What's next ?
As said, the educational post is coming next but not only.
Will probably post a strategy tomorrow using this indicator so that you can compare what's performing best between your trading and a dollar cost average method
I'll publish as a protected source this time a more advanced version of that one including DCA forecasts
6 - Suggested alternative (but I'll you doing it)
If you don't want to have this panel in the bottom with the plots and analyze the results in the data window, you can always create an infopanel like shown here Risk-Reward-InfoPanel/ and display all the data there
Hope you'll like it, like me, love it, love me, tip me :)
____________________________________________________________
Feel free to hit the thumbs up as it shows me that I'm not doing this for nothing and will motivate to deliver more quality content in the future. (Meaning... a few likes only = no indicators = Dave enjoying the beach)
- I'm an offically approved PineEditor/LUA/MT4 approved mentor on codementor. You can request a coaching with me if you want and I'll teach you how to build kick-ass indicators and strategies
Jump on a 1 to 1 coaching with me
- You can also hire for a custom dev of your indicator/strategy/bot/chrome extension/python
