Volume DeltaVolume Delta
This indicator aims to provide users an idea for momentum and exhaustion, via differentiating between the buy delta and sell delta.
The purpose of this indicator is to give a deeper dive into the data provided by tradingviews volume indicator with greater granularity intrabar from a HTF perspective! (suitable for 30min and up but will work as low as 5m)
Below we can see an additional 2 modes,
Split:
Delta:
The difference between the 3 modes include:
Split is a separation of the initial mode "Singular" it divides the 2 into separate axis positioning to allow for a different perspective of the same data.
Delta: Takes the difference of the 2 and makes it easier for users to see which side was in control, personally delta makes it easier to see DIVS in momentum and where exhaustion is occuring.
Deltavolume
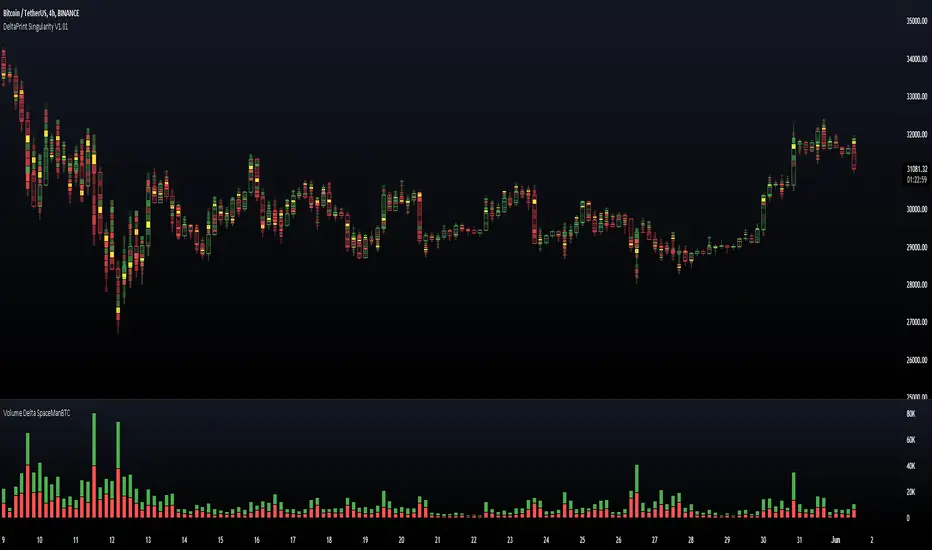
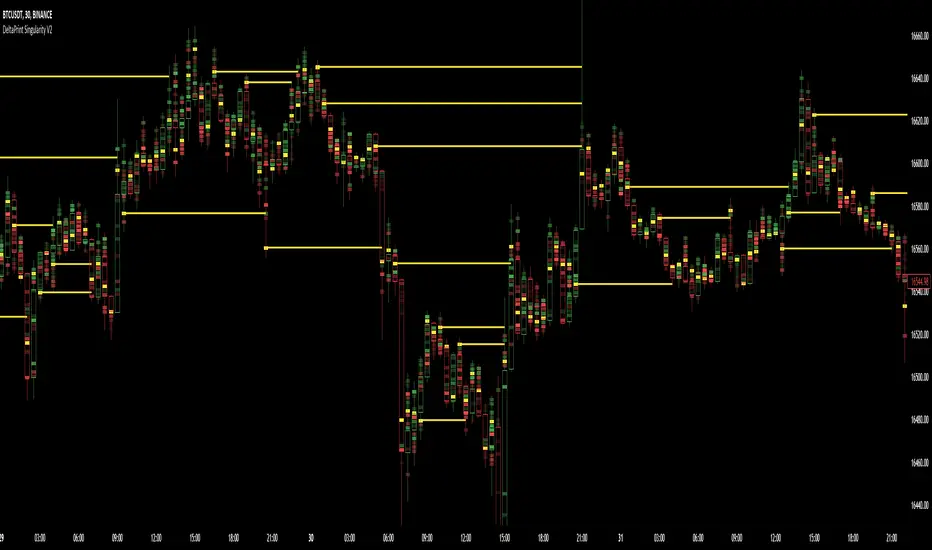
DeltaPrint SingularityDeltaPrint Singularity
DeltaPrint Singularity is a method of bringing a previous DeltaPrint Candles with less granularity but greater historical reference.
The advantages is the ease of use with existing charts and indicators without adjusting for low tf chart for UI Space this is all handled on the same timeframe using intrabar data.
The benefit of such candles is providing users additional data as to location of potentially trapped traders via late entry into positions e.g. late longing a range high or VAH.
Or to provide credence to traders who look for momentum plays seeing momentum drop off likely leading to a period of consolidation or pull back.
The logic used here is different to the previous rendition of the indicator but works well with any and all charts that allow some reference to volume.
This indicator aims to provide users the insight into how traders are positioning and where they are positioning. The indicator comes with a few initial features:
Singular Coloring
Delta Coloring
POC Highlighting
Singular Coloring is useful by providing a minimalist view into volume execution points.
Delta Coloring breaks this down further by providing an estimate into ask:bid (although delta print will be stronger at this)
POC highlighting provides only the volume POC and not Delta POC.
Planned Updates
Delta Weighting
POC Level Extensions
Alerts
Buy/Sell Aggregated Delta Pressure - InFinitoModified & Updated script from MARKET VOLUME by Ricardo M Arjona @XeL_Arjona that Includes Aggregated Volume , Delta Buy/Sell Pressure
Aggregation code originally from Crypt0rus
***The indicator can be used for any coin/symbol to aggregate volume , but it has to be set up manually***
***The indicator can be used with specific symbol data only by disabling the aggregation option, which allows for it to be used on any symbol***
- Calculated based on Aggregated Volume instead of by symbol volume . Using aggregated data makes it more accurate and allows to compare volume flow between different kinds of markets (Spot, Futures , Perpetuals, Futures+Perpetuals and All Volume ).
- As well, in order to make the data as accurate as possible, the data from each exchange aggregated is normalized to report always in terms of 1 BTC . In case this indicator is used for another symbol, the calculations can be adjusted manually to make it always report data in terms of 1 contract/coin.
- Buy/Sell Pressure: Smoothens the buy and sell volume into a signal for each. Which makes it easier to identify Buy and Sell Volume Flow.
- Buy/Sell Delta Pressure: Calculates the difference between Buy & Sell Pressure and plots a Delta signal that shows who is in control currently.
- Buy/Sell + Delta Pressure: Displays both Buy & Sell Pressure and Delta pressure. This can help to visualize who is in control but also how much pressure there is on each side.
- A Moving Average can be plotted to the Delta pressure. This, with confluence, can give great entries/exits
Things to look for:
- Divergences: If price keeps moving in one direction but the pressure to that side decreases it can be inferred that the move might slow down soon or revert. As well if pressure to one side increases but price does not react to it, it signals that the other side is stronger.
- MA/Zero Crossovers: Delta Pressure Crossover of its moving average or the 0 Line can indicate direction changes prematurely

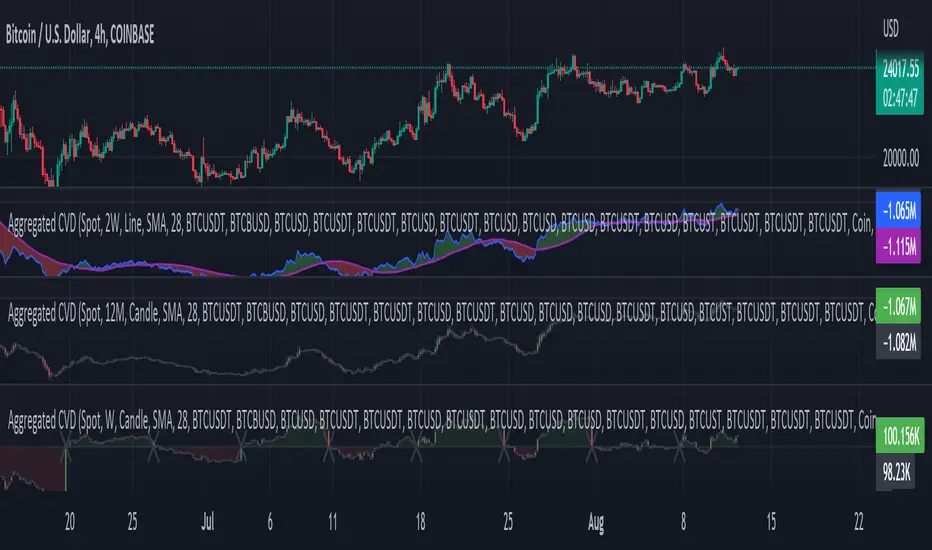
Aggr. CDV / Delta Volume - InFinitoModified & Updated script from MARKET VOLUME by Ricardo M Arjona @XeL_Arjona that Includes Aggregated Volume, Delta Volume, Volume by Side
Aggregation code originally from Crypt0rus
Candle Plotting code from LonesomeTheBlue
***The indicator can be used for any coin/symbol to aggregate volume , but it has to be set up manually***
***The indicator can be used with specific symbol data only by disabling the aggregation option, which allows for it to be used on any symbol***
- Calculated based on Aggregated Volume instead of by symbol volume . Using aggregated data makes it more accurate and allows to compare volume flow between different kinds of markets (Spot, Futures , Perpetuals, Futures+Perpetuals and All Volume ).
- As well, in order to make the data as accurate as possible, the data from each exchange aggregated is normalized to report always in terms of 1 BTC . In case this indicator is used for another symbol, the calculations can be adjusted manually to make it always report data in terms of 1 contract/coin.
All Aggregated Volume By Side: Based of Xel_Arjona's calculation, buy and sell volume is estimated each period. This indicators can display both Buy Volume and Sell Volume for each period.
Aggregated Delta Volume By Side: Displays the difference between Buy & Sell Volume as Delta (Down if Sell Vol - Up if Buy Vol)
Aggregated Cumulative Delta Volume: Displays the sum of Delta Volume as a line, candles or Heiken Aishi Candles. Great for observing Volume Flow and spotting divergences
- It is Possible to add an MA to the CVD and to color fill in between the indicator and the MA
- It is possible to reset the indicators basis to 0 periodically
Volume DeltaVolume Delta is the difference between buying and selling power. Volume Delta is calculated by taking the difference of the volume that traded at the offer price and the volume that traded at the bid price. If delta is greater than 0 you have more buying than selling pressure. If delta is less than 0, you have more selling than buying pressure. This indicator also has a pivots and alarms. Before i create this indicator i'd try all off them on market but all off them seems doing wrong calculation. Price - Some people say "Price Action is King but actually DELTA is King!
By default, this indicator displays “Delta Volume and can be set to:
Plot Levels
Volume
Default TF:
1M
Strategy:
If you get 3 gren delta in a row its buying signal and visa versa for short. You can also use more confirmation with overbought\oversold level.

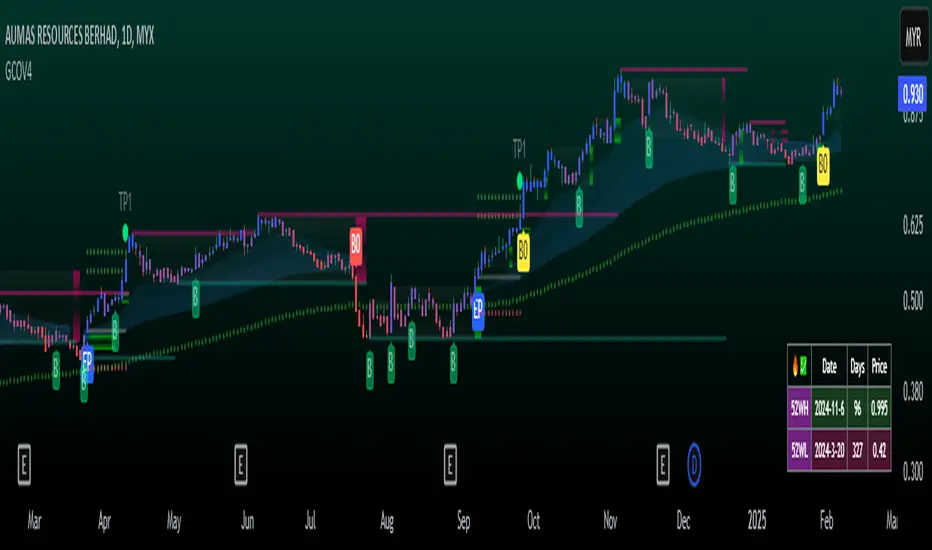
GCOV4 PROTECH GCOV4 PROTECH SYSTEM
This indicator is built specifically for SWING, PULLBACK and BREAKOUT strategy trading in the stocks/equity market. It uses an indicator instrument consisting of ATR TRAILING STOP (ATR), EXPONENTIAL MOVING AVERAGE(EMA), PIVOT POINT and VOLUME ANALYSIS.
The parameters that have been upgraded are to meet the needs of trading strategies whether short or long term trading. In addition, it is built to reduce the risk of trading activities and help traders to adhere to the best trading plan.
This transformation involves 3 trading strategy modes namely SWING PRO, PULL & BOUND and BREAKOUT STRATEGY.
Rebuild of Instrument & Parameter
This indicator is also an upgraded instrument that is sourced from the previous indicator, the GOLDENCO AIE2 INDICATOR.
This R&D of course to make trading activities more effective, dynamic and to increase the confidence of traders in current trading activities. The indicator has been upgraded in terms of parameters as well as additional instruments. Among them are;
1. ATR Trailing Stop
2. Exponential Moving Average – fastMA/slowMA Length
3. Label@Entry Price/Stoploss/Takeprofit line;
>The take profit and stop loss rates are based on percentages. However
traders can change the percentage rate according to their respective
trading plans.
>existing percentage rates have been set(build-in) for standard rate.
So you have to reset based on the type of stock/market cap either penny
stock or blue chip stock.
>The candle/bars have been colored to make it easier for traders to see price
trends whether in bullish or bearish conditions.
Hopefully with the upgrading of these indicators will make traders more successful in trading activities, especially in the equity markets.
DISCLAIMER;
ALL NOTES AND INDICATING TOOLS ARE FOR EDUCATIONAL ONLY AND AS A FACILITATOR AND PREPARATION IN TRADING ACTIVITIES. ADMIN IS NOT RESPONSIBLE FOR ANY RISKS IN YOUR TRADING ACTIVITIES. TAKE AT YOUR OWN RISK.
FunTrader/Aieyee @2022
Realtime Volume Bars w Market Buy/Sell/Neutral split & Mkt Delta
What is it?
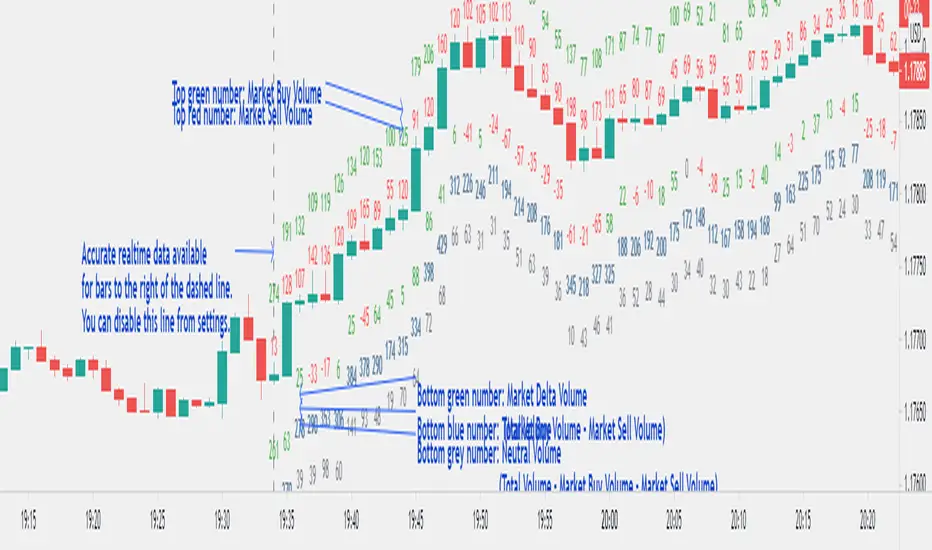
A tool that shows Real-time Volume bars split into 3 components: (1) Market Buy Volume - i.e., the volume that got transacted on upticks; (2) Market Sell Volume - i.e., the volume that got transacted on downticks;
and, (3) Neutral Volume - i.e., the volume that got transacted without a change in price. (This feature can be turned off if you want normal volume bars).
Market delta (i.e., Market Buy Volume - Market Sell Volume) is also displayed above each volume bar. (On by default; can be switched off from Settings)
The split and Market Delta data are ONLY AVAILABLE FOR REAL-TIME BARS. Historical bars are shown just like regular ones. The dotted line marks the start of real-time data (i.e., the bar from which the indicator started collecting and displaying data). You will see accurate data for bars to the right of this line. The longer you keep a chart open with the study enabled, the more data it collects and displays, and the better your analysis can potentially be.
Note that the data gets reset every time any of the options is changed, the market is switched, the browser is refreshed, or the script is reloaded
DATA ISN'T STORED. I.e., every time a new symbol is loaded, the previous symbol's data is lost. So if you intend to monitor a symbol, you would need to keep it loaded all the time.
Who is it for?
For traders who are used to analyzing buy/sell activity using market buy/sell volume and market delta information
Although you can use this independently as well, use it in conjunction with "Market Delta Volume for Realtime Bars" indicator to get a better visual representation of the numbers.

Market Delta Volume for Realtime BarsWhat is it?
Market Delta Volume Tool for real-time bars
A market delta tool that shows, (1) the volume that got transacted on upticks - or the market buy volume; (2) the volume that got transacted on downticks - or the market sell volume (3) the market delta volume (i.e., market buy volume - market sell volume); (4) the total volume (market buy volume + market sell volume + neutral volume); and (4) the volume that got transacted without a change in price - or the neutral volume (total volume = market buy volume + market sell volume + neutral volume)
NOTE: THIS WORKS ONLY ON REAL-TIME BARS, NOT ON HISTORICAL BARS! The dotted line marks the start of real-time data (i.e., the bar from which the indicator started collecting and displaying data). You will see accurate data only for bars to the right of this line.
The longer you keep a chart open with the study enabled, the more data it collects and displays and the better your analysis can potentially be.
Note that the data gets reset every time any of the options is changed, the market is switched, the browser is refreshed, or the script is reloaded.
DATA ISN'T STORED. I.e., every time a new symbol is loaded/or the same symbol is reloaded, data gets refreshed.
Who is it for?
For traders who are used to analyzing buy/sell activity using market delta information. Especially, short-term trader/scalpers who are used to keeping the same chart open through the trading session.
Also for traders to see and study how anomalies in volume can give clues to buyer/seller absorption, initiative buying/selling etc.
Can be used to better understand VSA as well, although not necessary.
Essentially, this gives real-time delta volume information; use it however you see fit.
Cumulative Delta VolumeHello Traders,
This is Cumulative Delta Volume script. Delta refers to the difference between buying and selling volume at each price level. Cumulative Delta builds upon this concept by recording a cumulative tally of these differences in buying vs selling volume. The Cumulative Delta indicator plots as candlesticks or line. One of the main uses of Cumulative Delta is to confirm or deny market trends. you may need to search it for yourself ;)
You have option to see it as Candles or a Line. also there are options to show 2 SMAs and 2 EMAs with different Lengths, you can set the lengths as you wish.
By default it shows CDV as Heikin Ashi Candles, it can also show it as normal candles:
It can show CDV as a line:
Also you may need to check divergence:
Enjoy!
