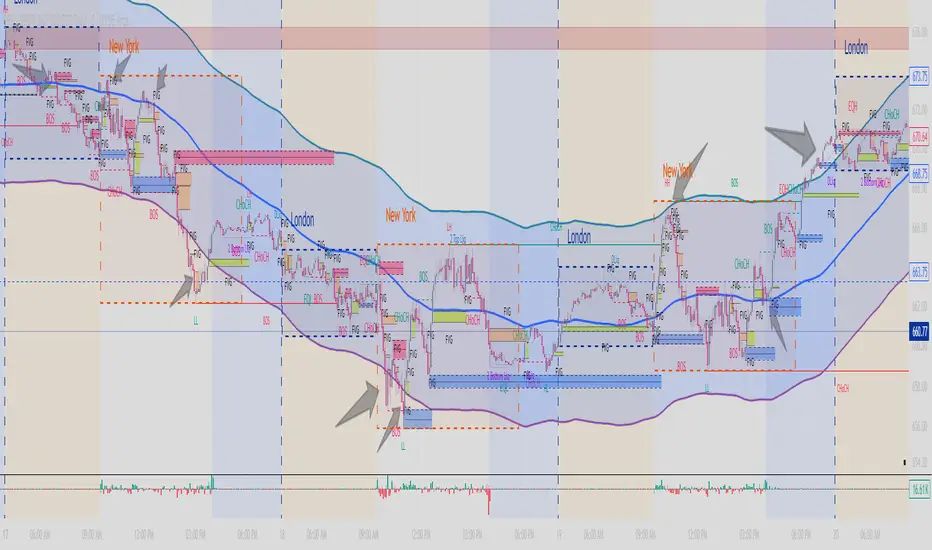
MA200 Parallel ChannelDynamic MA100 Parallel Bands – Precision S/R Levels
This indicator builds a clean, parallel channel around the 100-period moving average using a fixed ±4 offset.
Because the offset mirrors the short-term MA1 fluctuations, the channel reveals highly accurate support and resistance zones that react instantly to market micro-structure.
Unlike Bollinger Bands—which expand with volatility—this tool stays perfectly parallel and trend-aligned, making breakouts and pullbacks incredibly easy to spot.
How it works:
Centerline: 100-period moving average (MA100)
Upper Band: MA100 + 4
Lower Band: MA100 – 4
MA1 used as a sensitivity reference for micro-trend behavior
Parallel structure ensures stable, predictable levels
Why it’s powerful:
The ±4 channel creates extremely precise S/R zones
Price respecting the lower band = dynamic support
Price rejecting the upper band = dynamic resistance
A clean break above or below the bands highlights strong momentum shifts
Perfect for intraday traders needing structure without noise
Perfect for:
Identifying high-probability bounce levels
Spotting early trend continuation
Confirming MA100 breakouts
Filtering weak signals and fake volatility spikes
If you want razor-sharp support & resistance levels that stay consistent across all timeframes, these MA100 parallel bands deliver exceptional clarity.
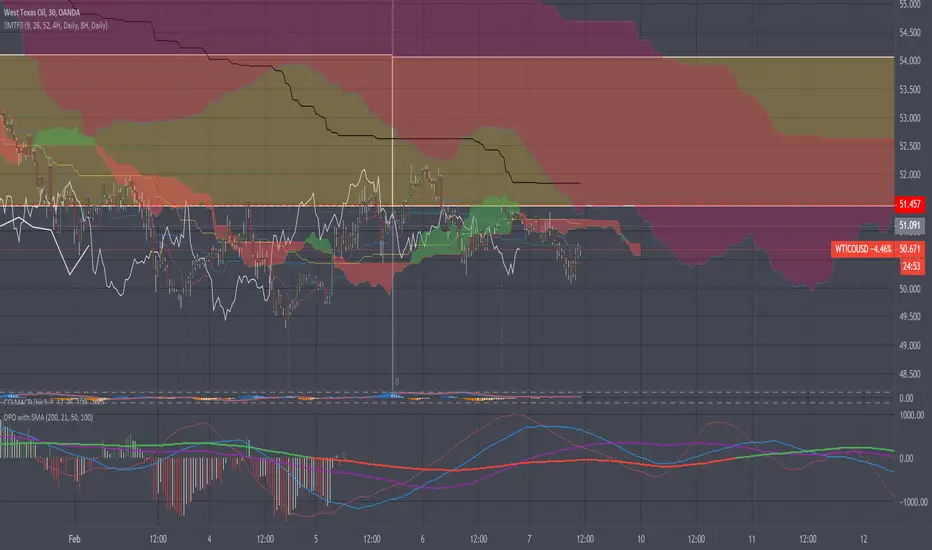
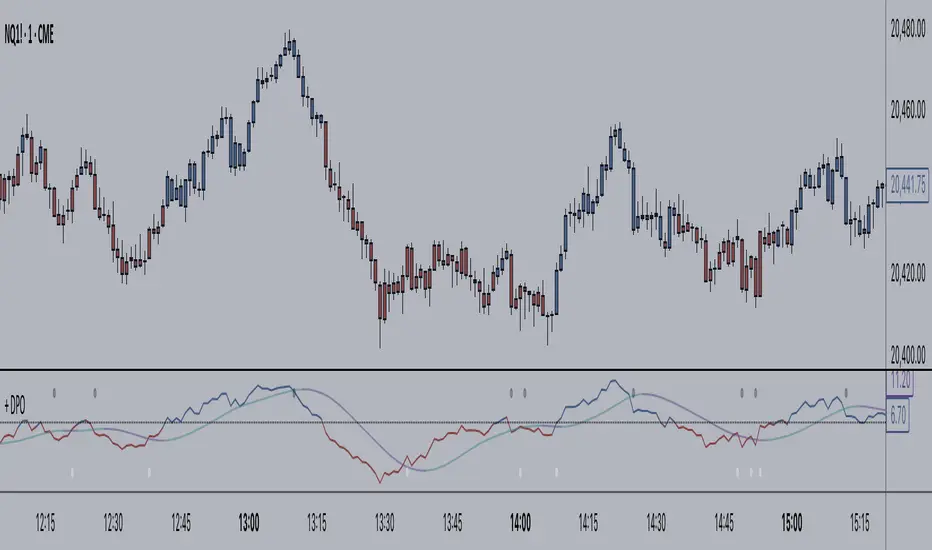
Detrended Price Oscillator (DPO)
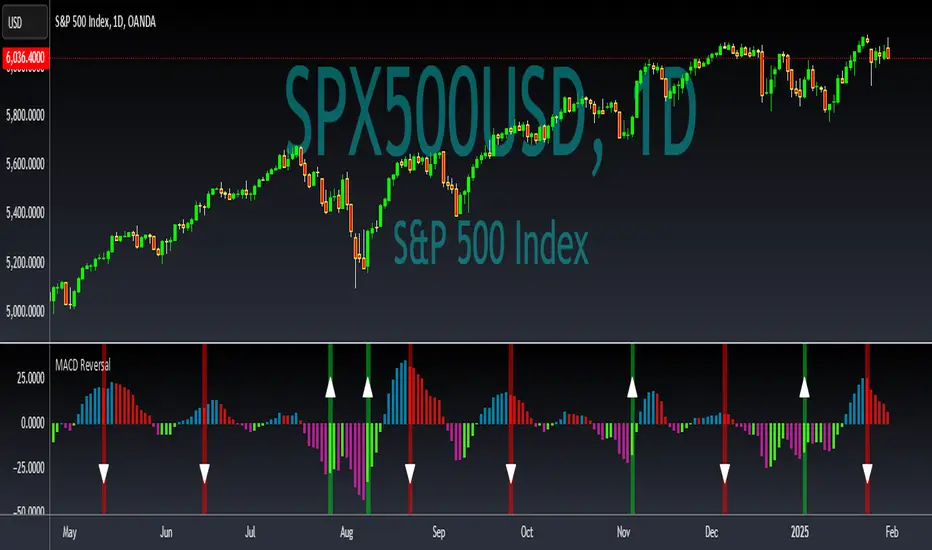
Early MACD Reversal IndicatorThis indicator should provide early warnings of potential price reversal based on the difference between the MACD and its signal line. The keys of the reversal come from creating a histogram of the difference between the two lines and further monitoring the first indications of breadth decrease. The first change when trending up will paint a red vertical line and downward triangle to indicate potential trend reversal to the low side. The opposite with a green vertical line and upward triangle signals potential upside movement soon.
Enjoy!
RSI & DPO support/resistanceThis indicator combines the Relative Strength Index (RSI) to identify overbought and oversold conditions with the Detrended Price Oscillator (DPO) to highlight support and resistance levels.
Unlike traditional indicators that display these metrics in a separate window, this tool integrates them directly onto the main price chart.
This allows for a more cohesive analysis, enabling traders to easily visualize the relationship between price movements and momentum indicators in one unified view.
How to Use It:
Identify Overbought and Oversold Conditions:
Look for RSI values above 70 to identify overbought conditions, suggesting a potential price reversal or pullback. Conversely, RSI values below 30 indicate oversold conditions, which may signal a potential price bounce or upward movement.
Analyze Support and Resistance Levels:
Observe the DPO lines on the main chart to identify key support and resistance levels. When the price approaches these levels, it can provide insights into potential price reversals or breakouts.
Combine Signals for Trading Decisions:
Use the RSI and DPO signals together to make informed trading decisions. For example, if the RSI indicates an overbought condition while the price is near a resistance level identified by the DPO, it may be a good opportunity to consider selling or taking profits.
Monitor Divergences:
Watch for divergences between the RSI and price movements. If the price is making new highs while the RSI is not, it could indicate weakening momentum and a potential reversal.
Set Alerts:
Consider setting alerts for when the RSI crosses above or below the overbought or oversold thresholds, or when the price approaches significant support or resistance levels indicated by the DPO.
Practice Risk Management:
Always use proper risk management techniques, such as setting stop-loss orders and position sizing, to protect your capital while trading based on these indicators.
By following these steps, traders can effectively utilize this indicator to enhance their market analysis and improve their trading strategies.

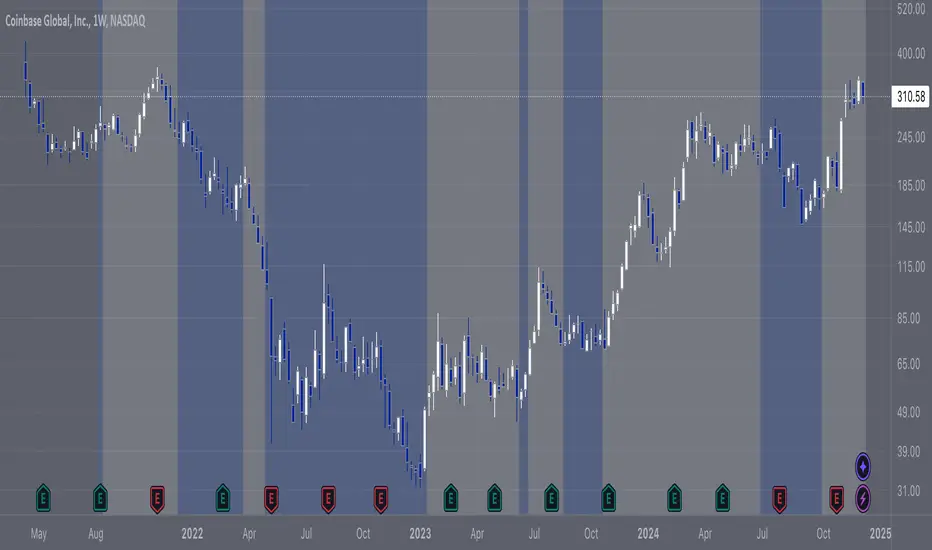
COIN/BTC Trend OscillatorThe COIN/BTC Trend Oscillator is a versatile tool designed to measure and visualize momentum divergences between Coinbase stock ( NASDAQ:COIN ) and Bitcoin ( CRYPTOCAP:BTC ). It helps identify overbought and oversold conditions, while also highlighting potential trend reversals.
Key Features:
VWAP-Based Divergence Analysis:
• Tracks the difference between NASDAQ:COIN and CRYPTOCAP:BTC relative to their respective VWAPs.
• Highlights shifts in momentum between the two assets.
Normalized Oscillator:
• Uses ATR normalization to adapt to different volatility conditions.
• Displays momentum shifts on a standardized scale for better comparability.
Overbought and Oversold Conditions:
• Identifies extremes using customizable thresholds (default: ±80).
• Dynamic background colors for quick visual identification:
• Blue for overbought zones (potential sell).
• White for oversold zones (potential buy).
Rolling Highs and Lows Detection:
• Tracks turning points in the oscillator to identify possible trend reversals.
• Useful for spotting exhaustion or accumulation phases.
Use Case:
This indicator is ideal for trading Coinbase stock relative to Bitcoin’s momentum. It’s especially useful during strong market trends, helping traders time entries and exits based on extremes in relative performance.
Limitations:
• Performance may degrade in choppy or sideways markets.
• Assumes a strong correlation between NASDAQ:COIN and CRYPTOCAP:BTC , which may not hold during independent events.
Pro Tip: Use this oscillator with broader trend confirmation tools like moving averages or RSI to improve reliability. For macro strategies, consider combining with higher timeframes for alignment.
DIVERGENCE SPOT X P.FUTURES (INVERTED VERSION) [GUSLM]Many asked me to change the positive position x negative(of "DIVERGENCE SPOT X P.FUTURES"). being maybe no intuitive for some coins and situations....
So, Now on this version you are going to have UP moves for Upwards from derivatives ( p. Futures with Higher prices than Spot prices), and Dowwards for Negative Futures derivatives. ( it will match the future funding rates probably)
The "pushs" now are in the oposite direction.
Look at the DIVERGENCE SPOT X P.FUTURES script for a better view about it.
For instance:
This version is better for normal coin and market - where the derivatives go in the direction of the price and the coin will have a positive FR(funding) when going up, and maybe sometimes negatives when going down.
The First non inverted version: is better for manipulated coins, where you have pushs and pulls, to try to build a negative funding while hold longs positions. it will go up with negative FR. - Shorters paying the longs and being liquidated in the way..
But you can chose one and adaptd to use only one fot both situations, only need to take a look on the market and define whats going on with the books and prices moves.

Pulse DPO: Major Cycle Tops and Bottoms█ OVERVIEW
Pulse DPO is an oscillator designed to highlight Major Cycle Tops and Bottoms .
It works on any market driven by cycles. It operates by removing the short-term noise from the price action and focuses on the market's cyclical nature.
This indicator uses a Normalized version of the Detrended Price Oscillator (DPO) on a 0-100 scale, making it easier to identify major tops and bottoms.
Credit: The DPO was first developed by William Blau in 1991.
█ HOW TO READ IT
Pulse DPO oscillates in the range between 0 and 100. A value in the upper section signals an OverBought (OB) condition, while a value in the lower section signals an OverSold (OS) condition.
Generally, the triggering of OB and OS conditions don't necessarily translate into swing tops and bottoms, but rather suggest caution on approaching a market that might be overextended.
Nevertheless, this indicator has been customized to trigger the signal only during remarkable top and bottom events.
I suggest using it on the Daily Time Frame , but you're free to experiment with this indicator on other time frames.
The indicator has Built-in Alerts to signal the crossing of the Thresholds. Please don't act on an isolated signal, but rather integrate it to work in conjunction with the indicators present in your Trading Plan.
█ OB SIGNAL ON: ENTERING OVERBOUGHT CONDITION
When Pulse DPO crosses Above the Top Threshold it Triggers ON the OB signal. At this point the oscillator line shifts to OB color.
When Pulse DPO enters the OB Zone, please beware! In this Area the Major Players usually become Active Sellers to the Public. While the OB signal is On, it might be wise to Consider Selling a portion or the whole Long Position.
Please note that even though this indicator aims to focus on major tops and bottoms, a strong trending market might trigger the OB signal and stay with it for a long time. That's especially true on young markets and on bubble-mode markets.
█ OB SIGNAL OFF: EXITING OVERBOUGHT CONDITION
When Pulse DPO crosses Below the Top Threshold it Triggers OFF the OB signal. At this point the oscillator line shifts to its normal color.
When Pulse DPO exits the OB Zone, please beware because a Major Top might just have occurred. In this Area the Major Players usually become Aggressive Sellers. They might wind up any remaining Long Positions and Open new Short Positions.
This might be a good area to Open Shorts or to Close/Reverse any remaining Long Position. Whatever you choose to do, it's usually best to act quickly because the market is prone to enter into panic mode.
█ OS SIGNAL ON: ENTERING OVERSOLD CONDITION
When Pulse DPO crosses Below the Bottom Threshold it Triggers ON the OS signal. At this point the oscillator line shifts to OS color.
When Pulse DPO enters the OS Zone, please beware because in this Area the Major Players usually become Active Buyers accumulating Long Positions from the desperate Public.
While the OS signal is On, it might be wise to Consider becoming a Buyer or to implement a Dollar-Cost Averaging (DCA) Strategy to build a Long Position towards the next Cycle. In contrast to the tops, the OS state usually takes longer to resolve a major bottom.
█ OS SIGNAL OFF: EXITING OVERSOLD CONDITION
When Pulse DPO crosses Above the Bottom Threshold it Triggers OFF the OS signal. At this point the oscillator line shifts to its normal color.
When Pulse DPO exits the OS Zone, please beware because a Major Bottom might already be in place. In this Area the Major Players become Aggresive Buyers. They might wind up any remaining Short Positions and Open new Long Positions.
This might be a good area to Open Longs or to Close/Reverse any remaining Short Positions.
█ WHY WOULD YOU BE INTERESTED IN THIS INDICATOR?
This indicator is built over a solid foundation capable of signaling Major Cycle Tops and Bottoms across many markets. Let's see some examples:
Early Bitcoin Years: From 0 to 1242
This chart is in logarithmic mode in order to properly display various exponential cycles. Pulse DPO is properly signaling the major early highs from 9-Jun-2011 at 31.50, to the next one on 9-Apr-2013 at 240 and the epic top from 29-Nov-2013 at 1242.
Due to the massive price movements, the OB condition stays pinned during most of the exponential price action. But as you can see, the OB condition quickly vanishes once the Cycle Top has been reached. As the market matures, the OB condition becomes more exceptional and triggers much closer from the Cycle Top.
With regards to Cycle Bottoms, the early bottom of 2 after having peaked at 31.50 doesn’t get captured by the indicator. That is the only cycle bottom that escapes the Pulse DPO when the bottom threshold is set at a value of 5. In that event, the oscillator low reached 6.95.
Bitcoin Adoption Spreading: From 257 to 73k
This chart is in logarithmic mode in order to properly display various exponential cycles. Pulse DPO is properly signaling all the major highs from 17-Dec-2017 at 19k, to the next one on 14-Apr-2021 at 64k and the most recent top from 9-Nov-2021 at 68k.
During the massive run of 2017, the OB condition still stayed triggered for a few weeks on each swing top. But on the next cycles it started to signal only for a few days before each swing top actually happened. The OB condition during the last cycle top triggered only for 3 days. Therefore the signal grows in focus as the market matures.
At the time of publishing this indicator, Bitcoin printed a new All Time High (ATH) on 13-Mar-2024 at 73k. That run didn’t trigger the OB condition. Therefore, if the indicator is correct the Bitcoin market still has some way to grow during the next months.
With regards to Cycle Bottoms, the bottom of 3k after having peaked at19k got captured within the wide OS zone. The bottom of 15k after having peaked at 68k got captured too within the OS accumulation area.
Gold
Pulse DPO behaves surprisingly well on a long standing market such as Gold. Moving back to the 197x years it’s been signaling most Cycle Tops and Bottoms with precision. During the last cycle, it shows topping at 2k and bottoming at 1.6k.
The current price action is signaling OB condition in the range of 2.5k to 2.7k. Looking at past cycles, it tends to trigger on and off at multiple swing tops until reaching the final cycle top. Therefore this might indicate the first wave within a potential gold run.
Oil
On the Oil market, we can see that most of the cycle tops and bottoms since the 80s got signaled. The only exception being the low from 2020 which didn’t trigger.
EURUSD
On Forex markets the Pulse DPO also behaves as expected. Looking back at EURUSD we can see the marketing triggering OB and OS conditions during major cycle tops and bottoms from recent times until the 80s.
S&P 500
On the S&P 500 the Pulse DPO catched the lows from 2016 and 2020. Looking at present price action, the recent ATH didn’t trigger the OB condition. Therefore, the indicator is allowing room for another leg up during the next months.
Amazon
On the Amazon chart the Pulse DPO is mirroring pretty accurately the major swings. Scrolling back to the early 2000s, this chart resembles early exponential swings in the crypto space.
Tesla
Moving onto a younger tech stock, Pulse DPO captures pretty accurately the major tops and bottoms. The chart is shown in logarithmic scale to better display the magnitude of the moves.
█ SETTINGS
This indicator is ideal for identifying major market turning points while filtering out short-term noise. You are free to adjust the parameters to align with your preferred trading style.
Parameters : This section allows you to customize any of the Parameters that shape the Oscillator.
Oscillator Length: Defines the period for calculating the Oscillator.
Offset: Shifts the oscillator calculation by a certain number of periods, which is typically half the Oscillator Length.
Lookback Period: Specifies how many bars to look back to find tops and bottoms for normalization.
Smoothing Length: Determines the length of the moving average used to smooth the oscillator.
Thresholds : This section allows you to customize the Thresholds that trigger the OB and OS conditions.
Top: Defines the value of the Top Threshold.
Bottom: Defines the value of the Bottom Threshold.

Gabriel's Cyclic Smoothed RSI [Enhanced]Overview
Gabriel's Cyclic Smoothed RSI (short title: cRSI ) is a sophisticated technical indicator developed to provide traders with deeper insights into market rhythms and price momentum. Building upon the traditional Relative Strength Index (RSI), this enhanced version incorporates dynamic cycle analysis, divergence detection, and optional stochastic oscillators to deliver a more nuanced understanding of market conditions.
Key Features
Cyclic Smoothed RSI (cRSI):
Adaptive Momentum: The cRSI adapts to the dominant market cycle, providing a smoothed RSI that reacts dynamically to price changes.
Ultra-Smooth & Zero-Lag: Designed to minimize lag, ensuring timely signals that closely follow price movements.
Accurate Divergence Detection: Identifies both regular and hidden bullish/bearish divergences, enhancing signal reliability.
Dynamic Overbought/Oversold Bands:
Customizable Thresholds: Set dynamic overbought and oversold levels based on market rhythm analysis.
Adaptive Bands: Bands adjust according to the dominant cycle, offering a more accurate representation of market extremes.
Stochastic cRSI & KDJ Oscillator (Optional):
Enhanced Oscillators: Incorporate stochastic and KDJ oscillators for additional momentum analysis.
Ribbon Displays: Visual ribbons provide clarity on oscillator trends and potential reversal points.
Divergence Detection:
Regular & Hidden Divergences: Detects both regular and hidden bullish/bearish divergences to anticipate potential trend reversals.
Customizable Lookback: Adjust pivot lookback periods to fine-tune divergence sensitivity.
Visual Enhancements:
Triangles & Labels: Visual signals in the form of triangles and labels indicate buy/sell opportunities and divergence events.
Bar Coloring: Option to color bars based on signal strength, providing immediate visual cues.
Alert Conditions:
Custom Alerts: Set up alerts for various signal types, including strong buy/sell signals and divergence events, ensuring you never miss critical market movements.
Input Settings
cRSI Settings
Source: Select the data source for calculations (e.g., Close, Open, High, Low, HLC3, OHLC4).
Dominant Cycle Length: Define the dominant market cycle length based on rhythm analysis.
Vibration: Adjusts the sensitivity of the cRSI to price changes.
Leveling %: Determines the percentage level for dynamic band adjustments.
Show cRSI Plot: Toggle the display of the cRSI line.
Show Cyclic Smoothed Bands: Toggle the display of dynamic overbought and oversold bands.
Show Trend Fill: Enable or disable the trend fill cloud between upper and lower bands.
MA Settings
MA Type: Choose the type of Moving Average (SMA, Bollinger Bands, EMA, SMMA (RMA), WMA, VWMA) to smooth the cRSI.
MA Length: Set the length of the Moving Average.
BB StdDev: Define the standard deviation multiplier for Bollinger Bands.
Show cRSI-based MA: Toggle the display of the cRSI-based Moving Average line.
Stochastic Settings
Show Stochastic cRSI: Enable the stochastic oscillator based on cRSI.
Ribbon: Enable ribbon display for the Stochastic oscillator.
Show KDJ: Toggle the display of the KDJ oscillator.
KDJ Ribbon: Enable ribbon display for the KDJ oscillator.
Stochastic Length: Set the length for the Stochastic calculation.
%K Smoothing: Define the smoothing period for %K.
%D Smoothing: Define the smoothing period for %D.
Stoch Scaling %: Adjusts the vertical scaling of the stochastic to prevent distortion.
Overbought/Oversold Settings
Overbought: Set the Overbought threshold for the cRSI.
OB Extreme: Define the Extreme Overbought threshold for the Stochastic cRSI.
Oversold: Set the Oversold threshold for the cRSI.
OS Extreme: Define the Extreme Oversold threshold for the Stochastic cRSI.
Divergence Settings
Pivot Lookback Right: Number of bars to the right of the pivot for divergence detection.
Pivot Lookback Left: Number of bars to the left of the pivot for divergence detection.
Max of Lookback Range: Maximum number of bars to look back for divergence detection.
Min of Lookback Range: Minimum number of bars to look back for divergence detection.
Plot Bullish: Enable plotting of bullish divergence signals.
Plot Hidden Bullish: Enable plotting of hidden bullish divergence signals.
Plot Bearish: Enable plotting of bearish divergence signals.
Plot Hidden Bearish: Enable plotting of hidden bearish divergence signals.
Delay Plot Until Candle is Closed: Prevents repainting by delaying the plotting of divergence signals until the candle is fully closed.

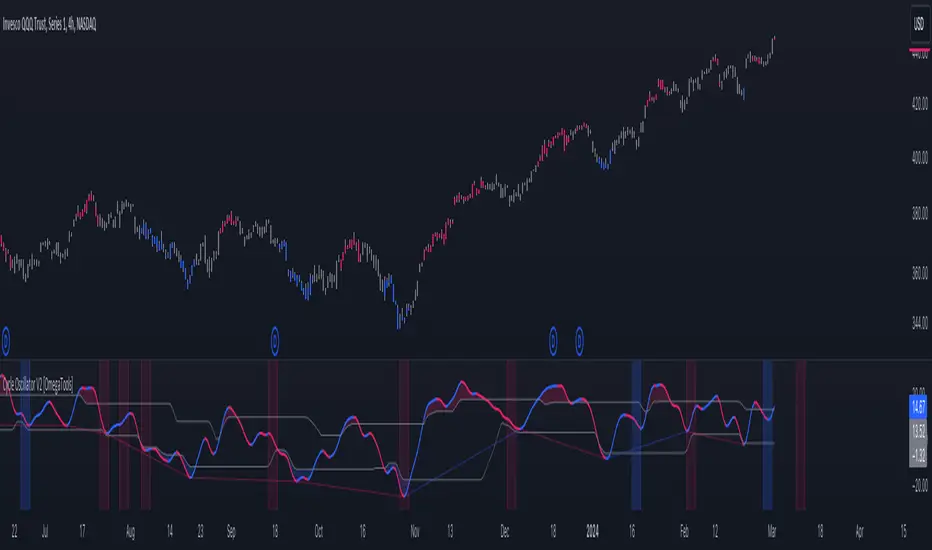
Cycle Oscillator V2 [OmegaTools]Introducing the "Cycle Oscillator" by OmegaTools, an innovative addition to your TradingView analysis toolkit. This script is designed to offer a unique approach to understanding market cycles without the need for volume data, making it versatile across various market conditions and asset classes.
Key Features:
- Cycle Length Customization: Tailor the cycle length from 10 to 200 bars to fit the specific rhythm of the market you're analyzing, ensuring relevance and precision.
- Smoothness Adjustment: Fine-tune the oscillator's smoothness to capture the essence of market movements with options ranging from 1 to 20.
- Aesthetic Flexibility: Choose your preferred colors for the oscillator's upward and downward movements, personalizing your chart to your liking.
- Historical Mode: Toggle the historical mode to either focus on real-time analysis or review past cycle data for backtesting and study.
- Candle Color Modes: Enhance your visual analysis with optional candle coloring based on trend, signals, or extensions, providing immediate insight into market conditions.
Usage Guide:
1. Setting Up: Easily adjust the cycle length and smoothness to match the market's current volatility and your trading style.
2. Understanding Market Cycles: The oscillator plots the average deviation from three distinct moving averages, offering a clear view of potential market turns or continuations.
3. Identifying Overbought/Oversold Conditions: Utilize the upper and lower bounds to recognize extreme market conditions, guiding your entry and exit decisions.
4. Visual Enhancements: Customize the visual aspects, including colors and candle coloring, to make your analysis both effective and aesthetically pleasing.
5. Anticipating Market Movements: The script provides forward-looking lines to suggest potential future highs or lows, aiding in predictive analysis.
Designed with both novice and experienced traders in mind, the "Cycle Oscillator" is a testament to OmegaTools' commitment to providing high-quality, innovative trading tools. Whether you're looking to refine your trading strategy or seeking new analytical perspectives, this script offers a comprehensive solution to navigating the ebbs and flows of the financial markets.
Join the community of traders enhancing their TradingView experience with the "Cycle Oscillator" by OmegaTools. Start exploring deeper market insights and unlock new trading opportunities today.
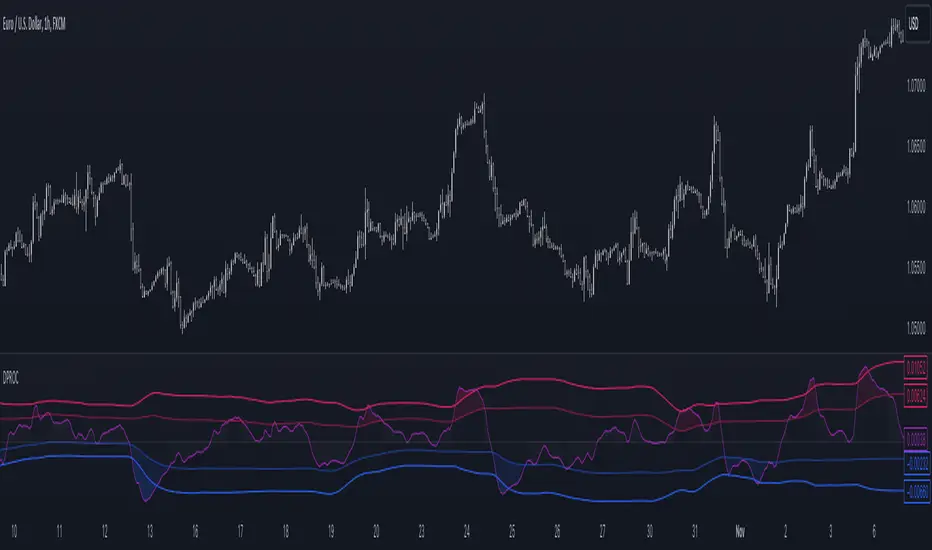
Detrended Price Rate of ChangeThe Detrended Price Rate of Change is an oscillator developed to help traders identify potential conditions of overbought and oversold markets.
The formula of the oscillator includes both the Detrended price formula, useful to spot divergences, and the Rate of change simplified formula, which helps in identifying overextended markets and gives useful information on price momentum.
GKD-C Detrended Price Oscillator [Loxx]Giga Kaleidoscope GKD-C Detrended Price Oscillator is a Metamorphosis module included in Loxx's "Giga Kaleidoscope Modularized Trading System".
█ GKD-C Detrended Price Oscillator
The Detrended Price Oscillator (DPO) is a technical analysis tool used by traders and analysts to identify cycles and trends in price movements. It aims to remove the long-term trend from the price data and focus on shorter-term cycles.
The DPO calculates the difference between a chosen period's closing price and the historical moving average of that price. The moving average used is typically a simple moving average (SMA) or an exponential moving average (EMA). The resulting values represent the deviation from the long-term trend.
To calculate the DPO, follow these steps:
1. Determine the desired period for analysis (e.g., 20 days).
2. Calculate the center point of this period by taking (period length / 2) + 1 (e.g., (20 / 2) + 1 = 11).
3. Calculate the simple moving average (SMA) of the price over the chosen period.
4. Shift the moving average backward by the center point calculated in step 2. This creates a displaced moving average.
5. Subtract the displaced moving average from the price at the corresponding period to obtain the DPO value.
The resulting DPO values oscillate above and below the zero line. Traders often use the DPO to identify cycles, overbought or oversold conditions, and potential reversal points. When the DPO crosses above the zero line, it suggests that the price may be in an uptrend, while crossing below indicates a potential downtrend.
█ Giga Kaleidoscope Modularized Trading System
Core components of an NNFX algorithmic trading strategy
The NNFX algorithm is built on the principles of trend, momentum, and volatility. There are six core components in the NNFX trading algorithm:
1. Volatility - price volatility; e.g., Average True Range, True Range Double, Close-to-Close, etc.
2. Baseline - a moving average to identify price trend
3. Confirmation 1 - a technical indicator used to identify trends
4. Confirmation 2 - a technical indicator used to identify trends
5. Continuation - a technical indicator used to identify trends
6. Volatility/Volume - a technical indicator used to identify volatility/volume breakouts/breakdown
7. Exit - a technical indicator used to determine when a trend is exhausted
8. Metamorphosis - a technical indicator that produces a compound signal from the combination of other GKD indicators*
*(not part of the NNFX algorithm)
What is Volatility in the NNFX trading system?
In the NNFX (No Nonsense Forex) trading system, ATR (Average True Range) is typically used to measure the volatility of an asset. It is used as a part of the system to help determine the appropriate stop loss and take profit levels for a trade. ATR is calculated by taking the average of the true range values over a specified period.
True range is calculated as the maximum of the following values:
-Current high minus the current low
-Absolute value of the current high minus the previous close
-Absolute value of the current low minus the previous close
ATR is a dynamic indicator that changes with changes in volatility. As volatility increases, the value of ATR increases, and as volatility decreases, the value of ATR decreases. By using ATR in NNFX system, traders can adjust their stop loss and take profit levels according to the volatility of the asset being traded. This helps to ensure that the trade is given enough room to move, while also minimizing potential losses.
Other types of volatility include True Range Double (TRD), Close-to-Close, and Garman-Klass
What is a Baseline indicator?
The baseline is essentially a moving average, and is used to determine the overall direction of the market.
The baseline in the NNFX system is used to filter out trades that are not in line with the long-term trend of the market. The baseline is plotted on the chart along with other indicators, such as the Moving Average (MA), the Relative Strength Index (RSI), and the Average True Range (ATR).
Trades are only taken when the price is in the same direction as the baseline. For example, if the baseline is sloping upwards, only long trades are taken, and if the baseline is sloping downwards, only short trades are taken. This approach helps to ensure that trades are in line with the overall trend of the market, and reduces the risk of entering trades that are likely to fail.
By using a baseline in the NNFX system, traders can have a clear reference point for determining the overall trend of the market, and can make more informed trading decisions. The baseline helps to filter out noise and false signals, and ensures that trades are taken in the direction of the long-term trend.
What is a Confirmation indicator?
Confirmation indicators are technical indicators that are used to confirm the signals generated by primary indicators. Primary indicators are the core indicators used in the NNFX system, such as the Average True Range (ATR), the Moving Average (MA), and the Relative Strength Index (RSI).
The purpose of the confirmation indicators is to reduce false signals and improve the accuracy of the trading system. They are designed to confirm the signals generated by the primary indicators by providing additional information about the strength and direction of the trend.
Some examples of confirmation indicators that may be used in the NNFX system include the Bollinger Bands, the MACD (Moving Average Convergence Divergence), and the MACD Oscillator. These indicators can provide information about the volatility, momentum, and trend strength of the market, and can be used to confirm the signals generated by the primary indicators.
In the NNFX system, confirmation indicators are used in combination with primary indicators and other filters to create a trading system that is robust and reliable. By using multiple indicators to confirm trading signals, the system aims to reduce the risk of false signals and improve the overall profitability of the trades.
What is a Continuation indicator?
In the NNFX (No Nonsense Forex) trading system, a continuation indicator is a technical indicator that is used to confirm a current trend and predict that the trend is likely to continue in the same direction. A continuation indicator is typically used in conjunction with other indicators in the system, such as a baseline indicator, to provide a comprehensive trading strategy.
What is a Volatility/Volume indicator?
Volume indicators, such as the On Balance Volume (OBV), the Chaikin Money Flow (CMF), or the Volume Price Trend (VPT), are used to measure the amount of buying and selling activity in a market. They are based on the trading volume of the market, and can provide information about the strength of the trend. In the NNFX system, volume indicators are used to confirm trading signals generated by the Moving Average and the Relative Strength Index. Volatility indicators include Average Direction Index, Waddah Attar, and Volatility Ratio. In the NNFX trading system, volatility is a proxy for volume and vice versa.
By using volume indicators as confirmation tools, the NNFX trading system aims to reduce the risk of false signals and improve the overall profitability of trades. These indicators can provide additional information about the market that is not captured by the primary indicators, and can help traders to make more informed trading decisions. In addition, volume indicators can be used to identify potential changes in market trends and to confirm the strength of price movements.
What is an Exit indicator?
The exit indicator is used in conjunction with other indicators in the system, such as the Moving Average (MA), the Relative Strength Index (RSI), and the Average True Range (ATR), to provide a comprehensive trading strategy.
The exit indicator in the NNFX system can be any technical indicator that is deemed effective at identifying optimal exit points. Examples of exit indicators that are commonly used include the Parabolic SAR, the Average Directional Index (ADX), and the Chandelier Exit.
The purpose of the exit indicator is to identify when a trend is likely to reverse or when the market conditions have changed, signaling the need to exit a trade. By using an exit indicator, traders can manage their risk and prevent significant losses.
In the NNFX system, the exit indicator is used in conjunction with a stop loss and a take profit order to maximize profits and minimize losses. The stop loss order is used to limit the amount of loss that can be incurred if the trade goes against the trader, while the take profit order is used to lock in profits when the trade is moving in the trader's favor.
Overall, the use of an exit indicator in the NNFX trading system is an important component of a comprehensive trading strategy. It allows traders to manage their risk effectively and improve the profitability of their trades by exiting at the right time.
What is an Metamorphosis indicator?
The concept of a metamorphosis indicator involves the integration of two or more GKD indicators to generate a compound signal. This is achieved by evaluating the accuracy of each indicator and selecting the signal from the indicator with the highest accuracy. As an illustration, let's consider a scenario where we calculate the accuracy of 10 indicators and choose the signal from the indicator that demonstrates the highest accuracy.
The resulting output from the metamorphosis indicator can then be utilized in a GKD-BT backtest by occupying a slot that aligns with the purpose of the metamorphosis indicator. The slot can be a GKD-B, GKD-C, or GKD-E slot, depending on the specific requirements and objectives of the indicator. This allows for seamless integration and utilization of the compound signal within the GKD-BT framework.
How does Loxx's GKD (Giga Kaleidoscope Modularized Trading System) implement the NNFX algorithm outlined above?
Loxx's GKD v2.0 system has five types of modules (indicators/strategies). These modules are:
1. GKD-BT - Backtesting module (Volatility, Number 1 in the NNFX algorithm)
2. GKD-B - Baseline module (Baseline and Volatility/Volume, Numbers 1 and 2 in the NNFX algorithm)
3. GKD-C - Confirmation 1/2 and Continuation module (Confirmation 1/2 and Continuation, Numbers 3, 4, and 5 in the NNFX algorithm)
4. GKD-V - Volatility/Volume module (Confirmation 1/2, Number 6 in the NNFX algorithm)
5. GKD-E - Exit module (Exit, Number 7 in the NNFX algorithm)
6. GKD-M - Metamorphosis module (Metamorphosis, Number 8 in the NNFX algorithm, but not part of the NNFX algorithm)
(additional module types will added in future releases)
Each module interacts with every module by passing data to A backtest module wherein the various components of the GKD system are combined to create a trading signal.
That is, the Baseline indicator passes its data to Volatility/Volume. The Volatility/Volume indicator passes its values to the Confirmation 1 indicator. The Confirmation 1 indicator passes its values to the Confirmation 2 indicator. The Confirmation 2 indicator passes its values to the Continuation indicator. The Continuation indicator passes its values to the Exit indicator, and finally, the Exit indicator passes its values to the Backtest strategy.
This chaining of indicators requires that each module conform to Loxx's GKD protocol, therefore allowing for the testing of every possible combination of technical indicators that make up the six components of the NNFX algorithm.
What does the application of the GKD trading system look like?
Example trading system:
Backtest: Full GKD Backtest
Baseline: Hull Moving Average
Volatility/Volume: Hurst Exponent
Confirmation 1: Detrended Price Oscillator as shown in the chart above
Confirmation 2: uf2018
Continuation: Vortex
Exit: Rex Oscillator
Metamorphosis: Fisher Transform, Universal Oscillator, Aroon, Vortex .. combined
Each GKD indicator is denoted with a module identifier of either: GKD-BT, GKD-B, GKD-C, GKD-V, GKD-M, or GKD-E. This allows traders to understand to which module each indicator belongs and where each indicator fits into the GKD system.
█ Giga Kaleidoscope Modularized Trading System Signals
Standard Entry
1. GKD-C Confirmation gives signal
2. Baseline agrees
3. Price inside Goldie Locks Zone Minimum
4. Price inside Goldie Locks Zone Maximum
5. Confirmation 2 agrees
6. Volatility/Volume agrees
1-Candle Standard Entry
1a. GKD-C Confirmation gives signal
2a. Baseline agrees
3a. Price inside Goldie Locks Zone Minimum
4a. Price inside Goldie Locks Zone Maximum
Next Candle
1b. Price retraced
2b. Baseline agrees
3b. Confirmation 1 agrees
4b. Confirmation 2 agrees
5b. Volatility/Volume agrees
Baseline Entry
1. GKD-B Basline gives signal
2. Confirmation 1 agrees
3. Price inside Goldie Locks Zone Minimum
4. Price inside Goldie Locks Zone Maximum
5. Confirmation 2 agrees
6. Volatility/Volume agrees
7. Confirmation 1 signal was less than 'Maximum Allowable PSBC Bars Back' prior
1-Candle Baseline Entry
1a. GKD-B Baseline gives signal
2a. Confirmation 1 agrees
3a. Price inside Goldie Locks Zone Minimum
4a. Price inside Goldie Locks Zone Maximum
5a. Confirmation 1 signal was less than 'Maximum Allowable PSBC Bars Back' prior
Next Candle
1b. Price retraced
2b. Baseline agrees
3b. Confirmation 1 agrees
4b. Confirmation 2 agrees
5b. Volatility/Volume agrees
Volatility/Volume Entry
1. GKD-V Volatility/Volume gives signal
2. Confirmation 1 agrees
3. Price inside Goldie Locks Zone Minimum
4. Price inside Goldie Locks Zone Maximum
5. Confirmation 2 agrees
6. Baseline agrees
7. Confirmation 1 signal was less than 7 candles prior
1-Candle Volatility/Volume Entry
1a. GKD-V Volatility/Volume gives signal
2a. Confirmation 1 agrees
3a. Price inside Goldie Locks Zone Minimum
4a. Price inside Goldie Locks Zone Maximum
5a. Confirmation 1 signal was less than 'Maximum Allowable PSVVC Bars Back' prior
Next Candle
1b. Price retraced
2b. Volatility/Volume agrees
3b. Confirmation 1 agrees
4b. Confirmation 2 agrees
5b. Baseline agrees
Confirmation 2 Entry
1. GKD-C Confirmation 2 gives signal
2. Confirmation 1 agrees
3. Price inside Goldie Locks Zone Minimum
4. Price inside Goldie Locks Zone Maximum
5. Volatility/Volume agrees
6. Baseline agrees
7. Confirmation 1 signal was less than 7 candles prior
1-Candle Confirmation 2 Entry
1a. GKD-C Confirmation 2 gives signal
2a. Confirmation 1 agrees
3a. Price inside Goldie Locks Zone Minimum
4a. Price inside Goldie Locks Zone Maximum
5a. Confirmation 1 signal was less than 'Maximum Allowable PSC2C Bars Back' prior
Next Candle
1b. Price retraced
2b. Confirmation 2 agrees
3b. Confirmation 1 agrees
4b. Volatility/Volume agrees
5b. Baseline agrees
PullBack Entry
1a. GKD-B Baseline gives signal
2a. Confirmation 1 agrees
3a. Price is beyond 1.0x Volatility of Baseline
Next Candle
1b. Price inside Goldie Locks Zone Minimum
2b. Price inside Goldie Locks Zone Maximum
3b. Confirmation 1 agrees
4b. Confirmation 2 agrees
5b. Volatility/Volume agrees
Continuation Entry
1. Standard Entry, 1-Candle Standard Entry, Baseline Entry, 1-Candle Baseline Entry, Volatility/Volume Entry, 1-Candle Volatility/Volume Entry, Confirmation 2 Entry, 1-Candle Confirmation 2 Entry, or Pullback entry triggered previously
2. Baseline hasn't crossed since entry signal trigger
4. Confirmation 1 agrees
5. Baseline agrees
6. Confirmation 2 agrees
█ Connecting to Backtests
All GKD indicators are chained indicators meaning you export the value of the indicators to specialized backtest to creat your GKD trading system. Each indicator contains a proprietary signal generation algo that will only work with GKD backtests. You can find these backtests using the links below.
GKD-BT Giga Confirmation Stack Backtest:
GKD-BT Giga Stacks Backtest:
GKD-BT Full Giga Kaleidoscope Backtest:
GKD-BT Solo Confirmation Super Complex Backtest:
GKD-BT Solo Confirmation Complex Backtest:
GKD-BT Solo Confirmation Simple Backtest:

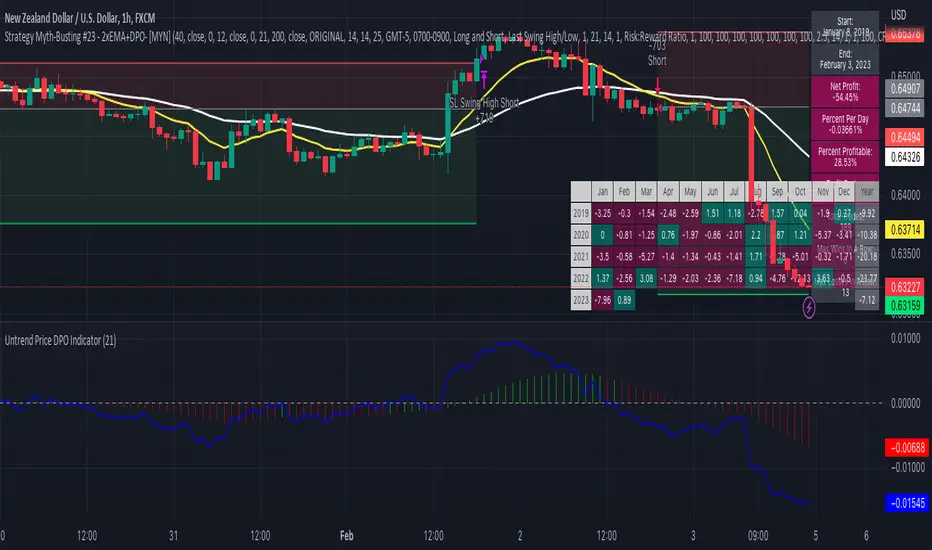
Strategy Myth-Busting #23 - 2xEMA+DPO- [MYN]#23 on the Myth-Busting bench, we are automating the "Best Funded Account Trading Strategy (Pass EVERY Challenge!)" strategy from "Trade with Pat" who claims this strategy will pass every trading challenge out there.
This strategy uses 3 open source indicators. 2 EMA's. The first one (Slow) is set to a length of 40 and a fast EMA which is set to 12. This strategy uses the crossover of the fast( 12) EMA over the Slow EMA ( 40 ) as the primary means to enter a long position. The opposite when the fast EMA crosses under the slow EMA as a means to indicate a short position. This strategy uses the DPO (Detrended Price Oscillaor) from the Uptrend Price DPO indicator in the same way we would traditionally use a stochastic or moving average convergence/divergence indicator like the MACD . Basically, the DPO helps evaluate and estimate the length of the price cycle from peak to peek or through to trough and in this strategy confirms entry of a long / short condition complimenting the EMA crossover/crossunders.
And as always, If you know of or have a strategy you want to see myth-busted or just have an idea for one, please feel free to message me.
This strategy uses a combination of 2 open-source public indicators:
EMA x2 ( 40 and 12)
Untrend Price DPO indicator by jTradeuh
Trading Rules
1 or 4 hour candles
Stop loss at previous highest-high (Short) and lowest-low (Long).
Take Profit 2 - 2.5 the risk
Strategy Template includes open source code from the following:
Performance Summary Dashboard by @VertMT
Time Of Day Window by @ddctv
Monthly Table Performance Dashboard by @QuantNomad
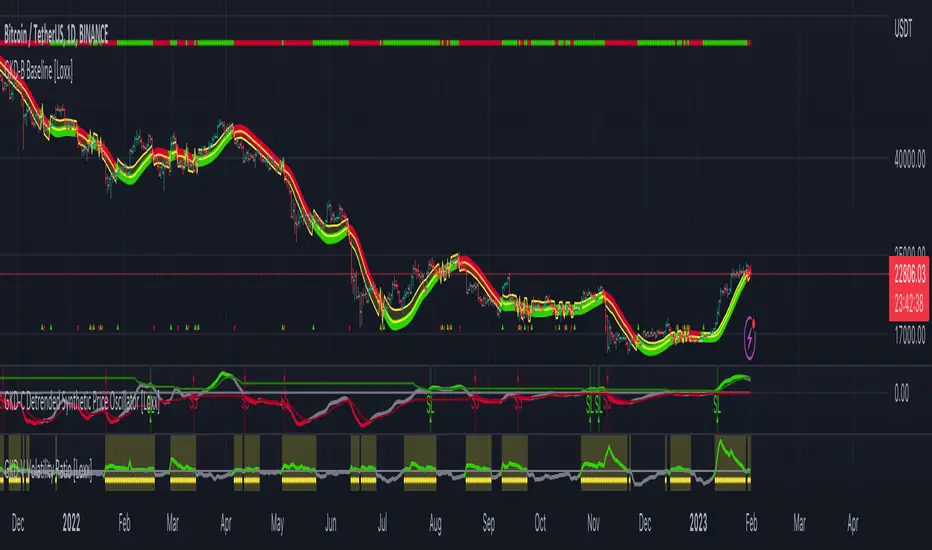
GKD-C Detrended Synthetic Price Oscillator [Loxx]Giga Kaleidoscope Detrended Synthetic Price Oscillator is a Confirmation module included in Loxx's "Giga Kaleidoscope Modularized Trading System".
█ Giga Kaleidoscope Modularized Trading System
What is Loxx's "Giga Kaleidoscope Modularized Trading System"?
The Giga Kaleidoscope Modularized Trading System is a trading system built on the philosophy of the NNFX (No Nonsense Forex) algorithmic trading.
What is an NNFX algorithmic trading strategy?
The NNFX algorithm is built on the principles of trend, momentum, and volatility. There are six core components in the NNFX trading algorithm:
1. Volatility - price volatility; e.g., Average True Range, True Range Double, Close-to-Close, etc.
2. Baseline - a moving average to identify price trend
3. Confirmation 1 - a technical indicator used to identify trends
4. Confirmation 2 - a technical indicator used to identify trends
5. Continuation - a technical indicator used to identify trends
6. Volatility/Volume - a technical indicator used to identify volatility/volume breakouts/breakdown
7. Exit - a technical indicator used to determine when a trend is exhausted
How does Loxx's GKD (Giga Kaleidoscope Modularized Trading System) implement the NNFX algorithm outlined above?
Loxx's GKD v1.0 system has five types of modules (indicators/strategies). These modules are:
1. GKD-BT - Backtesting module (Volatility, Number 1 in the NNFX algorithm)
2. GKD-B - Baseline module (Baseline and Volatility/Volume, Numbers 1 and 2 in the NNFX algorithm)
3. GKD-C - Confirmation 1/2 and Continuation module (Confirmation 1/2 and Continuation, Numbers 3, 4, and 5 in the NNFX algorithm)
4. GKD-V - Volatility/Volume module (Confirmation 1/2, Number 6 in the NNFX algorithm)
5. GKD-E - Exit module (Exit, Number 7 in the NNFX algorithm)
(additional module types will added in future releases)
Each module interacts with every module by passing data between modules. Data is passed between each module as described below:
GKD-B => GKD-V => GKD-C(1) => GKD-C(2) => GKD-C(Continuation) => GKD-E => GKD-BT
That is, the Baseline indicator passes its data to Volatility/Volume. The Volatility/Volume indicator passes its values to the Confirmation 1 indicator. The Confirmation 1 indicator passes its values to the Confirmation 2 indicator. The Confirmation 2 indicator passes its values to the Continuation indicator. The Continuation indicator passes its values to the Exit indicator, and finally, the Exit indicator passes its values to the Backtest strategy.
This chaining of indicators requires that each module conform to Loxx's GKD protocol, therefore allowing for the testing of every possible combination of technical indicators that make up the six components of the NNFX algorithm.
What does the application of the GKD trading system look like?
Example trading system:
Backtest: Strategy with 1-3 take profits, trailing stop loss, multiple types of PnL volatility, and 2 backtesting styles
Baseline: Hull Moving Average as shown on the chart above
Volatility/Volume: Volatility Ratio as shown on the chart above
Confirmation 1: Detrended Synthetic Price Oscillator as shown on the chart above
Confirmation 2: Williams Percent Range
Continuation: Fisher Transform
Exit: Rex Oscillator
Each GKD indicator is denoted with a module identifier of either: GKD-BT, GKD-B, GKD-C, GKD-V, or GKD-E. This allows traders to understand to which module each indicator belongs and where each indicator fits into the GKD protocol chain.
Giga Kaleidoscope Modularized Trading System Signals (based on the NNFX algorithm)
Standard Entry
1. GKD-C Confirmation 1 Signal
2. GKD-B Baseline agrees
3. Price is within a range of 0.2x Volatility and 1.0x Volatility of the Goldie Locks Mean
4. GKD-C Confirmation 2 agrees
5. GKD-V Volatility/Volume agrees
Baseline Entry
1. GKD-B Baseline signal
2. GKD-C Confirmation 1 agrees
3. Price is within a range of 0.2x Volatility and 1.0x Volatility of the Goldie Locks Mean
4. GKD-C Confirmation 2 agrees
5. GKD-V Volatility/Volume agrees
6. GKD-C Confirmation 1 signal was less than 7 candles prior
Continuation Entry
1. Standard Entry, Baseline Entry, or Pullback; entry triggered previously
2. GKD-B Baseline hasn't crossed since entry signal trigger
3. GKD-C Confirmation Continuation Indicator signals
4. GKD-C Confirmation 1 agrees
5. GKD-B Baseline agrees
6. GKD-C Confirmation 2 agrees
1-Candle Rule Standard Entry
1. GKD-C Confirmation 1 signal
2. GKD-B Baseline agrees
3. Price is within a range of 0.2x Volatility and 1.0x Volatility of the Goldie Locks Mean
Next Candle:
1. Price retraced (Long: close < close or Short: close > close )
2. GKD-B Baseline agrees
3. GKD-C Confirmation 1 agrees
4. GKD-C Confirmation 2 agrees
5. GKD-V Volatility/Volume agrees
1-Candle Rule Baseline Entry
1. GKD-B Baseline signal
2. GKD-C Confirmation 1 agrees
3. Price is within a range of 0.2x Volatility and 1.0x Volatility of the Goldie Locks Mean
4. GKD-C Confirmation 1 signal was less than 7 candles prior
Next Candle:
1. Price retraced (Long: close < close or Short: close > close )
2. GKD-B Baseline agrees
3. GKD-C Confirmation 1 agrees
4. GKD-C Confirmation 2 agrees
5. GKD-V Volatility/Volume Agrees
PullBack Entry
1. GKD-B Baseline signal
2. GKD-C Confirmation 1 agrees
3. Price is beyond 1.0x Volatility of Baseline
Next Candle:
1. Price is within a range of 0.2x Volatility and 1.0x Volatility of the Goldie Locks Mean
3. GKD-C Confirmation 1 agrees
4. GKD-C Confirmation 2 agrees
5. GKD-V Volatility/Volume Agrees
█ Detrended Synthetic Price Oscillator
What is Detrended Synthetic Price Oscillator?
A detrended price oscillator, used in technical analysis, strips out price trends in an effort to estimate the length of price cycles from peak to peak or trough to trough. Unlike other oscillators, such as the stochastic or moving average convergence divergence (MACD), the DPO is not a momentum indicator. This inclucdes two types of signals: middle cross or levels cross.
Requirements
Inputs
Confirmation 1 and Solo Confirmation: GKD-V Volatility / Volume indicator
Confirmation 2: GKD-C Confirmation indicator
Outputs
Confirmation 2 and Solo Confirmation: GKD-E Exit indicator
Confirmation 1: GKD-C Confirmation indicator
Continuation: GKD-E Exit indicator
Additional features will be added in future releases.
Moving Average DistanceLook at the chart bars as they relate to distance from a specified moving average.
You can pick from SMA/EMA/etc.

Zero Lag Detrended Price Oscillator (ZL DPO)This indicator attempts to create a zero lag Detrended price oscillator using 2 different scripts. I actually really like the results so far. I hope you all find it useful too.
Green>Red = long
Red>Green = short
The lines on the example chart are some of the signals that the indicator gave on default settings.
The greens are wins, reds are outright losses, and blues are "scratch" trades(signal for other side before hitting stop loss).
All of the signals tested were using NNFX money management to see if they are wins or losses(1.5x atr for SL and 1 Atr for TP).

DiNapoli Oscillator Predictor TableThis indicator displays a table containing the Oscillator Predictor Overbought (OB) and Oversold Levels (OS) from Higher Timeframes: a green background denotes a market above OB in that particular timeframe, and a red one denotes an OS market.
It allows displaying current and future Predictor values.
Only Higher Timeframes states do appear in the table. Lower Timeframes are grayed out, due to inability to get reliable results for such behaviour in current Tradingview environment.
The position of the table can be customized through the input panel.
Note: This indicator is quite demanding in terms of resources, and it might take some seconds to fully populate the table.

Supertrend + RSI Strategy [Alose]This strategy combines the best of both indicators (Supertrend & RSI).
As we know, Supertrend is excellent at finding changes in the market trend and thus finding the best entries, however in my opinion it has a great weakness and it is that it does not know how to find the best exit point.
For this reason I decided to combine it with the RSI that we know usually knows the highest and lowest rebound points of the price, thus managing to find the best exit point for the strategy.
The best thing about combining these 2 indicators is that our trades will obtain better profits in less time.
LONG ENTRY
When SuperTrend changes its direction and it is less than 0.
LONG EXIT
There are two ways to close the trade:
When RSI is overbought, you can choose the "Overbought Level " inside the strategy settings (Default: 72).
When SuperTrend changes its direction and it is grater than 0.
SHORT ENTRY (You can enable short entries in strategy settings)
When SuperTrend changes its direction and it is grater than 0.
LONG EXIT
There are two ways to close the trade:
When RSI is oversold, you can choose the "Oversold Level " inside the strategy settings (Default: 28).
When SuperTrend changes its direction and it is less than 0.

MTF DPO-RSI IndicatorThis indicator uses the principle of taking the RSI of DPO readings across multiple time frames in order to provide trade signals and an overarching view of market conditions to the trader. My hope with creating this indicator was to present more divergence based signals than your typical indicator, while still keeping those signals at a high quality.
In the settings menu, you may specify:
Indicator Timeframe - the chart resolution that is used to calculate values.
Source DPO Length - the number of bars used to calculate the Detrended Price Oscillator value. The DPO value is the source for the RSI calculations.
DPO Hull Smoothing - how much smoothing is applied to the DPO . Smoothing is accomplished by taking a Hull Moving Average of the closing price, and using this to calculate the DPO value.
RSI Length - the number of bars used to calculate the RSI of the DPO value.
Time Multipliers 1 through 6 - use this to define what resolution each plot will represent. A value of 1 will represent the current Indicator Timeframe. A value of 3 will represent 3 times the current Indicator Timeframe, etc.
Show Plot 1 through 6 - toggles the display of plots.
How I trade with this indicator:
A value of under 30 represents an over sold state for that particular plot. A value of over 70 represents an overbought state for that plot.
Identify divergences on a lower timeframe plot which are apparent in overbought or oversold conditions, and confirm the signal with an overbought or oversold condition, or a divergence on a higher timeframe plot. Divergences which begin in oversold or overbought territory and end inside the 30-70 range tend to be more reliable signals, in my experience. Like all indicators, this is best when used in conjunction with other indicators. Trend indicators, such as double EMA's and Supertrend are my favorite pairing, and a stochastic RSI is a good tool to have as well.
This is my first published indicator! If you find unique ways to use it, drop me a message. I'd love to know what you find. :)

Buy/Sell RatingIdentifies prices above and below input percentile thresholds over the input length of time. Use to identify buy/sell opportunities relative to recent pricing. Also provides percent of price distance from moving average over the same length.

Detrended Rhythm Oscillator (DRO)How to detect the current "market beat" or market cycle?
A common way to capture the current dominant cycle length is to detrend the price and look for common rhythms in the detrended series. A common approach is to use a Detrended Price Oscillator (DPO). This is done in order to identify and isolate short-term cycles.
A basic DPO description can be found here:
www.tradingview.com
Improvements to the standard DPO
The main purpose of the standard DPO is to analyze historical data in order to observe cycle's in a market's movement. DPO can give the technical analyst a better sense of a cycle's typical high/low range as well as its duration. However, you need to manually try to "see" tops and bottoms on the detrended price and measure manually the distance from low-low or high-high in order to derive a possible cycle length.
Therefore, I added the following improvements:
1) Using a DPO to detrend the price
2) Indicate the turns of the detrended price with a ZigZag lines to better see the tops/bottoms
3) Detrend the ZigZag to remove price amplitude between turns to even better see the cyclic turns ("rhythm")
4) Measure the distance from last detrended zigzag pivot (high-high / low-low) and plot the distance in bars above/below the turn
Now, you can clearly see the rhythm of the dataset indicated by the Detrended Rhythm Oscillator including the exact length between the turns. This makes the procedure to "spot" turns and "measure" distance more simple for the trader.
How to use this information
The purpose is to check if there is a common rhythm or beat in the underlying dataset. To check that, look for recurring pattern in the numbers. E.g. if you often see the same measured distance, you can conclude that there is a major dominant cycle in this market. Also watch for harmonic relations between the numbers. So in the example above you see the highlighted cluster of detected length of around 40,80 and 120. There three numbers all have a harmonic relation to 40.
Once you have this cyclic information, you can use this number to optimize or tune technical indicators based on the current dominant cycle length. E.g. set the length parameter of a technical indicator to the detected harmonic length with the DRO indicator.
Example Use-Case
You can use this information to set the input for the following free public open-source script:
Disclaimer
This is not meant to be a technical indicator on its own and the derived cyclic length should not be used to forecast the next turn per se. The indicator should give you an indication of the current market beat or dominant beats which can be use to further optimize other oscillator or trading related settings.
Options & settings
The indicator allows to plot different versions. It allows to plot the original DPO, the DRO with ZigZag lines, the DRO with detrended ZigZag lines and length labels on/off. You can turn on or off these version in the indicator settings. So you can tweak it visually to your own needs.

+ Detrended Price OscillatorAccording to TradingView the Detrended Price Oscillator is an oscillator that removes trend from price in order to more clearly show an instrument's cyclical
highs and lows so that an investor or trader may more easily time when to buy or sell the underlying instrument. Accordingly, it is not meant to be used as a way of gauging momentum, however, I find it perfectly suitable for the task (at least when used "un-centered" which is how it comes by default here). If you wish to read up more on the DPO just search for it under indicators. It's built in, so you'll find all the information you need on it there. Or check investopedia.
On to the good stuff. What have I done and how does this work?
As un-centered you can use it just like any other momentum oscillator. Price above the zero line is bullish and below is bearish, generally speaking.
I've added two moving averages that you can turn on or off, and choose amongst various types and lengths. Both of these are colored based on trend.
The DPO is also colored based on trend, with a neutral color based on where the DPO is relative to the primary MA and the zero line.
Candles are colored in the same way that the DPO is.
I've added Bollinger Bands because they could be useful on an indicator like this.
All the alert conditions you could dream of.
With this set to centered you will notice that the DPO is not inline with current price. That is intentional, as it's only designed to look at historical price
data to time highs and lows of price movement. As such, I don't recommend using this when set to centered, at least if you're trading crypto. The price volatility
perhaps makes for inconsistent timing of cyclical highs and lows, or perhaps it's the rather brief amount of time cryptocurrencies have been in existence.
I do not know. Just stick to using it un-centered.
The above image shows the indicator with Bollinger Bands turned on and the MA's turned off. Also, you should note that the candle color and DPO color is based on the primary moving average you are using. If you want consistency, and want to use the Bollinger Bands, then keep your primary moving average set as a 20 SMA, as that is the basis for Bollinger Bands.
Hope this is helpful to you. Definitely pair it with an additional indicator like an RSI, or my +ADP. I like to use something rangebound to compare its signals to.
FUERSTUses Normalized Price Oscillator and Stochastics and combines them as an ADX weighted measure.
During low trend intensity Stochastics gets higher weighted than Price Oscillator, and vice-versa in times of high trend-intensity.

Combo Backtest 123 Reversal & DiNapoli Detrended Oscillator This is combo strategies for get a cumulative signal.
First strategy
This System was created from the Book "How I Tripled My Money In The
Futures Market" by Ulf Jensen, Page 183. This is reverse type of strategies.
The strategy buys at market, if close price is higher than the previous close
during 2 days and the meaning of 9-days Stochastic Slow Oscillator is lower than 50.
The strategy sells at market, if close price is lower than the previous close price
during 2 days and the meaning of 9-days Stochastic Fast Oscillator is higher than 50.
Second strategy
DiNapoli Detrended Oscillator Strategy
WARNING:
- For purpose educate only
- This script to change bars colors.

Detrended Price Oscillator with projected SMAHaven't seen any DPO scripts like this one...
Dpo is generaly use to find cycles in the market rather than prices trends.
As you can see a centralized Dpo is ploted with barsback *actual is shown behing actual price timeline.
Using timeline diferences between the two last highest or the two last lowest histogram bands can give you an aproximation of those market cycles.
Dpo SMA's trends can also be use to compare actual price timeline direction in 3 ways...
#-1: Is the actual price (candles) trend is against or with the dpo SMA's (convergence;divergence) ?
#-2: Is the actual price trend is condensed or dispersed ( criticals values)?
#-3: Does the dpo SMA's are near or far from the dpo cycle bottoms or cycle tops ?
Make sure to know that this indicator isn't a trading reccomandation and may not be suited for your trading style as well that it can be badly interpreted. USE WITH CAUTIONS !
//----Coder----//
R.V.
//----Thanx----//