RSI DivergenceRSI DIVERGENCE is a difference between a fast and a slow RSI. Default values are 5 for the fast one and 14 for the slow one.
You can use this indicator in 2 different ways:
normal RSI : check double or triple top/bottom on a chart meanwhile RSI is descending/ascending (check the example on chart)
signal line : when RSI Divergence cross zero line from bottom to top you get a buy signal (the line become green), vice versa when the RSI Divergence cross zero line in the opposite way you get a sell signal (the line become red)
Difference

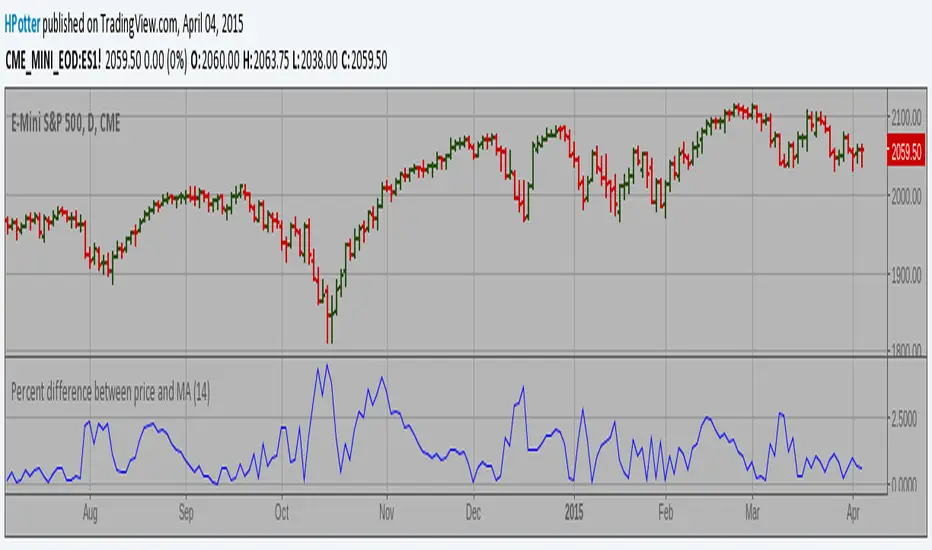
Difference % between PRICE and VWAP V2Shows difference between price and daily/weekly/monthly/hourly/whatever VWAP.
In v2:
option to color bars
average percentual difference of custom period
histogram changes color depending on which levels it's at
Levels/period/color etc can be customized.
Use these inputs in the timeframe box:
M - month
W - week
D - day
2D (or 3W or 2M or whatever) = 2 Days (or three week or 2 months and so on)
60= 1 H
240= 4 H
5 = 5 min
and so on.
btw, vaguely remembering reading somewhere that the big players like to make their entry at 4% difference.

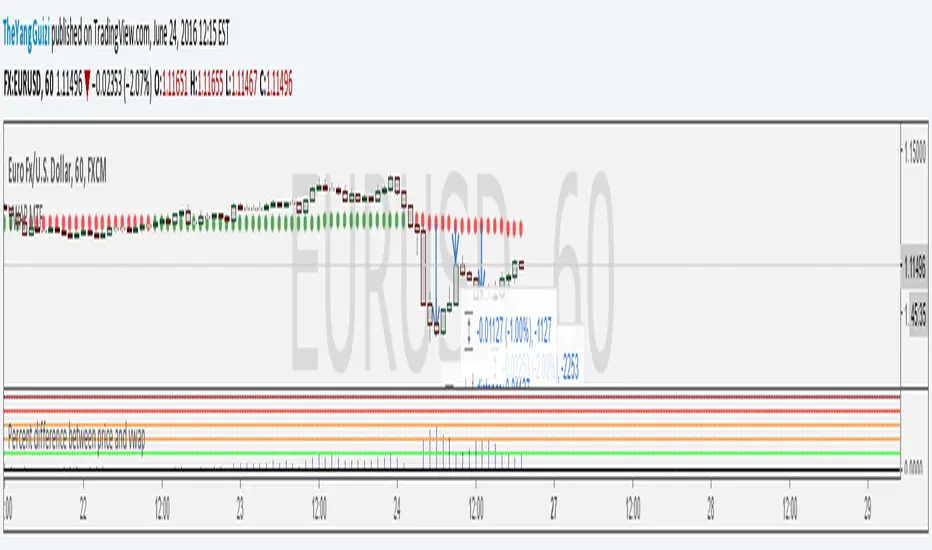
Percent Difference Between VWAP and Price MTFShows the difference between vwap and price in percent.
You can can choose between multiple timeframe vwap. Default is normal daily.
The levels on the indicator can be changed to whatever you want to.
In the chart above we can see eurusd reverting up at 3% below monthly vwap, after the brexit dip, It then turns down again at 1% from monthly and lastly it turns up again at 2% from monthly.
Script is a small modification of this:
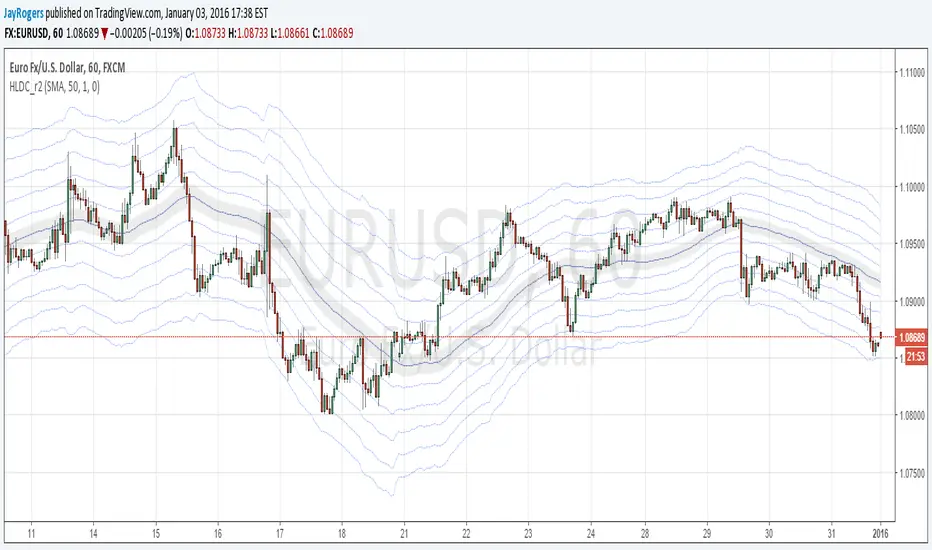
High-Low Difference Channels r2About:
I developed the original as an experiment to potentially replace or augment my BB and RSI based strategies. After some back-testing I could see some really interesting results but it wasn't quite where I wanted it, so after some tweaking and further back-testing, and adding in more MA options, here we are. Mostly tested on 1h and greater time-frames using default settings.
Description / Usage:
Adjust length and multiplier much the same way you would expect with Bollinger Bands.
Multiplier of 1 gives you a base channel consisting of one high, and one low sourced MA
The outer channels are increments of the base high-low channel width, away from the hl2 sourced MA
r2 Changes:
Increased amount of up/down channels to 5, and lowered multiplier default to 1 (previously 1.5)
Tweaked default colour scheme.
Pick your MA poison of choice! Added choices for all your common MA variants.
Issues:
VWMA bugs out and refuses to draw sometimes - no idea why.
Additional Notes:
All MA variants available in this script were derived directly from the sources of those available within the pine editor. I have been fairly diligent trying to ensure they all function correctly, but I can't 100% guarantee it, so if anyone gives the script a try, or dives into the code and see's something odd - don't hesitate to let me know!
It would also be fantastic to hear feedback from anyone who finds use for this, to augment an existing strategy/idea, or develop something new. :)
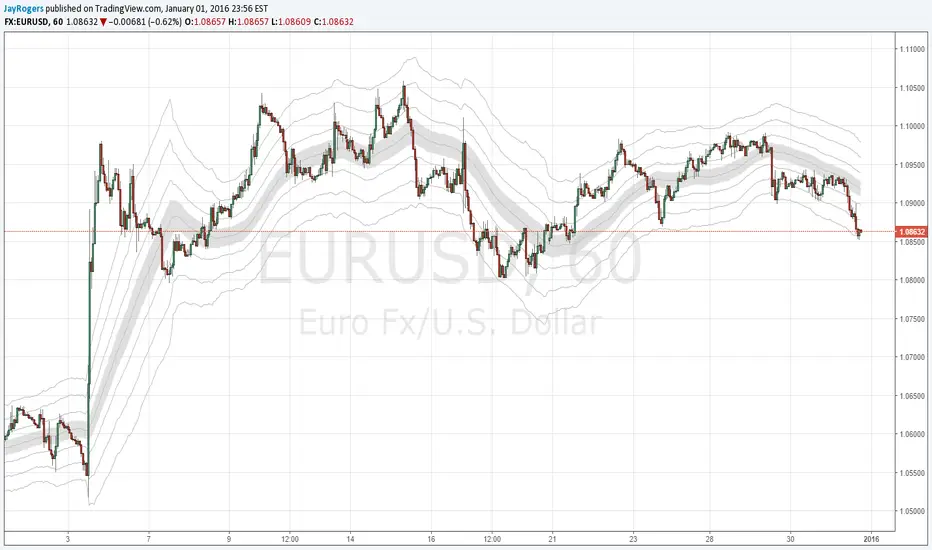
High-Low Difference Channels - SMA/EMAI wrote this up as a potential replacement for my BB based strategies, and so far it's looking pretty nice.
Description / Usage:
Adjust length and multiplier much the same way you would expect with Bollinger Bands.
Multiplier of 1 gives you a base channel consisting of one high, and one low sourced SMA (or EMA)
The outer channels are increments of the base channels width, away from the median hl2 sourced SMA (..or EMA)