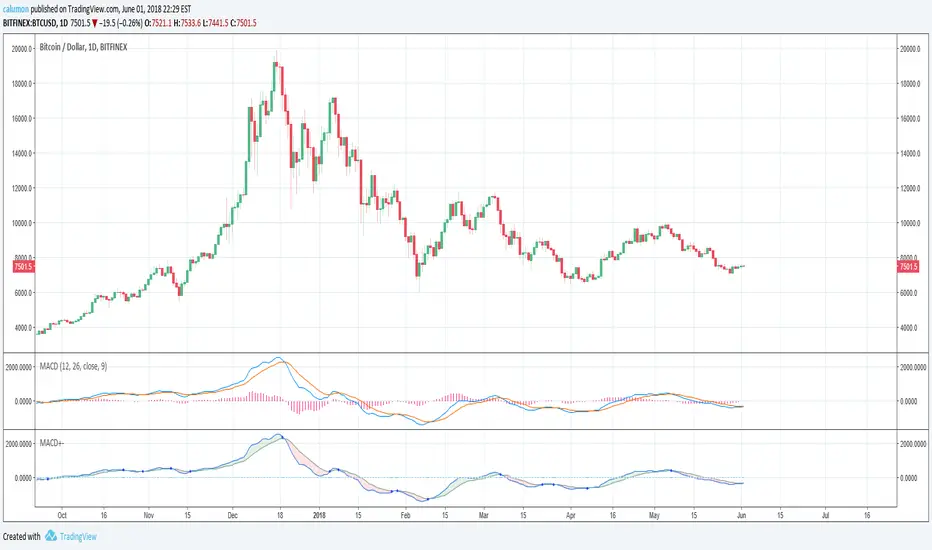
MACD with highlighted positive and negative trendThe values used by this indicator are equal to MACD 12 26 9 (and Signal). Only changes are made to looks:
If MACD closes higher than Signal, then we are seeing green. Else, we are seeing red.
Another point is that we get a blue circle when there is a trend change from bullish to bearish or vice versa. Please note that there needs to be an offset for this. We will only see the circle, when there already WAS (instead of is) a trend change.
Divergence
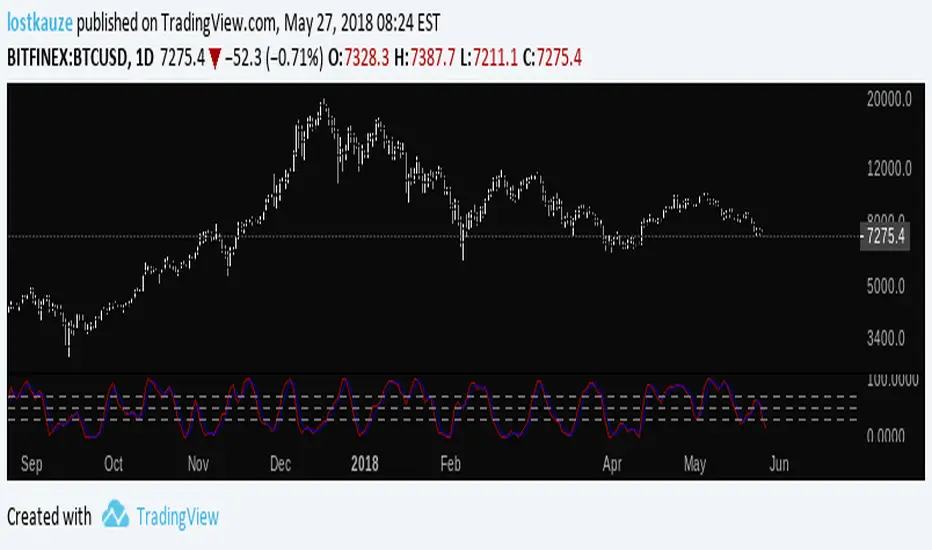
Stoch BitfinexSimilar to RSI Bitfinex , but Stoch version.
It applies Stochastic Oscillator to BTC longs/shorts ratio on Bitfinex. You can use the oscillator as you'd use Stoch:
- Divergences
- Oversold/overbought signals
- R/S on the indicator
- Trend indication
- etc
Stochastique Divergences IndicatorHello,
I made a custom indicator.
Divergences with stochastique and price are really strong signals.
About the indicator
A bullish divergence happens when the stoch K makes a higher low and is depicted by a green triangle up.
A bearish divergence happens when the stoch K makes a lower high and is depicted by a red triangle down.
This script is the base for my next strategy that I should upload soon.
I will grant access (to this script and my others) to people willing to make a small donation.
Here is my BTC address : 19sVQvCDmVfEACq7BiMnWSMqFPZ8qfSQ2K
If you prefer ETH : 0xc8a5d3a63a05db0c2363ea1c08b37a01cce9ebfb
Send me a Private Message with the ID of the transaction
If you want to do some forward testing first, send me a message.
Also check blockchainfiesta.com

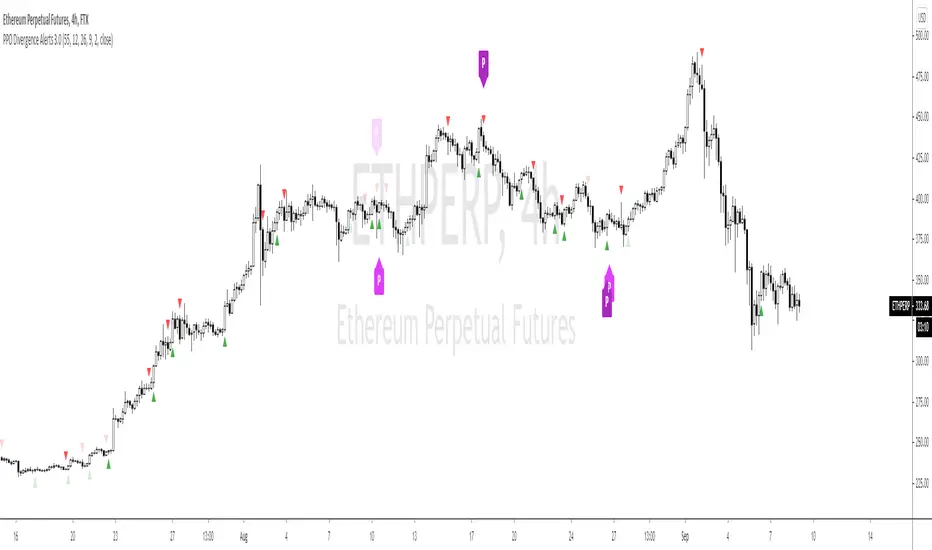
RSI Divergence Alerts (BETA)This Script uses the original code from the 'PPO Divergence alerts' by Scarf
Only difference is the RSI is used as the input instead.
Adjust the smoothing setting as required to change sensitivity for alerts.
Feel free to contact me if you would like more info.

Divergence Indicator This is a simple divergence indicator that was mainly developed for the Quick Fire Strategy. Works well on mobile devices (TV App) as well. Was developed originally for RSI with setting of 14.


RSI DivergenceHi!
Lately I had quite a few requests for an RSI divergence development, so I decided to make a publish version of such indicator. This is how it works:
It searches for peaks on the RSI indicator (not on the price!):
when the RSI values greater than two values before and after that value it's a peak
when the RSI values lesser than two values before and after that value it's a trough
NOTE: The peak/trough could be detected only after two new bars are formed!
The indicator remembers high/low price on the bar with the peak/trough. When the indicator value at the peak is lower than the indicator value at the previous peak and the low price at the current peak is higher than the low price at last peak then it's a hidden bullish. Vice versa for the trough.
So, this indicator can detect the next cases:
indicator fall + high rise = regular bearish
indicator rise + high fall = hidden bearish
indicator rise + low fall = regular bullish
indicator fall + low rise = hidden bullish
You can donate ETH (0xa961e3866f58c36aaef958714d4f75d9c081b8bc) if you want to thank me more than just a like or a comment.

DepthHouse BTC Momentum Oscillator [BTC MO]NOTE: Only Works on BTC.
All testing was done on 1hr Timeframe
This is a experimental indicator - use at your own risk.
DepthHouse BTC Momentum Oscillator is an advanced tool to help determine Bitcoin Market Momentum.
---BTC MO SIgnals---
Signal Line: Generally, if the Signal Line is greater than 0, then there is more bullish momentum in the market
Tops & Bottoms: Signals used to help spot where BTC momentum may have topped or bottomed out
Possible Divergences: Used to help spot possible reversals on continuous trends
---oh92's Preset Setting---
Scalper: (20,11,17,6) Very reactive settings that I use while day trading. However, faster settings generally increase the chance of false signals(20,11,17,6)
Swing Trader: (5,25,55,10) Greatly reduces noise for my longer time trades. Generally makes 'tops' and 'bottoms' more accurate. Which can be a huge advantsge in spoting an earnly trend reversal
Custom: Allows user adjustments of all settings
---Built-in-Alerts---
Tops
Bottoms
Bearish Divergences
Bullish Divergences
Signal Line Crossovers
Try this indicator for FREE! Just leave a comment, or feel free to send me a PM

Stochastic On Balance Volume(not sure why the text in the image above is messed up; it looked good before publishing. The oscillators above are (from top to bottom) StochOBV, OBVOSC (LazyBear), OBV)
Applies the Stochastic Oscillator to OBV the same way StochRSI applies the Stochastic Oscillator to RSI.
Features:
- Bounded between 0 and 100, so it may be used for overbought/oversold alerts;
- Uses two lines for crossing signals similar to Stoch and StochRSI;
- Only considers recent OBV action, similar to how StochRSI only considers recent RSI action;
It can be used for simple signals, divergence, trend lines, and any other method you'd use StochRSI for.
The OBV calculation is from LazyBear's OBVOSC script here , so thank you for your script.

MACD percentage price oscillatorMACD Percentage Price Oscillator is a variation of the MACD indicator. Signal line crossovers are almost identical. The major difference is the MACD Percentage scale which enables comparison between stocks at different prices.
MACD Percentage Price Oscillator's trading signals are the same as for the MACD indicator. The MACD indicator is primarily used to trade trends and should not be used in a ranging market. Signals are taken when MACD crosses its signal line, calculated as a 9 day exponential moving average of MACD.
First check whether price is trending. If the MACD indicator is flat or stays close to the zero line, the market is ranging and signals are unreliable.
Signals are far stronger if there is either:
- a divergence on the MACD indicator; or
- a large swing above or below the zero line.
- Unless there is a divergence, do not go long if the signal is above the zero line, nor go short if the signal is below zero. Place stop-losses below the last minor Low when long, or the last minor High when short.
The main advantage of MACD Percentage over MACD is the ability to compare indicator values across stocks.
The only difference with MACD Percentage Price Oscillator is that the difference between the fast and slow moving averages is calculated as a percentage of the slow moving average: MACD = (12 Day EMA - 26 Day EMA) / 26 Day EMA

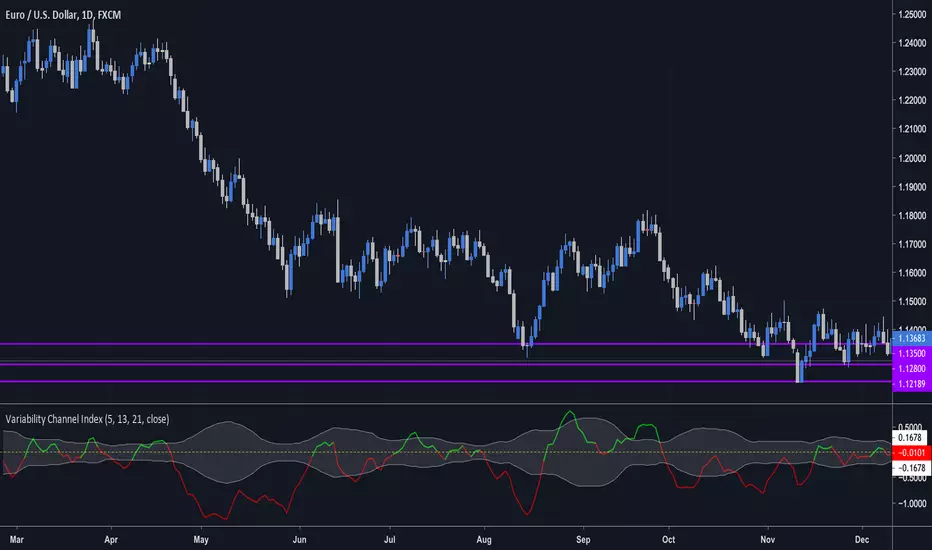
Variability Channel Index (by vitelot)This is a momentum, trend, as well as a divergence indicator.
It is similar to CCI, though it is based on a slow and fast EMA in connection to ATR, which
allows to interprete it easily.
Both EMAs and ATR have customisable period.
Further explanation and basic usage can be found in the comment section inside the script.
Awesome Oscillator and MACD HistogramThis is a quick script that combines two standard indicators, the Awesome Oscillator and MACD histogram, to highlight the beginnings of periods of fast price movement (divergence between the two). Since MACD's EMA responds more quickly than AO's SMA, look for periods of green over gold as a bullish signal, and red under blue as a bearish signal.
Of course both indicators are lagging in nature, but the presence of this divergence often leads larger, continued movement in the same direction.
Bullish Signals
Change from red to green below 0 with either blue or gold above 0 (strengthened on second green bar):
Rising green above 0 with gold below 0:
Bearish Signals
Change from green to red above 0 with either blue or gold below 0 (strengthened on second red bar):
Deepening red below 0 with blue above 0:

Trend StrengthTrend Analysis and Divergence Filter
This tool helps you to read trend strength and spot divergences, to be ready for a reversal.
All the tool is based on a colorcode:
- bright colors = impulse bars.
- hard colors = consolidation / continuation bars.
- light colors = weakness bars.
=> You can choose to use barcolor, or not, and simply use the indicator. Divergences occured on the histogram, when the price makes a local high/low, but the histogram in the black zone.
Also, the reason why i created is that it is insanely accurate to spot divergences in an established trend.
#In an uptrend:
- If prices makes a higher high,
- But bar color is green light (or histogram is in the blackzone), it's probably the end of the move and a regular bearish divergence is happening.
=> Take profit and open a short.
#In a downtrend :
- If price makes a lower low,
- But bar color is red light (or histogram is in the blackzone), it's probably the end of the move and a regular bullish divergence is happening.
=> Take profit and open a long.
To sum up:
- when you see light bars, or if the histogram is in the blackzone, be prepared for a move.
- To choose the direction, check for divergences before entering.
To get the most benefit of this indicator, use it in a multi timeframe strategy :
The indicator will give you the best results in the subordinate timeframe, considering you trade using a macro trend, a parent and a subordinate one.

Auto Divergence StrategyThis is the initial release of the Strategy to backtest my Auto Divergence Study:


CMYK RMI◊ Introduction
I started using this script because of its fast reaction, and good tell for buy/sell moments on a short timescale.
For larger timescales, the overall trend should be taken into account regarding the levels.
In the future i will update this indicator, to automatically adjust those.
◊ Origin
The Relative Momentum Index was developed by Roger Altman and was introduced in his article in the February, 1993 issue of Technical Analysis of Stocks & Commodities magazine.
While RSI counts up and down days from close to close, the Relative Momentum Index counts up and down days from the close relative to a close x number of days ago.
This results in an RSI that is smoother.
◊ Adjustments
CMYK color theme applied.
Four levels to indicate intensity.
Two Timescales, to overview the broader trend, and fast movements.
◊ Usage
RMI indicates overbought and oversold zones, and can be used for divergence and trend analysis.
◊ Future Prospects
Self adjusting levels, relative to an SMA trend.
Alternative RMI, which functions as an overlay.
◊ ◊ ◊ ◊ ◊ ◊ ◊ ◊ ◊ ◊ ◊ ◊ ◊ ◊ ◊ ◊ ◊ ◊ ◊ ◊ ◊ ◊ ◊ ◊ ◊ ◊ ◊ ◊ ◊ ◊ ◊ ◊ ◊ ◊ ◊ ◊ ◊ ◊ ◊ ◊ ◊ ◊ ◊ ◊ ◊ ◊ ◊ ◊ ◊ ◊ ◊ ◊ ◊ ◊ ◊ ◊ ◊ ◊ ◊ ◊ ◊ ◊ ◊ ◊ ◊ ◊ ◊ ◊ ◊ ◊ ◊ ◊ ◊ ◊ ◊ ◊ ◊ ◊ ◊ ◊ ◊ ◊ ◊ ◊ ◊ ◊ ◊ ◊ ◊ ◊ ◊ ◊ ◊ ◊ ◊ ◊ ◊ ◊ ◊ ◊ ◊ ◊ ◊ ◊ ◊ ◊

PPO Divergence Alerts 2.0This is basically the same code as my other PPO Divergence indicator expect it overlays the signal on the candles, rather than needing the oscillator. I'm keeping the old version, as I'm sure people will prefer it, but this version takes up less screen real estate.
EMA Spread OscillatorEMA Spread Oscillator
Quickly see past levels where diff maxed out. Momentum and price can only keep going up for so long. This obviously differs per underlying asset. So that is where this oscillator comes in handy.
Of course you can see on the chart how far apart the moving averages are, but it is easier to spot on an oscillator.
Volume Weighted Average Divergence [DW]This is an experimental study inspired by the volume weighted moving average convergence divergence (VWMACD) concept.
In this formula, divergences between two volume weighted moving averages and two simple moving averages over their respective lookback periods are calculated.
The difference between the divergences is calculated, then the difference between the result and an exponential moving average of the result are calculated to provide a histogram.
Finally, the mean value between the two divergences is calculated to provide the VWAD line.
Custom bar colors are also included.

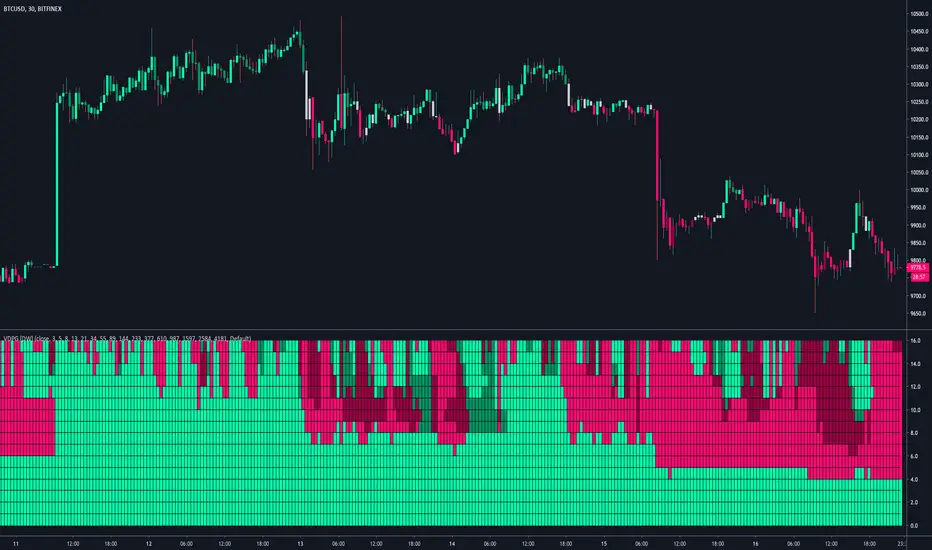
Volume Divergence Polarity Grid [DW]This study is an experiment built off the framework of my Dual Volume Divergence Index indicator.
It is designed to gauge polarity over multiple lookback periods of your choice by expressing the data as a two color grid.
Positive Volume Divergence and Negative Volume Divergence are calculated, and their relative values are used to gauge polarity.
The order of the grid is top to bottom - the top is the first lookback period, and the bottom is the last.
MTF Polarity Grid [DW]This is an experimental study designed to track directional polarities across multiple timeframes and express them as a simple two color grid.
The polarity in this calculation is determined by divergence between a fast and slow McGinley Dynamic.
Your current resolution's polarity is the top row, the rows below are are for higher timeframes of your choice.

Auto Divergence StudyDiscover Divergences of Price vs Momentum or Price vs. CCI
Ready to be used with Autoview to automate your Trades
Supports Pyramiding
Buy-/ Sell-Signals
Alerts to open and close Trades
This Work is based on and combines the following Studies:
Jeddingen Divergence v4
CCIDivergence
Thanks to this amazing guy, who helped me with the Autoview support:
www.tradingview.com

KAMA Divergence [DW]This study is a simple experiment that expresses divergences between price and Kaufman's Adaptive Moving Average as a percentage. The result is then smoothed using KAMA to provide a signal line.
