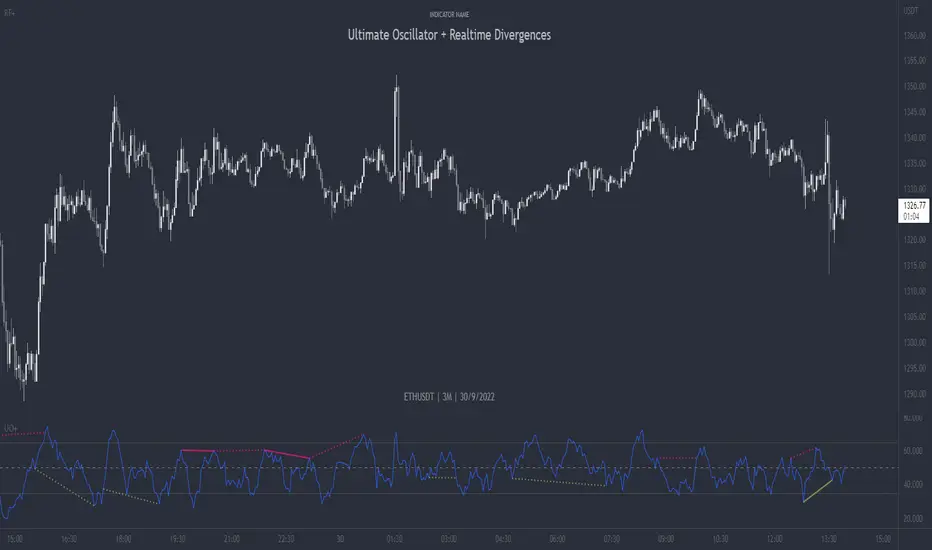
Stochastic Weighted RSI w/ Divergence + Signals🐢 Tawtis' Stochastic Weighted Relative Strength Index , aka SWRSI
This indicator combines the Stochastic RSI and the classic RSI we all know and love to create a more effective indication of seller/buyer dominance, and in turn, trend. I have named it the "Stochastic Weighted RSI". The script also includes a standard RSI, so you can use both at the same time!
Loads of customisation, pretty much every input can be changed to fit your preferences, however, the default settings are what I would personally recommend for the best results. Either way, feel free to change them!
By looking at the indicator, you can also establish the trend that may follow in the candles to come.
Typically, an indicator reading of over 70 is considered overbought, and an indicator reading of under 30 is considered oversold.
The calculations for the SWRSI and its signals take into account a multitude of exponential moving averages, a Stochastic RSI and a classic RSI, among other things.
There are 2 types of signals provided by the indicator, being strong and weak. You do not have to follow these, and they aren't always accurate (it's impossible to be accurate 100% of the time), however, they can give a good idea of the trend that will ensue.
Strong buy signals are created when:
SWRSI is under 30
SWRSI is over the EMA (default 2) of the SWRSI
Short EMA (default 20) is under the long EMA (default 50)
Strong sell signals are created when:
SWRSI is over 70
SWRSI is under the EMA (default 2) of the SWRSI
Short EMA (default 20) is over the long EMA (default 50)
Weak buy and sell signals are printed as green and red background highlights, and operate the same as the strong buy and sells, without the short/long EMA criterion. Both of these signal types can be toggled off using the settings if you do not want to see them.
Enjoy!
Divergence
Time Segmented Volume with divergence and Kumo cloud backgroundThis is a Time Segmented Volume (TSV) indicator with added divergence hunter, crossing signals, Kumo cloud background and alert functions
Please keep in mind that this indicator is a tool and not a strategy, do not blindly trade signals, do your own research first!
3GBH - MoneyMeter (Stablecoins RSI)This indicator tracks the Market Caps of
- USDT
- USDC
- DAI
The data is presented on the RSI.
The intent of this indicator is to help determine whether money is flowing into the market or not.
If the major stablecoins are green, money is entering the market.
The opposite applies, if red, money is leaving the market.
This is another tool which may provide help to build confluence in your trading or analysis.
-----
Default length is set to 168 to see the momentum of the past 7 days on the 1-hour timeframe.
Martyv Auto Fib Retracement with Logarithmic SupportSimple & easy auto-fib levels. Took the out-of-the-box version provided by TradingView and added Logarithmic support and a nicer palette, and made the controls a bit nicer to use (in my opinion lol). Enjoy.
RSI Signals by HBRELATIVE STRENGTH INDEX (RSI)
This is a tool that is widely used
Especially for Overbought and Oversold systems, but I have made some changes in this indicator,
How to use it...!
I have set it as the default setting
- RSI Length: 7
- Overbought: 70
- Oversold: 30
What is unique about this tool?
we can see 3 conditions:
1) RSI Overbought / Oversold with Bullish Engulfing / Bearish Engulfing
2) RSI Overbought / Oversold with Hammer and Shooting Star
3) RSI Overbought / Oversold with 2 Bullish Bars / 2 Bearish Bars
4) RSI Overbought / Oversold with All Patterns at the same time
When the RSI reaches its Oversold line, the code will wait for Bullish Engulfing pattren , when oversold and Bullish engulfing matched, This indicator will generate a buy signal when the condition is met,
and same as for Bear market, When the RSI reaches its Overbought line, the code will wait for Bearish Engulfing pattren , This indicator will generate a sell/exit signal when the condition is met,
2nd condition is that a Hammer candle will be waited for when RSI touches the Overbought line, for Bullish Move
and Shooting Star candle will be waited for when RSI touches the Overbought line, for Bullish Move, for Bearish Move
3rd Condition is also the same as Condition 1 and Condition 2,
When the RSI reaches its Oversold line, the code will wait for 2 Bullish Bars , when oversold and 2 Bullish Bars matched then this indicator will generate a buy signal, and same as for Bear market,
When the RSI reaches its Overbought line, the code will wait for 2 Bearish Bars , when overbought and 2 Bearish Bars matched then this indicator will generate a Sell signal,
4th Condition is that we can use All Conditions at the same time,
- Bullish Engulfing / Bearish Engulfing
- Hammer and Shooting Star
- 2 Bullish Bars / 2 Bearish Bars
Tipsy EMA Tipsy EMA
v0.2a
Coded by vaidab.
A simple strategy to buy dips in an uptrend.
How to use:
- buy on trend when price retraces to the orange "buy" line and compound orders
- sell when price reaches red line (stop loss) or at 💰 (take profit)
Note that you can reverse trade on the 💰 sign for a short scalp / day trade.
Uptrend: green/red background. Danger zone: orange bg. No go zone: no bg.
Potential buys (in a clear trend): 55, 100, 200 EMA touches and
fibo retracements to .382 and .618.
Potential stop loss: when price breaks the 200 EMA (marked by a red line).
Exit signs: opposite trend divergences (RSI).
Take profit: EMA 55 crossing down EMA 100.
Use it in confluence with market structure. E.g. If 200 EMA ligns up with
past market structure, if there are whole numbers or if there's a monthly level.
Tested BTCUSDT D, 4H
MashumeHullTV█ OVERVIEW
This plots the Hull Moving Average Turning Points and Concavity
with the addition of colored segments representing concavity and turning points: maxima, minima and inflection.
a fast way to determine the trend direction and possible reversals based on concavity of the trend
Dark Green: Concave Up but HMA decreasing. The 'mood' has changed and the declining trend of the HMA is slowing. Possible trend change to Uptrend soon
Light Green: Concave up and HMA increasing. Price is increasing, and since the curve is still concave up, it is accelerating upward. Uptrend
Orange: Concavity is now downward, and though price is still increasing, the rate has slowed, perhaps the mood has become less enthusiastic. Possible trend change to Downtrend soon
Red: Concave down and HMA decreasing. Downtrend
Buy signals generated when Hull turns from Dark Green -> Light Green
Sell signals generated when Hull turns from Orange -> Red
To best determine if this is a entry point or a trend reversal, it is recommended to use in conjunction with the QQEMoMoTV indicator
█ FEATURES
Calculations
Calculates the concavity of the Hull Moving Average comparing the Hull concavity of the current bar to the previous bar and displays the concavity in the form of 4 different colors.
Note: may cause repainting, so recommended to use with another indicator such as the QQEMoMoTV indicator to confirm signals.
Calculates divergence between the calculated HMA and the actual price and displays this in the Divergence Label.
Calculates the local minima, maxima and inflection points with the ability to display these as auto support/resistance lines.
Inputs
You can use the script's inputs to configure:
• Calculation Source (default HL2)
• HMA Length (default 21)
• Lookback (default 2)
• Whether to show Auto Support/Resist Lines
• Whether to show Buy/Sell Arrows
• Whether to show Divergence Label
• Whether to extend Local Auto Support/Resist Lines
Alerts
Buy Signal alert based on HMA crossing above MA_Min/Hull Support, when Hull turns from Dark Green -> Light Green, Bullish
Sell Signal alert based on HMA crossing below MA_Max/Hull Resistance, when Hull turns from Orange -> Red, Bearish
Experimental support for applying the indicator to higher time frames
eg. charting the hourly MashumeHull indicator on 15 min chart. See the commented code to access this feature
█ CREDITS
Original Author: Seth Urion (Mashume)
Feature upgrades and usage: Xiuying
Converted to Tradingview by: Machdragon
HTF Candles by DGThigher timeframe (multi timeframe) candles
a simple study introducing new pine function box.new
Volume per PointHello everyone <3
I present to you guys my new indicator Volume per Point (VP)
As suggested by the title, this script gives you the volume for every point.
Here's a run down on specific features:
SUBCHART COLUMNS:
The columns can be the following four colors:
Green - There was an increase in VP
Red - There was a decrease in VP
Yellow - There was divergence between volume and candle range
Purple - There are signs of exhaustion compared to the previous candlestick
SUBCHART HISTOGRAM:
The histogram can be the following two colors:
Lime - Buying volume
Red - Selling volume
I left you guys the ability to change the multiplier on the volume in settings just incase it's too small or too big compared to the VP. Decimals are allowed!
CANDLESTICK CHART:
The candlesticks can the following two colors:
Yellow - There was a divergence between volume and candle range
Purple - There are signs of exhaustion compared to the previous candlestick
FILTERS
In the settings, you're able to add the following two filters:
RSI Filters - RSI must be below or above the specified value for the divergence or exhaustion to trigger
Percent Filters - The candlestick range or volume must be higher or lower than the specified value depending whether it's divergence or exhaustion.
This is a very helpful tool if you're interesting in reading volume. It also facilitates finding market maker activity depending on the size of the VP. Sudden abnormal spikes in VP usually do signal something and that's up for you to figure out :)
Thank you for your time to read this
~July <3
RSI Divergence (chiefwils0n)Greetings All,
This simple indicator is a stylistic modification of the original TradingView Divergence indicator. I've enhanced the following:
Styles
RSI will turn RED when overbought and CYAN when oversold. CYAN presents an LONG opportunity, while RED is where I look for SHORT entries.
Added background color to the the Oversold/Mid-Level and Overbought/Mid-Level. The idea is to go LONG when RSI is in the GREEN channel, and consider closing your position when RSI is the RED channel. Or, SHORT in the RED, and close your position in the GREEN.
Hidden Divergences are styled with muted colors. Maroon is Hidden Bearish and Dark Green is Hidden Bullish.
Regular Divergences have brighter labels with Red (Bearish) and Lime (Bullish). My logic is to bring attention to these divergences, since they are stronger than hidden divergences.
Alerts:
I also added the following alerts:
Bullish Divergence
Hidden Bullish Divergence
Bearish Divergence
Hidden Bearish Divergence
RSI Overbought
RSI Oversold'
The alerts really distinguish this script for me. I hope you enjoy.
Happy Trading!
Divergence of Stocks Above MA50 v.s. US-Stock MarketEnglish:
This indicator has been developed as an early warning tool to estimate the probability of correction in the US stock market. It works best in the daily chart.
Function:
1.) "Index-line"
The underlying stock index is converted to a scale between 0% and 100% based on its 52-week highs and lows. Where 100% is closing price at 52-week high and 0% is closing price at 52-week low.
2nd) "Stocks Above MA50".
For each major stock index, there is an index that determines the percentage of stocks above its 50 moving average. For example, for the S&P 500, this is the S5FI.
3) "Divergence
In an efficient market, both lines (index and number of stocks above the 50 MA) would run more or less in sync. A new high in the index would also mean a new high in the stocks trading above the 50 moving average. Often, however, a correction in the index is announced when the number of stocks trading above their 50 MA do not make a new, or even a lower, high while the underlying index marks a new high. The divergence signal measures this divergence of the indices. The higher the bar, the more pronounced the divergence.
How to read the indicator?
If a divergence occurs, then the stops should be tightened. As with any indicator, false signals can occur because a divergence does not automatically lead to a correction. The higher the divergence is indicated, the higher the probability. The strength of a correction cannot be predicted with the indicator.
For which symbols does the indicator work?
The indicator works exclusively for the following symbols:
S&P500: SPX, SPY, ES1!, US500 Index above MA50: S5FI
Russel2000: IWM, US2000, RTY1!, RUT, IWO Index above MA50: R2FI
NASDAQ100: NDX, NAS100, NQ1!, US100, QQQ Index above MA50: NDFI
NASDAQ: IXIC, ONEQ, QCN1!, NDAQ Index above MA50: NCFI
NYSE: XAX, NYA Index above MA50: MMFI
DowJones100: DJX, DJI, DIA, MYM1!, YM1! Index above MA50: DIFI
DowJonesComp: DOW, IYY Index above MA50: DCFI
Deutsch:
Dieser Indikator ist als Frühwarninstrument zur Einschätzung der Korrekturwahrscheinlichkeit im US-Aktienmarkt entwickelt worden. Er funktioniert am besten im Tages-Chart.
Funktion:
1.) „Index-line“
Der zugrunde liegende Aktienindex wird bezogen auf seine 52Wochen Hochs und Tiefs in eine Skala zwischen 0% und 100% umgerechnet. Dabei sind 100% Schlusskurs auf 52-Wochen Hoch und 0% Schlusskurs auf 52-Wochen Tief.
2.) „Stocks Above MA50“
Zu jedem Hauptaktienindex gibt es einen Index, der den Prozentwert der Aktien über Ihrem 50 gleitenden Durchschnitt ermittelt. Beim S&P 500 ist das z.B. der S5FI.
3.) „Divergence“
In einem effizienten Markt würden beide Linien (Index und Anzahl Aktien über dem 50 MA) mehr oder weniger synchron laufen. Ein neues Hoch im Index würde auch ein neues Hoch bei den Aktien, die über dem 50 gleitenden Durchschnitt notieren, bedeuten. Oft jedoch kündigt sich eine Korrektur im Index an, wenn die Anzahl der Aktien, die über ihrem 50 MA notieren kein neues, oder sogar ein niedrigeres Hoch machen, während der zu Grunde liegende Index ein neues Hoch markiert. Das Divergenz-Signal misst diese auseinanderlaufen der Indices. Je höher der Balken, umso stärker ist die Divergenz ausgeprägt.
Wie ist der Indikator zu lesen?
Wenn eine Divergenz auftritt, dann sollten die Stopps enger herangezogen werden. Es kann wie bei jedem Indikator zu Fehlsignalen kommen, da eine Divergenz nicht automatisch zu einer Korrektur führen muss. Die Wahrscheinlichkeit ist um so höher, je höher die Divergenz angezeigt wird. Die Stärke einer Korrektur kann mit dem Indikator nicht prognostiziert werden.
Für welche Symbole funktioniert der Indikator?
Der Indikator funktioniert ausschließlich für folgende Symbole:
S&P500: SPX, SPY, ES1!, US500 Index über MA50: S5FI
Russel2000: IWM, US2000, RTY1!, RUT, IWO Index über MA50: R2FI
NASDAQ100: NDX, NAS100, NQ1!, US100, QQQ Index über MA50: NDFI
NASDAQ: IXIC, ONEQ, QCN1!, NDAQ Index über MA50: NCFI
NYSE: XAX, NYA Index über MA50: MMFI
DowJones100: DJX, DJI, DIA, MYM1!, YM1! Index über MA50: DIFI
DowJonesComp: DOW, IYY Index über MA50: DCFI
[Lixx] MESA(EMA/SMA) and ROC(ROC/MESA) Take Profit TriggersThis script uses the MESA EMA and SMA as well as the ROC/MESA cross to help find the take profit areas when trading divergences using market cipher or wavetrend. It is inspired by jordanfungs MESA indicator, however this one is different because it is not lagging in the signals.
Hope you enjoy it, and make sure to backtest any strategy before you use it.
RSI Div at Daily VWAP StDevMean Reversion indicator based on RSI Divergences at Overbought/Oversold conditions with Price above/below a Standard Deviation from Daily VWAP. Useful for intra-day trading.
Signal criteria:
1. RSI is at Overbought/Oversold
2. RSI Divergence present (not hidden)
3. RSI has not reached Neutral level (i.e. 50)
4. Price has crossed above/below a Standard Deviation from Daily VWAP
Config Options:
- RSI length (default:14)
- Divergence Lookback Period (default:14)
- RSI Oversold/Overbought tresholds (default: 70/30)
- RSI Reset Level (default: 55/45)
- Use VWAP Std Dev (default: yes)
- Standard Deviation from Daily VWAP (default: 1.51)
Use with discretion.
Divergence Indicator with alertsFirst time I've published a script so go easy!
All credit goes to @yatrader2 for the script, I have just made it easier to set alerts on it.
Enjoy!
[blackcat] L1 Blackcat Customized CCI IndicatorLevel: 1
Background
This CCI indicator is blackcat customized version with enhanced features.
Function
This CCI use green line to indicate strong long trend with cci values > 0 and red line to indicate weak long trend with cci values <0. It also use yellow and fuchsia candles to present the strong and weak long trend. A green candle is used to indicate long entry, while a red candle is usded to indicate long flatten signal.
Key Signal
green line --> strong long trend
red line --> weak long trend
blue line --> trend strength indicator
SELL label --> flatten long or short entry
BUY label --> long entry
TOPDIV label --> top divergence indicator
BOTDIV label --> bottom divergence indicator
Remarks
Feedbacks are appreciated.
Readme
In real life, I am a prolific inventor. I have successfully applied for more than 60 international and regional patents in the past 12 years. But in the past two years or so, I have tried to transfer my creativity to the development of trading strategies. Tradingview is the ideal platform for me. I am selecting and contributing some of the hundreds of scripts to publish in Tradingview community. Welcome everyone to interact with me to discuss these interesting pine scripts.
The scripts posted are categorized into 5 levels according to my efforts or manhours put into these works.
Level 1 : interesting script snippets or distinctive improvement from classic indicators or strategy. Level 1 scripts can usually appear in more complex indicators as a function module or element.
Level 2 : composite indicator/strategy. By selecting or combining several independent or dependent functions or sub indicators in proper way, the composite script exhibits a resonance phenomenon which can filter out noise or fake trading signal to enhance trading confidence level.
Level 3 : comprehensive indicator/strategy. They are simple trading systems based on my strategies. They are commonly containing several or all of entry signal, close signal, stop loss, take profit, re-entry, risk management, and position sizing techniques. Even some interesting fundamental and mass psychological aspects are incorporated.
Level 4 : script snippets or functions that do not disclose source code. Interesting element that can reveal market laws and work as raw material for indicators and strategies. If you find Level 1~2 scripts are helpful, Level 4 is a private version that took me far more efforts to develop.
Level 5 : indicator/strategy that do not disclose source code. private version of Level 3 script with my accumulated script processing skills or a large number of custom functions. I had a private function library built in past two years. Level 5 scripts use many of them to achieve private trading strategy.
MOVE/VXTLT CorrelationMany know of the VIX for equity trading. Yet, many are unaware that there is the same kind of volatility measure for trading bonds, called the MOVE Index.
"The Merrill Lynch Option Volatility Estimate (MOVE) Index is a yield curve weighted index of the normalized implied volatility on 1-month Treasury options which are weighted on the 2, 5, 10, and 30 year contracts."
With this script one can see the the correlation and divergences between bonds and its volatility measure to make educated decisions in trading or hedging.
The idea of this script comes from NicTheMajestic.
TSI Strength Meter vs USD with divergenceThis indicator consists of two lines. One is a gray line (USD) and the asset indicator is green or red.
The basis of this indicator is the true strength indicator (TSI) with parameters 5,15. Both line sets are based on a TSI (5,15).
The lookback period is for new highs / new lows. Default value is 200 periods.
GREEN/RED LINE
The first that is green and red is whatever you choose to display ( BTC in this case).
The green and red lines indicate going up or going down.
GRAY LINE
The gray line is the US Dollar . So everything is relative to that by default.
ZERO LINE CROSSES
These are momentum shifts. If you see a crossover of both around the zero line, its a good indication there is a change in momentum and a reversal of trend.
NEW HIGHS NEW LOWS
There are 4 new colors added to this indicator. For the asset you are viewing, a lime color means new highs within the lookback period. A new low is indicated by a yellow line color.
The new lows for the USD are white for new lows within the lookback period and blue line for the new highs.
DIVERGENCE
You can also spot divergences easily. For example, if a lime color is seen on the indicator line, that means "new high" but if it occurs below the last "new high" it means the asset is going up to new highs but the indicator is showing us that the readings are below the previous new highs, indicating a negative divergence.
The same goes for the yellow colored lines. higher yellows mean positive divergence.
And with the US Dollar , blue lines dropping means a negative divergence in the US Dollar , while white lines moving up means a positive dollar divergence.
INTERPRETATION
Examples:
If you see a green and sometimes red line of the asset indicator and a gray line that drops below the zero line; it may mean the asset is rising and the trend is up.
If you see a green and red line below the zero line and with a gray line above the zero line , it indicates there is a negative trend. If you suddenly see blue lines on the USD, this means its hitting new lows. If these blue lines then start to slowly move downwards; then we have a positive divergence. If that were to be followed by the green line crossing the zero line, its a pretty good be that the trend is changing and its a very good buying oportunity.
Moving Average Periodical DivergenceUses the difference between two PMA (Moving Average Periodical) indicators to create an oscillator.
Useful for visualizing daily/weekly cycles, strength and potential momentum. The defaults are 2 days (fast) and 5 days (slow).
MA Divergences StrategyThis is the Strategy version of the Study I published. It is a Moving Average that can be applied to any plot to plot divergences on any oscillator, as well as perform backtesting. You'll need a REALLY good oscillator to perform live trades using this alone, but I think it is a valuable tool and had the Strategy hanging around and for some reason didn't upload it yet.
So here it is.
Turn Length to 1 to follow the oscillator without lag. Turn Length up if you are getting too many false signals or tweak the original oscillator settings.
Uber Oscillator with DivergencesThis is a simple mod of the Uber Oscillator with more periods added to the mix and combined with a the Tradingview Divergence spotter.
Compare it to the standard Ultimate Oscillator and see the difference. Good to even overlay them even.
It basically just adds more detail. You won't always need it but sometimes it can catch big drops/peaks earlier then the standard AO while still retaining relative relaxedness during other periods.
MA Divergences for any indicatorThis is a mod of Tistas mod of the default RSI divergences.
www.tradingview.com
This is a SMA that can be applied to any indicator for divergence seeking. This can be useful if you use a custom indicator script and want divergences added, or for any oscillator really. Set the length to 1 and it will mirror the oscillator in question.
Cyclic Smoothed RSI with Motive-Corrective Wave Indicator
This indicator uses the cyclic smoothed Relative Strength Index (cRSI) instead of the traditional Relative Strength Index (RSI). See below for more info on the benefits to the cRSI.
My key contributions
1) A Weighted Moving Average (WMA) to track the general trend of the cRSI signal. This is very helpful in determining when the equity switches from bullish to bearish, which can be used to determine buy/sell points. This is then is used to color the region between the upper and lower cRSI bands (green above, red below).
2) An attempt to detect the motive (impulse) and corrective and waves. Corrective waves are indicated A, B, C, D, E, F, G. F and G waves are not technically Elliot Waves, but the way I detect waves it is really hard to always get it right. Once and a while you could actually see G and F a second time. Motive waves are identified as s (strong) and w (weak). Strong waves have a peak above the cRSI upper band and weak waves have a peak below the upper band.
3) My own divergence indicator for bull, hidden bull, bear, and hidden bear. I was not able to replicate the TradingView style of drawing a line from peak to peak, but for this indicator I think in the end it makes the chart cleaner.
There is a latency issue with an indicator that is based on moving averages. That means they tend to trigger right after key events. Perfect timing is not possible strictly with these indicators, but they do work very well "on average." However, my implementation has minimal latency as peaks (tops/bottoms) only require one bar to detect.
As a bit of an Easter Egg, this code can be tweaked and run as a strategy to get buy/sell signals. I use this code for both my indicator and for trading strategy. Just copy and past it into a new strategy script and just change it from study to a strategy, something like this:
strategy("cRSI + Waves Strategy with VWMA overlay", overlay=overlay)
The buy/sell code is at the end and just needs to be uncommented. I make no promises or guarantees about how good it is as a strategy, but it gives you some code and ideas to work with.
Tuning
1) Volume Weighted Moving Average (VWMA): This is a “hidden strategy” feature implemented that will display the high-low bands of the VWMA on the price chart if run the code using “overlay = true”.
- If the equity does not have volume, then the VWMA will not show up. Uncheck this box and it will use the regular WMA (no volume).
- defines how far back the WMA averages price.
2) cRSI (Black line in the indicator)
- Increase to length that amount of time a band (upper/lower) stays high/low after a peak. Reduce the value to shorten the time. Just increment it up/down to see the effect.
- defines how far back the SMA averages the cRSI. This affects the purple line in the indicator.
- defines how many bars back the peak detector looks to determine if a peak has occurred. For example, a top is detected like this: current-bar down relative to the 1-bar-back, 1-bar-back up relative to 2-bars-back (look back = 1), c) 2-bars-back up relative to 3-bars-back (lookback = 2), and d) 3-bars-back up relative to 4-bars-back (lookback = 3). I hope that makes sense. There are only 2 options for this setting: 2 or 3 bars. 2 bars will be able to detect small peaks but create more “false” peaks that may not be meaningful. 3 bars will be more robust but can miss short duration peaks.
3) Waves
- The check boxes are self explanatory for which labels they turn on and off on the plot.
4) Divergence Indicators
- The check boxes are self explanatory for which labels they turn on and off on the plot.
Hints
- The most common parameter to change is the . Different stocks will have different levels of strength in their peaks. A setting of 2 may generate too many corrective waves.
- Different times scales will give you different wave counts. This is to be expected. A counter impulse wave inside a corrective wave may actually go above the cRSI WMA on a smaller time frame. You may need to increase it one or two levels to see large waves.
- Just because you see divergence (bear or hidden bear) does not mean a price is going to go down. Often price continues to rise through bears, so take note and that is normal. Bulls are usually pretty good indicators especially if you see them on C,E,G waves.
----------------------------------------------------------------------------------------------------------------------------
cyclic smoothed RSI (cRSI) indicator
----------------------------------------------------------------------------------------------------------------------------
The “core” code for the cyclic smoothed RSI (cRSI) indicator was written by Lars von Theinen and is subject to the terms of the Mozilla Public License 2.0 at mozilla.org Copyright (C) 2017 CC BY, whentotrade / Lars von Thienen. For more details on the cRSI Indicator:
The cyclic smoothed RSI indicator is an enhancement of the classic RSI, adding
1) additional smoothing according to the market vibration,
2) adaptive upper and lower bands according to the cyclic memory and
3) using the current dominant cycle length as input for the indicator.
It is much more responsive to market moves than the basic RSI. The indicator uses the dominant cycle as input to optimize signal, smoothing, and cyclic memory. To get more in-depth information on the cyclic-smoothed RSI indicator, please read Decoding The Hidden Market Rhythm - Part 1: Dynamic Cycles (2017), Chapter 4: "Fine-tuning technical indicators." You need to derive the dominant cycle as input parameter for the cycle length as described in chapter 4.
Hope this helps and good luck.