Customizable Dashboard (SIMPLE)This is a custom table where you can track any ticker and it's daily change. color coded to make things easy.
Easy

Intraday BUY/SELL & AUTO SL (5-min timeframe only) by chaitu50c)Intraday BUY/SELL & AUTO SL (5-min timeframe only) by chaitu50c
This indicator provides intraday traders with BUY/SELL reversal signals and automated SL (Stoploss) tracking, based on a 3-candle reversal block logic — designed to work exclusively on the 5-min timeframe.
Key Features:
• 3-Candle Reversal Logic — Signals are generated when a defined 3-candle reversal pattern is detected (body-close breakout).
• Current Session Only — All signals and SL lines are valid only for the current session and automatically reset at session start.
• BUY/SELL Signal Labels — Visual ▲ and ▼ labels mark valid reversal signals on the chart.
• Dynamic Auto SL Lines — Plots dashed SL lines based on the reversal block's low/high.
• SL HIT Tracking — If SL is broken, the line stops extending and a ‘SL HIT’ label is displayed at the midpoint of the SL line.
• Adjustable Visual Settings — Customize signal label size, SL line width, colors, and more.
• Clean & Lightweight — Optimized for intraday use without cluttering the chart.
How to Use:
You can trade this indicator in two ways:
1. Direct Signal Entry — Take a BUY or SELL trade when a valid ▲/▼ reversal signal forms.
2. SL HIT Re-entry — If an existing SL line is broken and ‘SL HIT’ appears, you can optionally take an opposite side trade in the direction of the SL HIT.
Example:
A BUY signal is generated and an SL line is plotted below.
If price breaks the SL (SL HIT appears), you may consider entering a SELL trade at that point — as it indicates weakness.
Important Notes:
• Works only on 5-min timeframe — Set your chart to 5-min for correct behavior.
• Designed for intraday trading — all signals and SL levels reset at session start.
• Does not carry signals between sessions.
• SL lines and HIT labels provide a clear and simple visual aid for trade management.
---

Enhanced Alligator Trend Indicator By Er. Parvez HaleemPurpose: The Enhanced Alligator Trend Indicator aims to identify strong and reliable buy and sell signals on the price chart by combining the Alligator Indicator with trend strength and volume filters. It is specifically designed for use on a 1-minute chart to enhance precision in short-term trading decisions.
Components:
Alligator Indicator:
Jaw Line (Blue): Calculated as a simple moving average (SMA) of the closing price over a specified period (default: 13 bars). Represents the long-term trend.
Teeth Line (Red): Calculated as a simple moving average (SMA) of the closing price over a shorter period (default: 8 bars). Represents the medium-term trend.
Lips Line (Green): Calculated as a simple moving average (SMA) of the closing price over an even shorter period (default: 5 bars). Represents the short-term trend.
Trend Strength Indicator:
Relative Strength Index (RSI): Measures the strength of the current trend, using a default period of 14 bars. RSI values above 50 suggest a bullish trend, while values below 50 suggest a bearish trend.
Volume Filter:
Volume Threshold: Filters signals based on trading volume to ensure they only appear when volume exceeds a specified threshold (default: 100,000). This helps to avoid low-volume noise and enhance signal reliability.
Additional Trend Filters:
Short-Term SMA: A simple moving average with a default period of 20 bars, used to assess short-term trend direction.
Long-Term SMA: A simple moving average with a default period of 50 bars, used to assess long-term trend direction.
SMA Crossover: A bullish crossover occurs when the short-term SMA is above the long-term SMA, and a bearish crossover occurs when the short-term SMA is below the long-term SMA.
Signal Generation:
Buy Signal: Generated when:
The Lips line is above the Teeth line, and the Teeth line is above the Jaw line (indicating a bullish alignment in the Alligator Indicator).
The RSI is above 50 (indicating strong bullish trend strength).
The trading volume exceeds the specified volume threshold (indicating sufficient trading activity).
The short-term SMA is above the long-term SMA (confirming a bullish trend).
Sell Signal: Generated when:
The Lips line is below the Teeth line, and the Teeth line is below the Jaw line (indicating a bearish alignment in the Alligator Indicator).
The RSI is below 50 (indicating strong bearish trend strength).
The trading volume exceeds the specified volume threshold (indicating sufficient trading activity).
The short-term SMA is below the long-term SMA (confirming a bearish trend).
Plotting on Chart:
Alligator Lines: The Jaw, Teeth, and Lips lines are plotted directly on the price chart in blue, red, and green, respectively, to indicate the long-term, medium-term, and short-term trends.
Buy/Sell Signals: Buy signals are plotted below the price bars in green, and sell signals are plotted above the price bars in red. These signals are marked with labels ("BUY" and "SELL") to clearly indicate trading opportunities.
Debugging: RSI and SMA lines are plotted but hidden by default. They can be revealed for verification purposes to ensure the correctness of the indicator’s calculations.
Alerts:
Buy Alert: Triggers when a buy signal condition is met, sending a notification that a buy opportunity has been identified.
Sell Alert: Triggers when a sell signal condition is met, sending a notification that a sell opportunity has been identified.

Stochastics - Made EasyThis indicator is a visually improved version of Stochastics. It makes it much easier to see what's happening by simplifying those confusing, intersecting lines. With this, you can detect the Stochastics direction more clearly. All the features are also explained in the tooltips of the input fields. Some extra features are included, such as average top and bottom calculation, standard deviation and divergences.
Color legend:
Green: Stoch K Above D and Rising
Light Green: Stoch K Above D and Falling
Red: Stoch K Below D and Falling
Light Red: Stoch K Below D and Rising
Blue: Stoch K Crossover D
Orange: Stoch K Crossunder D
Blue Arrow: Bullish Divergence
Orange Arrow: Bearish Divergence

ADX-DI - Made EasyThis indicator is a visually improved version of ADX. It makes it much easier to see what's happening by simplifying those confusing, intersecting lines. With this, you can detect the ADX direction more clearly. All the features are also explained in the tooltips of the input fields. Some extra features are included, such as average top and bottom calculation and divergences.
Please note that the divergences on ADX are just experimental and are based on calculations, so there is no guarantee the direction will change.

Nightrangers IndicatorDescription
This indicator combines three EMA's, Ichimoku Cloud, RSI and MACD. By combining and modifying their use case this turns into an extremely powerful and accessible indicator for finding long and short position entries, below is a description of how to use this indicator, and what makes it different.
Primary Use case
The three EMA's would be the initial indicators you would be looking at, they are based on the 7d, 25d and 200d MA - Used on their own, they would be worthless, and this is where the Ichimoku Cloud comes into it, I have removed all other aspects of the Ichimoku Cloud and only kept the baseline, combine this with the three MA's and we have a very powerful indicator for finding Long entries, that is used uniquely in a way to which the Ichimoku Cloud is not originally meant to be used for.
An early indication of a LONG entry would be when the 7d MA crosses above the Ichimoku Baseline, through this early indicator, you are able to watch and monitor the chart, you would be waiting to see if the 25d MA then also crosses above the Ichimoku Baseline, This would be the second important indication of a long entry. The 200d MA helps here when making decisions on where to set your own personal take profits - If the Ichimoku baseline, and the MA's are below the 200d MA, you would be expecting a bounce point here, or heavy resistance so the long entry could be over a shorter period, than that if it was above the 200d MA, which is why it is included here, to help make a better informed choice.
The latter is reversed for finding short positions, and entries. This indicator is completely reliant on each other to find the best possible entry/exit by complementing each other, and by using the Ichimoku Baseline on it's own, and not as the Ichimoku Cloud is intended.
Just using these though, is not enough, which is why the RSI and MACD are also combined, once the conditions are met above, You may find that there can be false positives for entries, and this is where the RSI has multiple use cases within this script.
Firstly the backdrop colour will change based on whether the chart is in an uptrend or downtrend, This is a visual indicator provided to work simultaneaously on the chart itself to help identification of entries/exits easier to identify in conjunction with the above.
Secondly, It is used to display in the top right, The current Trend in a text format, as well as if the current chart is in one of three phases, these are Overbrought, Oversold and accumulation.
And finally it will display the current RSI Value on the last candle in a clear to see blue Label, This helps with the visual accessible side, to help you make a more informed choice depending on your own personal tolerance.
This ties into the above Indicators, by combining the information, you would not be looking to take a long, if for example, the RSI showed it was over-brought, and in a downtrend, even if the MA's had crossed above the Baseline, as this would most likely be a fakeout.
However if the Indicators above, showed a potential long, and the backdrop had flipped green, indicating an uptrend, and it was in an accumulation phase, you would consider this position. and this is where the MACD comes into play.
You would use the MACD to see whether or not the Signal line has crossed over the MACD line, and vice versa - However this script uses it to simplify and portray current market sentiment, and visually display by reducing clutter on screen, and making it more accessible.
It is designed to portray an easy to read and understand visual indicator by displaying in the top right simply as Bullish or Bearish, with markers above the candles ( "M" and "MX" ).
The M indicator is to show where the MACD Crosses above the Signal, and if aligned with all the other indicators within the script, shows a very strong confirmation for a buying opportunity, and vice versa for the "MX" indicator if aligned with the other indicators in reverse, provides a very strong confirmation for opening a short position or for selling.
Secondary Use case
By combining the indicators above, the secondary conditions you would be looking for, If you opened a LONG position, would be knowing when to sell, On top of what has been described above already regarding this, you would be looking to start taking profits, when the 7d MA crosses above or across the candles, and looking to close the position, when the 25d MA also crosses above the candles, and respectively, in reverse for closing short positions. This is shown across the charts to be extremely useful, however, combine this with the other indicators, portrayed in an easy to use and understand visual representation, you are now able to make more informed decisions, on whether to close a position or not.
How is it different and not just a mash up
I have combined these indicators to make the world of trading more accessible for everyone regardless of circumstances, by creating an easy to understand visual representation, keeping colours vibrant and easy to stand out, with clear and simple to read text indications. So whether you are a seasoned trader, or just starting out, you can make more informed choices, without the need of learning how to use multiple different indicators, and learning how to combine them all, or if you have difficulties learning, this indicator also simplifies a lot of the more technical intricacies, by still allowing you to make a more informed choice.

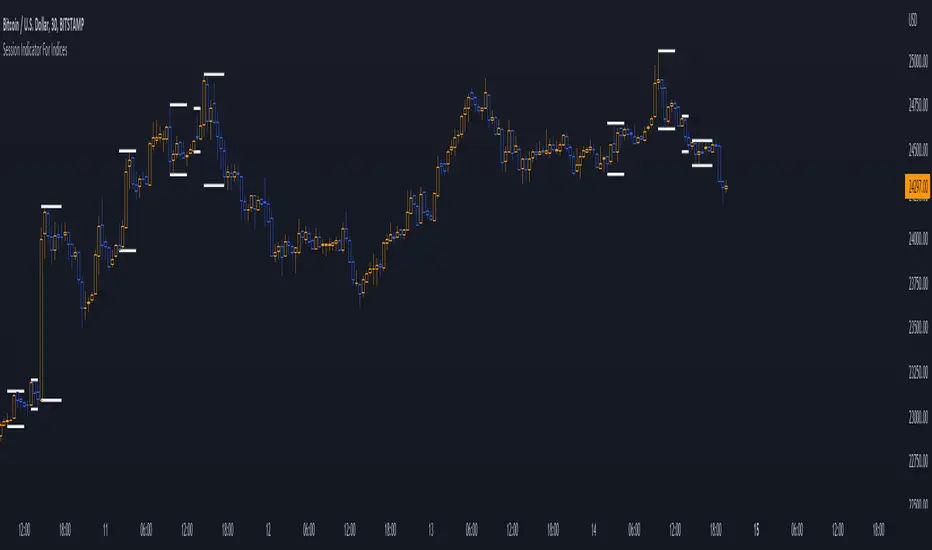
Session Indicator For Indices | @Jonas58328410Welcome guys,
I want to show you the session indicator for indices.
It is an easy, clean, and fast-loading indicator for indice sessions.
The indicator shows you the active sessions and plot those with high lines at the top and low lines at the bottom.
You can modify everything in the settings :
⚙️ Firstly you can modify the timezone, where you live to all supported timezones that tradingview has.
⚙️ Lines can be modified with "line width" and a special tool for backtesting is integrated (max lookback is 500).
⚙️ You can modify all session-related things in the last category.
⚙️ There is a Dashboard, where you can track active sessions.
❗ Note, if you change your timezone, it's recommendable to change the session settings too.
❓If you have any problems, questions, or new feature requests, please send a message in the tradingview comment section!
👌Feedback is greatly appreciated!
👾 Have fun!
consoleLibrary "console"
Simple debug console to print messages from your strategy code.
USAGE :
Make sure your strategy overlay is false
Import the library :
import keio/console/1 as console
init(lines, panes)
Initialise function.
USAGE :
var log = console.init()
Parameters:
lines : Optional. Number of lines to display
panes : Optional. Number of panes to display
Returns: initialised log
print(log)
Prints a message to the console.
USAGE :
log := console.print(log, "message")
Parameters:
log : Mandatory. The log returned from the init() function
Returns: The log
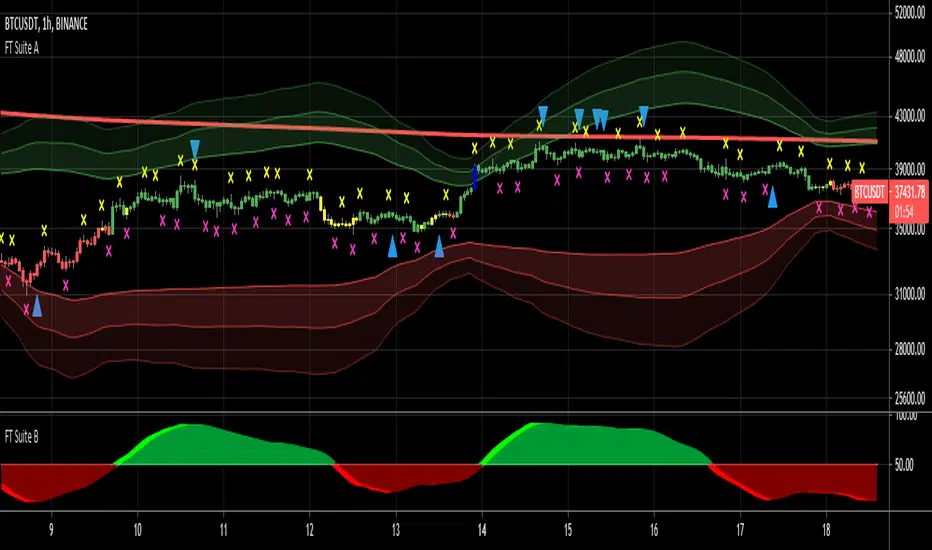
FieryTrading Suite AThis trading suite offers a complete package to traders, both long- and short-term. The idea here is that by combining FieryTrading Suite A and B, one can get a better grip on the markets, thus making more profitable trades. This trading suite is suited for all time frames and assets. Ideally one would combine this trading suite with their own strategies or indicators.
This indicator pack consists of several parts and offers quite some customization.
// FieryTrading Suite A
Bar Trend: the bars will get colored according to the current, short-term, trend. Green is bullish, red is bearish and yellow is neutral. By tweaking the Bar Trend Length one can make the bar trend more or less responsive. Higher lengths are better for long term trading, whereas a shorter length is better for short-term or scalping.
MTF EMA: this is actually two indicators in one. First, we have the EMA on the chart, which is a general current trend indicator. Above the EMA means bullish, under the EMA means bearish. This EMA is also colored according to the long-term trend, which gets pulled from a higher time-frame. Green means long term bullish, red long-term bearish, yellow neutral.
Overshoot Area: the green and red bands around the price are areas where the price might potentially reverse from. This works exceptionally well in consolidating (horizontal) markets. The wider the overshoot area, the stronger the trend. A very tight overshoot area might indicate that the price will soon make a strong move. Increase the overshoot length to make it better suited for long-term. Decrease the length for better detection of small moves.
Extra’s:
1) Extreme bars: when turned on, the bars will color blue if the price reaches a potential strong area of reversal or consolidation. Blue bars are also great areas to exit your current position. Increase the Extreme Multiplier in case you want it less responsive. Decrease the multiplier to quicker spot extreme bars, but with a higher margin of error.
2) FieryTrend: due to its popularity, I’ve decided to included my FieryTrend indicator in the Trading Suite. It’s a great tool to manually find trend lines, resistances and supports. See my FieryTrend indicator for more info.
3) Fractals: when turned on, this option will display fractals on the chart. These fractals are mainly used for stop-loss determination, but can be used for other strategies as well.
4) FT B Reversal: when turned on, this will place reversals of the FieryTrend Suit B on the chart. Make sure to keep the inputs of the FT B indicator the same on both the A and B suite. It might trigger some false-positives, don’t trade this blindly. Wait for the lighter color to completely disappear behind the darker one on FT B.
Alerts: Alerts can be created for Extreme Bars, Bar Trend and FieryTrading Suite B Reversals. Bar trend currently triggers an alert of every bullish / bearish bar, want to make it trigger once in the future, but I’m encountering an unknown bug.
// FieryTrading Suite B
This oscillator tries to give traders an idea of the current trend, as well as trend reversals. The higher the lengths, the bigger the potential trends can become. Be aware that higher lengths are less responsive to market movements. The default inputs are best for most traders. Alerts for this indicator can be made in the FT Trading Suite A, indicated by the blue up / down triangles.
// Potential strategies
There are several potential strategies that one can follow by just looking at the chart. Here are some examples:
1.0 For longer term trades one could simply trade the bar colors. Buy when the bar goes green, sell when it goes red.
1.1 You could exit the trade at either an Extreme Bar or when the price enters the Overshoot Area
1.2 During bullish trends (green bars, green MTF EMA), you could spot potential entries with the FieryTrading Suite B. Enter on every dip on the oscillator. Inverse would be true for shorts.
2.0 You could trade the FT B Reversals during their respective trend. So, trade bearish reversals during a red MTF EMA, bullish reversals during a green MTF EMA.
Never trade one indicator naked. Always use other indicators to confirm your bias.
For take-profit and stop-loss selection I would generally advise to look at the most recent fractal and place the stop above / below the fractal bar. Bullish trades should look at the pink fractal, bearish trades at the yellow fractal. When no fractal is available, look at the reversal bar and apply the same strategy.
For short term trades I’d advise a risk-reward of 1.5, longer term 2 – 2.5.
See the screenshots below for a couple of examples.
For access, please take a look at the "Author's Instructions" below.
Easy TrendThis signal is completely based on analysis and transformation of a single simple moving average. As with all signals and indicators, it should be combined with others.
This is how the signal is built:
1. First it takes the SMA of the closing price.
2. It then takes the ROC of that SMA using a length of 1.
3. It takes an 8-period SMA and also a 64-period SMA of that ROC.
4. These are plotted as follows:
- the ROC is plotted in green when above 0 (trending up) and red when below 0 (trending down).
- the 8-period SMA is plotted as a thin white line within the ROC signal
- the 64-period SMA is plotted as a thick white line within the ROC signal
When the trendline is green, this is a bullish zone. When the trendline is red, this is a bearish zone.
Moving averages (all types of moving averages) are inherently lagging signals. To compensate for that, I am offsetting each SMA series by half of its period. This may be confusing to some, but the end result is a mathematically accurate SMA signal, centered on the signal that it is providing the moving average of. It doesn't stop the lag, but it directly and obviously shows how lagged each signal is, which I personally find better to trade against.
Symbols on the top and bottom of indicator:
Yellow triangle at bottom of indicator shows where a downward trend is starting to bottom out and a buy/long opening may be available soon.
Green triangle at bottom of indicator shows that a downward trend has switched to an upward trend. This indicates a good time to buy.
Yellow triangle at top of indicator shows where an upward trend is starting to plateau and a sell/short opening may be available soon.
Red triangle at top of indicator shows that an upward trend has switched to a downward trend. This indicates a good time to sell.
Note: You may see multiple yellow triangles before seeing a green or red triangle. This can happen when multiple trend accelerations or decelerations occur within an overall green or red zone.
In addition there is a dotted line connecting the end of the 64-period SMA to the end of the 8-period SMA. This indicates the direction the trend is moving towards. When the dotted line crosses the zero line, this portrays a rough estimate of where the trend may switch from a downtrend to an uptrend or vice versa. This is the "best" time to buy or sell, depending on your strategy.
I recommend placing a SMA on your candles set to the same window size as this indicator, and also to offset that SMA to the left by half its window size. For example, a 90-period SMA should be offset by -45 periods. That will cause it to be correctly aligned with this trend signal.

MA200W buy sell BTC ColoredA script to help you plan your entrances and exits with beautiful colors for BTC. It just helps to better highlight the gap between the start of the week and the end.
It only work on Weekly.
Info :
Blue ... you can wait, enjoy your life
Green is when you buy
Yellow when you enter bull market
Orange is when you begin to take care of next week
Red when you begin to sell low part
White, if while a week you see white you can sell bigs bags, if it end with White you can close majors positions
Warning White may not appear, if second week after first Red week is not White you can sell large position
Good luck and take a breath

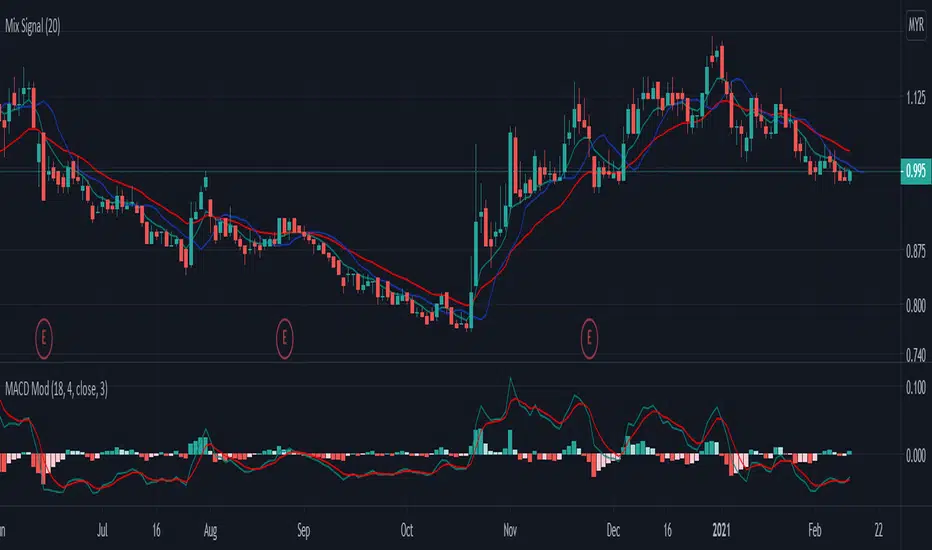
Mix signal-rileksdevMix Signal Indicator by rileksdev
Indikator ini mengandungi
-3 line bewarna hjau,merah,biru
-1 indikator MACD yang sudah diubahsuai supaya boleh mengesan pergerakan awal harga akan turun atau naik.
-Support & Resistance sudah tersedia pada chart,jadi tidak perlu susah payah cari sendiri
-Buy signal & Sell signal yang keluar apabila harga akan membuat kenaikan atau penurunan
Cara guna:
Line biru: digunakan untuk intraday timetrame 5minit.
Line hijau & merah digunakan untuk Intraday pada timeframe 15minit timeframe 30minit untuk swing short term atau midterm.
MACD MOD untuk mengesan pergerakan awal harga akan turun atau naik.
Garis bintik hijau(Support) & Garis bintik merah (Resistance) yang sudah tersedia pada Chart
Buy signal apabila harga akan membuat kenaikan
Sell signal apabila harga akan membuat penurunan
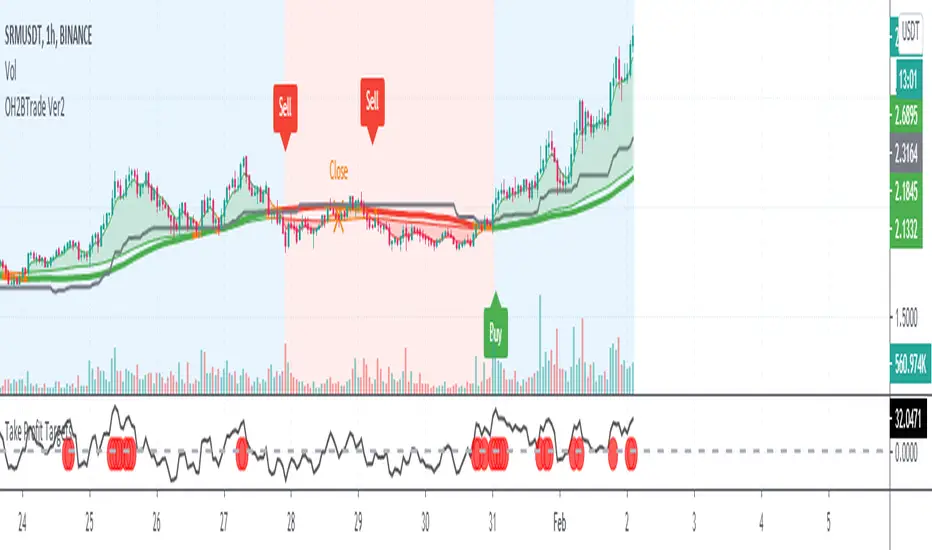
OH2B Trading Indicator for Swing TradingOH2B Trading Indicator
The OH2B Trading Indicator is an indicator built for advanced traders.
It gives you entry points for BUY and SELL based on Trend Channel and Ema-Crossover.
It offers you a higher frequency of signals for swing trading.
The Take-Profit Indicator gives you exit points for taking profits based on the Average Directional Index and Relative Strength Index.
Trading with Both Indicators
Orange Zone : Wait for the next signal from OH2B Trading Indicator.
The OH2B Trading Indicator gives you entry points for BUY or SELL .
When the ema1 crosses above ema2, the trend channel will be painted GREEN in color, and a BUY signal will appear. = BUY
When the ema1 crosses below ema2, the trend channel will be painted RED in color, and a SELL signal will appear. = SELL
When a BUY or SELL signal appears on the chart, don't rush into any trade.
Please allow a few hours for confirmation of signals .
To take profit, please follow the Take-Profit Indicator at the bottom.
RED dots are the Take-Profit targets for the BUY (long) signal
GREEN dots are the Take-Profit targets for the SELL (short) signal
*After taking profit, please set a Stoploss to at least break-even level to protect your profits.
When the price enters the Orange Zone again, you may close your trade and wait for the next signal.
If you like to keep your positions at Orange Zone, please remember to set a stop-loss alert when an opposite signal pops up on the chart.
Often the price goes to the Trendline after the signal, so keep some funds to increase the position or even open all position near the Trendline , or use it for re-enter with SL after you closed position on TPs.
Tips for the traders:
Recommended using the indicators at 1H Timeframe .
Recommended using the indicators for Spot Trading at both Crypto and Stock Market.
Do not use leverage above 5x.
No more than 5% of the deposit in one trade.
Try to enter/exit a position by limit orders.
Do not rush into any trade when a new signal pops up, please allow a few hours for confirmation of signals.
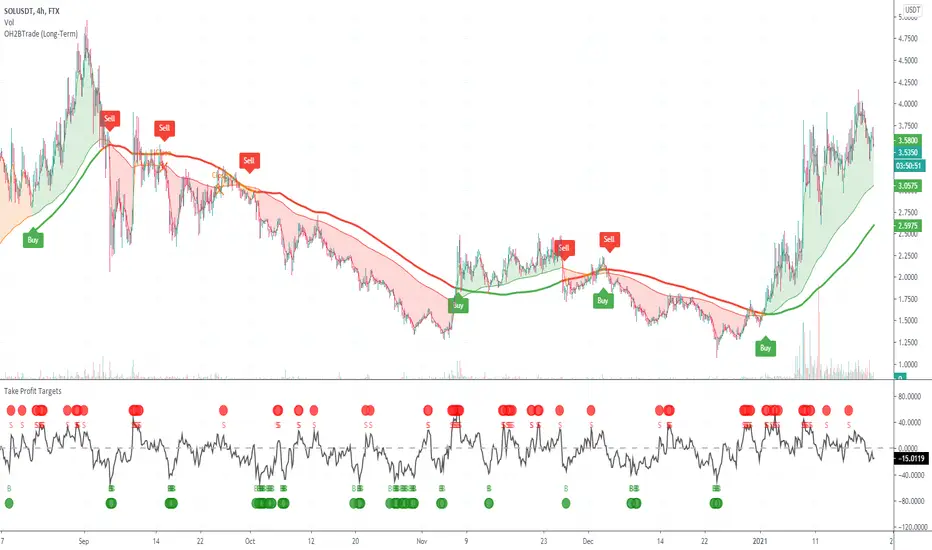
OH2B Trading Indicator for Long-Term TradingOH2B Trading Indicator
The OH2B Trading Indicator is an indicator built for beginners.
It gives you entry points for BUY and SELL based on Trend Channel and Ema-Crossover.
The Take-Profit Indicator gives you exit points for taking profits based on the Average Directional Index and Relative Strength Index.
Trading with Both Indicators
Orange Zone : Wait for the next signal from OH2B Trading Indicator.
The OH2B Trading Indicator gives you entry points for BUY or SELL .
When the ema1 crosses above ema2, the trend channel will be painted GREEN in color, and a BUY signal will appear. = BUY
When the ema1 crosses below ema2, the trend channel will be painted RED in color, and a SELL signal will appear. = SELL
When a BUY or SELL signal appears on the chart, don't rush into any trade.
Please allow a few hours for confirmation of signals .
To take profit, please follow the Take-Profit Indicator at the bottom.
RED dots are the Take-Profit targets for the BUY (long) signal
GREEN dots are the Take-Profit targets for the SELL (short) signal
*After taking profit, please set a Stoploss to at least break-even level to protect your profits.
When the price enters the Orange Zone again, you may close your trade and wait for the next signal.
If you like to keep your positions at Orange Zone, please remember to set a stop-loss alert when an opposite signal pops up on the chart.
Often the price goes to the Trendline after the signal, so keep some funds to increase the position or even open all position near the Trendline , or use it for re-enter with SL after you closed position on TPs.
Tips for the beginners:
Recommended using the indicators at 4H Timeframe .
Recommended using the indicators for Spot Trading at both Crypto and Stock Market.
Do not use leverage above 5x.
No more than 5% of the deposit in one trade.
Try to enter/exit a position by limit orders.
Do not rush into any trade when a new signal pops up, please allow a few hours for confirmation of signals.
Plutus eXploration Index - PXIGreetings Fellow Traders!
We have developed this simple and easy to use indicator so that all users can benefit from it by:
• Reducing the amount of time spent trading.
• Minimizing the risk of loss.
• Accurate timing on entries and exits.
• Signals are accurate in volatile market conditions.
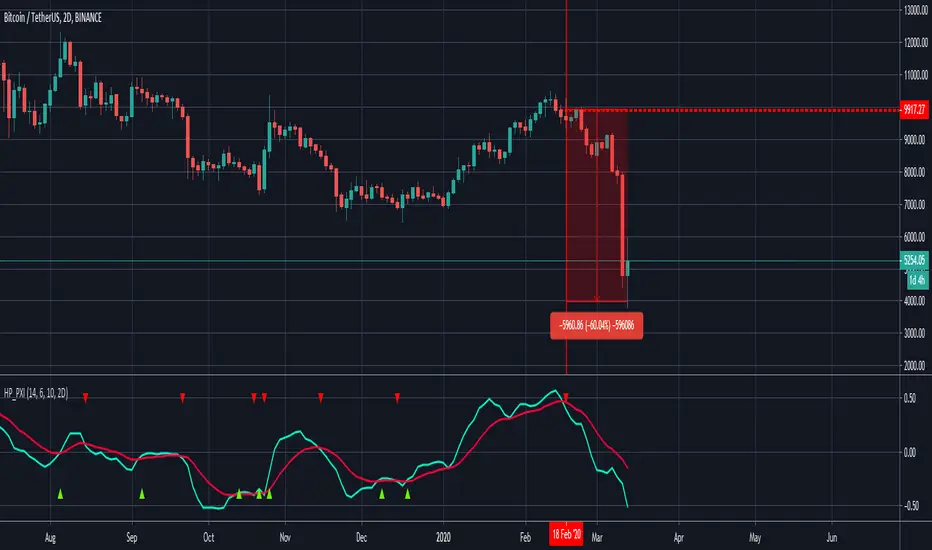
What is the PXI?
The Plutus eXploration Index falls under the centred momentum oscillator category which means that it fluctuates above and below a central point or line. Apex levels exist, where the indicator will reach a peak, and start moving in the opposite direction. Two lines move in unison and crossovers will signal a buy and a sell.
Setting up the indicator:
Once you have received your invite, the indicator will appear under your "my invite only" scripts in trading view detailed charts screen. Select PXI and add it to your chart. For free accounts on TradingView, the indicator limit is set to x3, so please de-activate something if you hit this limit.
You can access the PXI setting in the string of icons that follow after the indicators name in the top left corner of the indicator chart. In order:
Name | Visibility | Settings | Show source code | Delete | More
Under the settings, there are two tabs. One for the style, which you may freely change to suit your preferences. And then the first tab, for Inputs. The default settings for Long Minima, Short Maxima and Integrated EMA should not be changed.
The critical change to make in the input settings is the time frame !
The time frame on the price chart and the time frame on the indicator have to match! The range of allowable time frames is as follows:
15min | 30min | 1h | 4h | 12h | 1d | 2d | 1week
How to use the PXI:
The apex levels on the oscillator differ for each asset and vary depending on the selected time frame. The signals provided near apex points shall hold more weight. We recommend that traders assess these levels properly before considering a position.
Sell signal: Sell signals occur when the quick line (default blue) crosses over the slow line (default orange) from above.
A red arrow down will mark this point in time out on the chart.
Buy signal: Buy signals occur when the quick line (default blue) crosses the slow line (default orange) from bellow.
A green arrow down will mark this point in time out on the chart.
Maximizing Risk/Reward and profitability:
The indicator strives to keep positions open long enough to reap real rewards in the market. Maximum profit levels naturally occur around the apex points on the indicator chart, and the onus is on the trader to attempt an early exit once these levels are achieved.
Addition points to consider:
Most profitable trading signals occur on the daily time frames while considering the duration of trades and timing of the signals. For the lowest risk levels, weekly time frames are most suitable. From the weekly time frame down, the risk increases incrementally until you reach the 15min time frame. Signals at the lower levels occur more often and they are effective but, they should, however, be monitored closely. Also, the lower the time frame, the higher the chances of false-positive signals.
will not be liable for damages of any kind resulting from your use of or inability to use the indicator or content.
Mr. Pips SuperTrend Power PipperMr. Pips is proud to bring his Proprietary Price Action Trading Indicator to the masses. This easy to use script works on all time frames and all stocks, commodities, indices, etc.... Mr. Pips has developed this indicator to help the most novice trader achieve returns. Buy when the trendline turns green and move your trailing stop-loss up as the price goes up. Conversely, Short when the trendline turns red and move your trailing stop-loss down as the price moves down. It's that simple. When the price repeatedly re-tests the trendline, whether it be support or resistance, this is another good place to open a position. This script works on all time-frames. You can use it to scalp small pips when volatility is low, and it is recommended to use this script on higher time-frames(60-240min) when volatility is high. Mr. Pips hopes you're having a profitable Day!!!
Mr. Pips' quote of the day:
"Pippin ain't dead it just moved to the web!"
RIP Pimp C

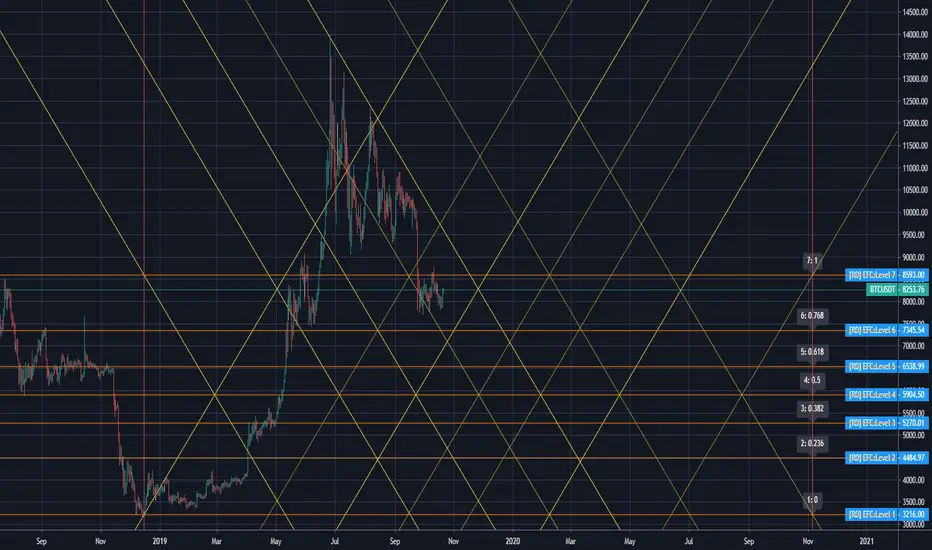
[RD] Easy Fibonacci Channels==================================================================
October 21 2019 - Easy Fibonacci Channels - by RootDuk
==================================================================
Easy adaptable fibonacci channels. By changing the levels you can adapt
the lines as needed. There's also global params to use for horizontal and
vertical scaling.
===================================================================
Notes
===================================================================
None so far
===================================================================
Updates
===================================================================
Non so far
Dragon-Bot - Default ScriptDragon-Script is a framework to make it as easy as possible to test your own strategies and set alerts for external execution bots. This is the alerts version of the script.
The script has many features build in, like:
1) A ping/pong mechanism between longs and shorts
2) A stop-loss
3) Trailing Stops with several ways to calculate them.
4) 2 different ways to flip from long to short.
The script is divided into several parts.
The first part of the script is used to set all the variables. You should normally never change the first part except for the comments at the top.
The second part of the script is the part where you initialise all your indicators. Several indicators can be found on Tradingview and on other sites. Please keep in mind that all the variable names used in the indicator should be unique. (all the … = … parts)
The third part of the script, is the most important part of the script. Here you can create the entry and exit points.
Let’s look at the OPENLONG function to explain this part: The first variables are all the possible entries; These are longentry1 till longentry5. You can add many more if you like.
The variables are all initialised as being false. This way the script can set a value to true if an entry happens.
The if function is the actual logic: You could say “if this is true” then (the line below the if function) longentry1 := (becomes) true.
In this case we have said: “if this is true” then (the line below the if function) longentry1 := (becomes) true when the current close is larger than the close that is 1 back.
The last part is the makelong_funct. This part says that if any of the entries are true, the whole function is true.
The last part of the script is the actual execution. Here the alerts are plotted and the back test strategies are opened and closed.
We hope you guys like it and all feedback is welcome!

Dragon Bot - Default ScriptDragon Script is a framework to make it as easy as possible to test your own strategies and set alerts for external execution bots.
The script has many features build in, like:
1) A ping/pong mechanism between longs and shorts
2) A stop-loss
3) Trailing Stops with several ways to calculate them.
4) 2 different ways to flip from long to short.
The script is divided into several parts.
The first part of the script is used to set all the variables. You should normally never change the first part except for the comments at the top.
The second part of the script is the part where you initialise all your indicators. Several indicators can be found on Tradingview and on other sites. Please keep in mind that all the variable names used in the indicator should be unique. (all the … = … parts)
The third part of the script, is the most important part of the script. Here you can create the entry and exit points.
Let’s look at the OPENLONG function to explain this part: The first variables are all the possible entries; These are longentry1 till longentry5. You can add many more if you like.
The variables are all initialised as being false. This way the script can set a value to true if an entry happens.
The if function is the actual logic: You could say “if this is true” then (the line below the if function) longentry1 := (becomes) true.
In this case we have said: “if this is true” then (the line below the if function) longentry1 := (becomes) true when the current close is larger than the close that is 1 back.
The last part is the makelong_funct. This part says that if any of the entries are true, the whole function is true.
The last part of the script is the actual execution. Here the alerts are plotted and the back test strategies are opened and closed.
We hope you guys like it and all feedback is welcome!

1hTriLine, so much power, so easy to use....So many nuances to this one. So many powerful strategies to devise. Responsive. Accurate. Easy to use. Everything you can expect from one of my scripts. Trading made easy.
1hHist, easy to follow and use.My point n click easy Hist, now on the 1hr chart. Super easy to use. Accurate. Guaranteed to have you in early, and out in profit.

Arkads HelpThis is a tool used to help inexperienced traders get successful trades. I accept tips as i will continue to update this tool. Thank you. Apply it to the chart, and follow the buy and sell signals. i will continue to update this, making it more accurate and adding more features. Using this with your own TA will make it unstoppable. Buy on signals on trendlines, sell at top. With more updates, i will lessen the amount of signals to make them stronger.
/// BTC --- 1PSWjCpPXQ3uHjdVUJWR5y2Q6aCa3X8Jog
/// XRP --- rEb8TK3gBgk5auZkwc6sHnwrGVJH8DuaLh TAG 107248818
/// TRX --- TEjoZ3qnGxqZBLAfn7z9iAkhjV79MV3F5h
/// ETH --- 0xf5fb4c8e9ff6bf3f0df1648ab4a355b199611c91

Double CCI & RSI AlertHi, I am lonelygrass. It is suggested to use this indicator with my another script, Double CCI & RSI Trigger , . This EA consists of a CCI of 34 periods and RSI of 14 periods.
The alert is created in hopes of distinguishing super short term trend and helping scalping.
In general, triangleup (bullish) and triangledown (bearish) are shown near each bars.
A qualifying bullish bar should (1) have a CCI value equaling 0 or more and (2) have a RSI value equaling 55 or more
Instead, a bearish bar should (1) have a CCI value below 0 and (2) have a RSI value below 45
If you put two systems together, you will get an idea of when to initiate your trade and how to hold onto your trade until a counter signal comes off the graph.
