VWAP + EMA shows the VWAP + EMA 9/20/50/100/200 all in one indicator... you can adjust VWAP's calculation method + color + the outer bands or remove them.. can remove fill as well.. personally i just keep the VWAP
Educational

Pro Maker All in One - FreePro Maker All in One - Free
This indicator provides a simple yet powerful setup combining EMA20, EMA50, and SMA50 trend analysis in one place.
📊 Features:
Dynamic color changes for SMA50 based on trend (Green = Uptrend, Red = Downtrend).
Optional EMA20 & EMA50 with auto color (Blue = Bullish, Pink = Bearish).
Helps identify early trend reversals and overall market direction.
⚙️ Usage:
Enable or disable EMAs/SMA as per your trading style. Works on all timeframes and instruments (stocks, indices, crypto).
💡 Note:
This is a free educational tool designed for learning and basic technical trend analysis. It does not generate buy/sell signals and should not be considered financial advice.

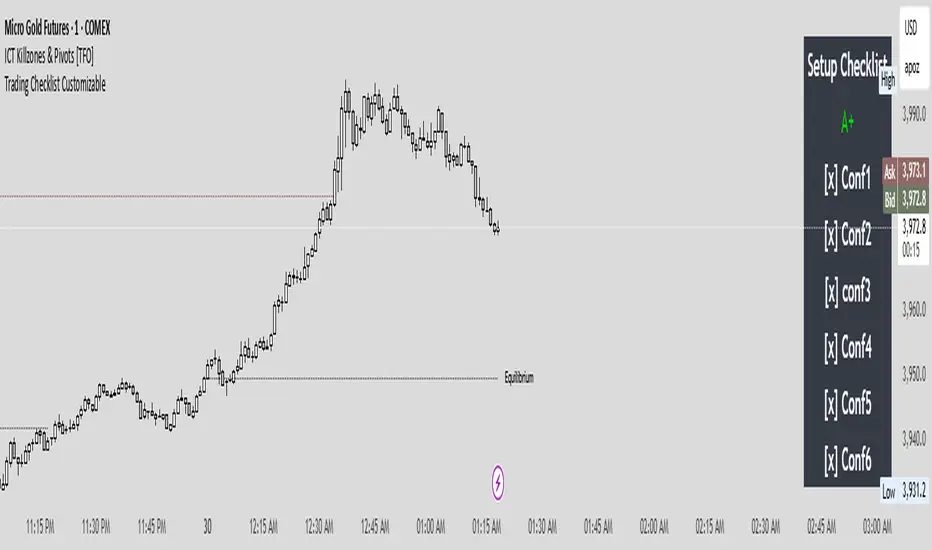
Trading Checklist CustomizableThis Strategy Checklist is a simple but powerful tool designed to help traders follow a structured confirmation process before entering trades. It provides a customizable checklist of confluences that can be edited directly in the settings — ensuring consistency, discipline, and clarity in your trading plan.
This script doesn’t generate signals automatically; instead, it serves as a trader’s personal decision framework. Perfect for ICT-style, price action, or smart money traders who rely on multi-factor confirmations like liquidity sweeps, PD Arrays, and SMTs.
Where it says Conf1 it is customizable to fit your own confluences/entry.
No-Trade Zones UTC+7This indicator helps you visualize and backtest your preferred trading hours. For example, if you have a 9-to-5 job, you obviously can’t trade during that time — and when backtesting, you should avoid those hours too. It also marks weekends if you prefer not to trade on those days.
By highlighting no-trade periods directly on the chart, you can easily see when you shouldn’t be taking trades, without constantly checking the time or date by hovering over the chart. It makes backtesting smoother and more realistic for your personal schedule.

Lynie's V9 SELL🟢🔴 Lynie’s V8 — BUY & SELL (Mirrored, Interlocking System)
Lynie’s V8 is a paired long/short engine built as two mirrored scripts—Lynie’s V8 BUY and Lynie’s V8 SELL—that read price the same way, flip conditions symmetrically, and manage trades with the exact logic on opposite sides. Use either one standalone or run both together for full two-sided automation of entries, re-entries, caution states, and adaptive SL/TP.
✳️ What “mirrored” means here
Supertrend Tri-Stack (10/11/12):
BUY: ST10 primary pierce; ST12 fallback; “PAG Buy” when price pierces any ST while above the other two.
SELL: Exact inverse—ST10 primary pierce down; ST12 fallback; “PAG Sell” when price pierces any ST while below the other two.
Re-Enter Clusters:
BUY: Ratcheted up (Heikin-Ashi green holds/tightens).
SELL: Ratcheted down (Heikin-Ashi red holds/tightens).
Both sides use the same cluster age/decay math, care penalties, session awareness, and fast-candle tightening.
Care Flags (context risk):
Ichimoku, MACD, RSI combine into single and paired flags that tighten or widen offsets on both sides with the same scoring.
VWAP–EMA50 (5m) cluster gate:
Identical distance checks for BUY/SELL. When the mean cluster is present, offsets and labels adapt (tighter/“riskier scalp” messaging).
Golden Pocket A/B/C (prev-day):
Same fib boxes & labeling (gold tone) on both sides to call out TP-friendly zones.
SL/TP Envelope:
Shared dynamic engine: per-bar decay, fast-candle expansion, and care-based compress/relax—all mirrored for up/down.
Caution Labels:
BUY side prints CAUTION SELL if HA flips red inside an active long cluster.
SELL side prints CAUTION BUY if HA flips green inside an active short cluster.
Same latching & auto-release behavior.
🧠 Core workflow (both sides)
Primary trigger via ST10 pierce (structure shift) with an ST12 fallback when ST10 didn’t qualify.
PAG Mode when price is already on the right side of the other two STs—strongest conviction.
Cluster phase begins after a signal: ratcheted re-entry level, session-aware offsets, dynamic tightening on fast bars.
Care system shapes every re-entry & SL/TP label (Ichi/MACD/RSI combos + VWAP/EMA gate + QQE).
Protective layer: SL-wick and SL-body logic, caution flips, and “hold 1 bar” cluster carry after SL to avoid whipsaw spam.
🔎 Labels & messages (shared vocabulary)
Lynie’s / Lynie’s+ / Lynie’s++ — strength tiers (ST12 involvement & clean context).
Re-Enter / Excellent Re-Enter — cluster pullback quality; ratchet shows the “must-hold” zone.
SL&TP (n) — live offset multiplier the engine is using right now.
CAUTION BUY / CAUTION SELL — HA flip against the active side inside the cluster.
Restart Next Candle — visual cue to re-arm after a confirmed signal bar.
⚡ Why run both together
Continuity: When a long cycle ends (SL or caution degradation), the SELL engine is already tracking the inverse without re-tuning.
Symmetry: Same math, same signals, opposite direction—no hidden biases.
Coverage: Trend hand-offs are cleaner; you don’t miss early shorts after a long fade (and vice versa).
🔧 Recommended usage
Intraday futures (ES/NQ) or any liquid market.
Keep the VWAP–EMA cluster ON; it filters FOMO chases.
Honor Caution flips inside cluster—scale down or wait for the next clean re-enter.
Treat Golden Zones as TP magnets, not guaranteed reversals.
📌 Notes
Both scripts are Pine v6 and independent. Load BUY and SELL together for the full experience.
All offsets (re-enter & SL/TP) are visible in labels—so you always know why a zone is where it is.
Alerts are provided for signals, re-enter hits, caution, and SL events on both sides.
Summary: Lynie’s V8 BUY & SELL are vice-versa twins—one framework, two directions—delivering consistent entries, adaptive re-entries, and contextual risk management whether the market is pressing up or breaking down.

Smart Dollar Cost Averaging DashboardThis closed-source TradingView indicator implements a comprehensive Dollar Cost Averaging (DCA) savings plan simulation designed to automate systematic investments. The script allows users to set a fixed investment amount and choose a customizable interval—weekly, monthly, or quarterly—at which purchases are simulated against historical or live price data. The core functionality calculates the average buy-in price dynamically by tracking cumulative invested capital and total acquired shares, providing a true average cost basis rather than simple price signals. This average price is visualized as a persistent, non-draggable horizontal line on the chart, enabling traders to intuitively compare the market price to their average entry point. A movable and toggleable dashboard accompanies the indicator, delivering real-time metrics including total investment, number of purchases, portfolio value, profit/loss both in absolute and percentage terms, and the price gap relative to the computed average buy-in. This transparency helps users understand their position’s health and supports disciplined long-term investment strategies. This script stands unique by combining flexible periodic investment scheduling with real capital calculations and detailed, easy-to-read visual feedback that is rarely bundled so intuitively in similar scripts. Unlike many open-source trend-following or scalping tools, this indicator focuses on systematic investment and passive portfolio growth, ideal for investors pursuing dollar cost averaging. Unlike standard buy/sell signal creators or simplistic moving average crossovers, this script models actual cash flow deployment and quantifies performance in real-time with a clean, professional UI. Its originality lies in marrying realistic capital flow simulation with intuitive visualization and multi-interval flexibility.
How It Works:
Tracks virtual investments of fixed cash amounts at user-defined intervals Converts invested amounts into shares based on closing prices, accumulating holding size Recalculates weighted average purchase price after each simulated buy Continuously displays the average buy-in as a stable graphic element on any price chart Offers detailed investment metrics through an interactive dashboard overlay Supports weekly, monthly, and quarterly investment cadences with user-selectable investment days Use Cases: Ideal for investors employing systematic savings plans to build long-term positions Fits cryptocurrency, stock, ETF, and index investments on TradingView Supports financial education by illustrating dollar cost averaging principles visually Facilitates performance tracking for passive investors who prioritize consistent buying over timing The script is an advanced tool meeting a distinct trading niche: systematic, cash-based, passive investment modeling with transparency and user control. This originality and usefulness justify the closed-source mode to protect intellectual property.

Scissors&Knifes V3.1✂️ The Scissors (PAG Chop V4 Engine)
🧠 Core idea
Scissors measure market compression and breakout readiness.
They use a modified Choppiness Index that looks at the relationship between:
True Range volatility (ATR × period length)
The total high–low range over the same window.
The smaller the ratio (sum of TR vs range), the more directional and impulsive the market is.
The higher the ratio, the more “sideways” the market trades.
This version smooths the result over PAG_SMOOTHLEN bars and applies several color bands that correspond to volatility states.
🎨 Color code meaning
Range State Color Interpretation
≤ 30 Strong Red #8B0000 Momentum exhaustion on downside, sellers dominating — about to reverse or already strong down-trend.
30 – 38 Brick Red #A52A2A Fading downside pressure; often the “bleeding edge” of a bearish climax.
38 – 55 Transparent black (α≈100) Neutral chop zone — indecision, range-building.
55 – 61.8 Yellow (optional) #DAA520 Early compression pocket where volatility starts contracting; the calm before a trend.
61.8 – 70 Bright Green #556B2F Energy release phase: volatility breaking out upward.
≥ 70 Strong Green #355E3B Sustained bullish drive, often continuation leg of a trend.
🪶 Secret nuance:
The transition bands (38–45 and 45–55) are treated as fully transparent to mark “dead zones.”
When PAG Chop sits here, all label activity pauses — the system resets its cluster memory so the next colored print begins a new “cluster”, letting you clearly see where fresh directional momentum starts.
🧩 Cluster logic
Every time a colored (non-transparent) reading appears, it belongs to a “color cluster.”
Grey labels (= count 1) mark the genesis of a new cluster, and following counts 2, 3, 4 … represent the internal continuity of that trend state.
You can optionally hide the first N grey or count 2 labels to reduce clutter on the initial stabilization bars.
✂️ Label meaning
Each label shows:
Emoji ✂️
Current count (e.g. ✂️ = 3 means 3 timeframes are simultaneously firing)
Optional list of the timeframes that contribute.
So a high count (e.g. 8–10) means many lower TFs are synchronizing volatility breakout — a multiframe alignment, often just before an acceleration burst.
🔪 The Knife (Mr Blonde V4 Engine)
🧠 Core idea
Mr Blonde converts the slope of a long EMA into an angle-of-attack metric — literally the “tilt” of market momentum.
It computes the EMA gradient relative to price span and rescales it into degrees (-5 ° to +5 °).
The steeper the angle, the stronger the directional push.
🎨 Color code meaning
Angle range Color Interpretation
≥ +5 ° Transparent (Black 1) Fully over-extended up move — wait for reset.
+3.57 – +5 ° Dark Red Strong upward slope, momentum apex.
+2.14 – +3.57 ° Orange Medium upward slope, trend acceleration zone.
+0.71 – +2.14 ° Light Orange Mild upward bias, pre-momentum phase.
0 to -0.71 ° Yellow Neutral transition.
-0.71 – -2.14 ° Olive Green Soft bearish slope.
-2.14 – -3.57 ° Olive Drab Building bearish momentum.
-3.57 – -5 ° Hunter Green Strong downward angle, aggressive push.
≤ -5 ° Transparent (Black 2) Oversold/over-tilted — likely exhaustion.
🪶 Secret nuance:
Mr Blonde uses a “span normalization” factor that divides EMA slope by the dynamic range of highs and lows.
This lets it compare angles fairly across assets with different volatility profiles (e.g. BTC vs ES) — it’s one of the rare EMA-angle implementations that self-scales properly.
🗡 Label meaning
Emoji 🔪
Count = how many TFs share the same momentum angle bias.
When many TFs show the same slope polarity (e.g. knife = 8), you’re in a deep momentum cascade — a “knife trend.”
💫 Yellow knife
The yellow state marks neutrality or slope flattening.
If you enable yellow visibility (mb_show_yellow), you can see where momentum cools off — often the earliest reversal hint.
⚙️ Shared mechanics between ✂️ and 🔪
Multi-timeframe sweep
The script cycles through 1 m → 10 m by default, running both engines once per TF.
Each returning true adds +1 to the count.
So:
sc_hits = count of timeframes where PAG fires + 1
knife_hits = count of timeframes where MB fires + 1
That “+1 shift” means there’s always at least 1, letting count = 1 represent the local TF itself.
Cluster limiter
If Limit max labels per cluster is on, you cap how many total symbols (both ✂️ & 🔪, including trails) can appear within one color phase — avoiding chart spam during extended trends.
Trails
Each printed label seeds a short-lived “trail” sequence — faded copies extending N bars forward.
Trails visualize the linger effect of the last signal, useful for visually connecting bursts in momentum.
Grey or count = 1 labels can have shorter or longer trails depending on your overrides (*_trail_bars_grey).
They’re purely visual and do not affect alerting.
Alerts
Alerts fire independently of whether you hide labels — unless you enable “respect filters”.
This guarantees you never miss a structural signal even if you suppress visuals for clarity.
🌈 Interpreting Both Together
Scenario Interpretation
✂️ = low (1–2) + 🔪 rising (red/orange) Market just leaving chop, early thrust stage.
✂️ = high (≥ 5) + 🔪 green Fully aligned breakout continuation — trend in progress.
✂️ = yellow cluster + 🔪 yellow Volatility squeeze, energy buildup — next expansion near.
✂️ = green cluster → 🔪 turns red Cross-state conflict; likely transition or correction.
✂️ = grey + 🔪 grey Reset condition — both engines cooling; stand aside.
💡 Hidden edge:
Scissors signal potential, Knife measures kinetic force.
The perfect storm is when ✂️ goes from yellow→green one bar before 🔪 shifts from orange→green — it catches the birth of directional flow while volatility is still tight.
🧭 Reading the labels intuitively
Grey ✂️/🔪 = 1 → embryonic state, may fizzle or bloom.
✂️/🔪 = 2 or 3 → expansion taking hold.
✂️/🔪 ≥ 4 (mid black) → strong synchronized drive across TFs.
Transparent gap → cluster reset; prepare for new phase.
Trail lines → echo of previous cluster strength.
Final secret tip 🗝
Because both engines are mathematically uncorrelated (volatility vs EMA angle), when they agree in color polarity on multiple TFs, you have one of the cleanest probabilistic trend windows possible.
If you ever see ✂️ = 6 + 🔪 = 6 both pointing the same way — that’s a “knife-through-the-scissors” moment: volatility expansion and directional slope synchronized — those are the bars where institutional algorithms tend to add size.

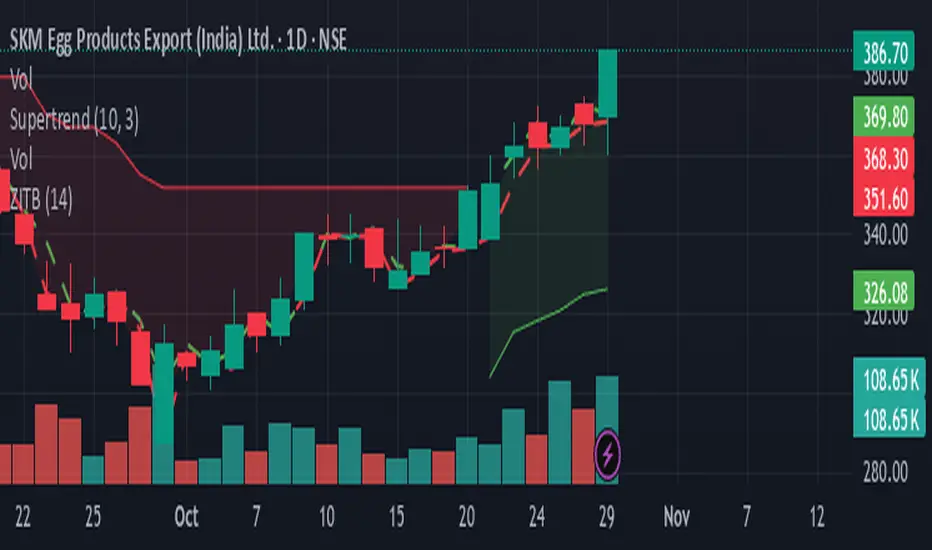
Zarattini Intra-day Threshold Bands (ZITB)This indicator implements the intraday threshold band methodology described in the research paper by Carlo Zarattini et al.
Overview:
Plots intraday threshold bands based on daily open/close levels.
Supports visualization of BaseUp/BaseDown levels and Threshold Upper/Lower bands.
Optional shading between threshold bands for easier interpretation.
Usage Notes / Limitations:
Originally studied on SPY (US equities), this implementation is adapted for NSE intraday market timing, specifically the NIFTY50 index.
Internally, 2-minute candles are used if the chart timeframe is less than 2 minutes.
Values may be inaccurate if the chart timeframe is more than 1 day.
Lookback days are auto-capped to avoid exceeding TradingView’s 5000-bar limit.
The indicator automatically aligns intraday bars across multiple days to compute average deltas.
For better returns, it is recommended to use this indicator in conjunction with VWAP and a volatility-based position sizing mechanism.
Can be used as a reference for Open Range Breakout (ORB) strategies.
Customizations:
Toggle plotting of base levels and thresholds.
Toggle shading between thresholds.
Line colors and styles can be adjusted in the Style tab.
Intended for educational and research purposes only.
This indicator implements the approach described in the research paper by Zarattini et al.
Note: This implementation is designed for the NSE NIFTY50 index. While Zarattini’s original study was conducted on SPY, this version adapts the methodology for the Indian market.
Methodology Explanation
This indicator is primarily designed for Open Range Breakout (ORB) strategies.
Base Levels
BaseUp = Maximum of today’s open and previous day’s close
BaseDown = Minimum of today’s open and previous day’s close
Delta Calculation
For the past 14 trading days (lookbackDays), the delta for each intraday candle is calculated as the ab
solute difference from the close of the first candle of that day.
Average Delta
For a given intraday time/candle today, deltaAvg is computed as the average of the deltas at the same time across the previous 14 days.
Threshold Bands
ThresholdUp = BaseUp + deltaAvg
ThresholdDown = BaseDown − deltaAvg
Signals
Spot price moving above ThresholdUp → Long signal
Spot price moving below ThresholdDown → Short signal
Tip: For better returns, combine this indicator with VWAP and a volatility-based position sizing mechanism.
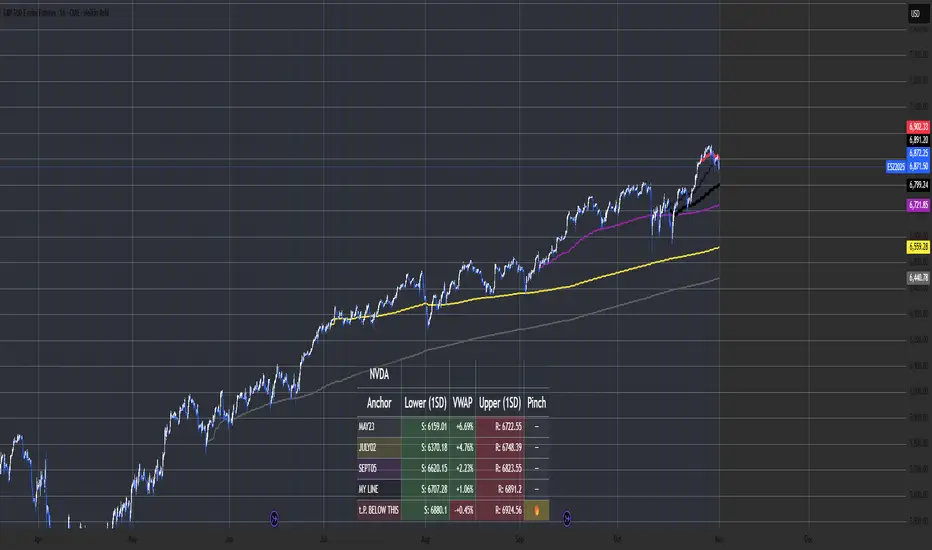
Multi-Anchor VWAP Deviation Dashboard Overview
Multi-Anchor VWAP Deviation Dashboard (Optimized Global) is an overlay indicator that computes up to five user-defined Anchored Volume Weighted Average Prices (AVWAPs) from custom timestamps, plotting their lines and displaying real-time percentage deviations from the current close. It enables precise analysis of price positioning relative to key events (e.g., earnings, news) or periods (e.g., weekly opens), with a compact dashboard for quick scans. Optimized for performance, it uses manual iterative calculations to handle dynamic anchor changes without repainting.
Core Mechanics
The indicator focuses on efficient AVWAP computation and deviation tracking:
Anchor Configuration: Five independent anchors, each with a name, UTC timestamp (e.g., "01 Oct 2025 00:00" for monthly open), show toggle, and color. Timestamps define the calculation start—e.g., AVWAP1 from "20 Oct 2025" onward.
AVWAP Calculation: For each enabled anchor, it identifies the first bar at/after the timestamp as the reset point, then iteratively accumulates (price * volume) / total volume from there. Uses HLC3 source (customizable); handles input changes by resetting sums on new anchors.
Deviation Metric: For each AVWAP, computes % deviation = ((close - AVWAP) / AVWAP) * 100—positive = above (potential resistance), negative = below (support).
Visuals: Plots lines (linewidth 1–2, user colors); dashboard (2 columns, 6 rows) shows names (anchor-colored if enabled) and deviations (green >0%, red <0%, gray N/A), positioned user-selectable with text sizing. Updates on last bar for efficiency.
This setup scales deviations across volatilities, aiding multi-period bias assessment.
Why This Adds Value & Originality
Standard VWAPs limit to session anchors (daily/weekly); deviation tools often lack multiples. This isn't a simple mashup: Manual iterative AVWAP (no built-in ta.vwap reliance) ensures dynamic resets on timestamp tweaks—e.g., shift "Event" to FOMC date without recalc lag. The 5-anchor flexibility (arbitrary UTC times) + centralized dashboard (colored deviations at a glance) creates a "global timeline scanner" unique to event-driven trading, unlike rigid multi-VWAP scripts. It streamlines what requires 5 separate indicators, with % normalization for cross-asset comparison (e.g., SPY vs. BTC).
How to Use
Setup: Overlay on chart. Configure anchors (e.g., Anchor1: "Weekly Open" at next Monday 00:00 UTC; enable/show 2–3 for focus). Set source (HLC3 default), position (Top Right), text size (Small).
Interpret Dashboard:
Left Column: Anchor names (e.g., "Monthly Open" in orange).
Right Column: Deviations (e.g., "+1.25%" green = above, bullish exhaustion?).
Scan for confluence (e.g., all >+2% = overbought).
Trading:
Lines: Price near AVWAP = mean reversion; breaks = momentum.
Example: -0.8% below "Event" anchor post-earnings → potential bounce buy.
Use on 1H–D; adjust timestamps via calendar.
Tips: Enable 1–3 anchors to avoid clutter; test on historical events.
Limitations & Disclaimer
AVWAPs reset on anchor bars, potentially lagging mid-period; deviations are % only (add ATR for absolute). Table updates on close (no intrabar). Timestamps must be UTC/future-proof. No alerts/exits—integrate manually. Not advice; backtest deviations on your assets. Past ≠ future. Comments for ideas.
cd_correlation_analys_Cxcd_correlation_analys_Cx
General:
This indicator is designed for correlation analysis by classifying stocks (487 in total) and indices (14 in total) traded on Borsa İstanbul (BIST) on a sectoral basis.
Tradingview's sector classifications (20) have been strictly adhered to for sector grouping.
Depending on user preference, the analysis can be performed within sectors, between sectors, or manually (single asset).
Let me express my gratitude to the code author, @fikira, beforehand; you will find the reason for my thanks in the context.
Details:
First, let's briefly mention how this indicator could have been prepared using the classic method before going into details.
Classically, assets could be divided into groups of forty (40), and the analysis could be performed using the built-in function:
ta.correlation(source1, source2, length) → series float.
I chose sectoral classification because I believe there would be a higher probability of assets moving together, rather than using fixed-number classes.
In this case, 21 arrays were formed with the following number of elements:
(3, 11, 21, 60, 29, 20, 12, 3, 31, 5, 10, 11, 6, 48, 73, 62, 16, 19, 13, 34 and indices (14)).
However, you might have noticed that some arrays have more than 40 elements. This is exactly where @Fikira's indicator came to the rescue. When I examined their excellent indicator, I saw that it could process 120 assets in a single operation. (I believe this was the first limit overrun; thanks again.)
It was amazing to see that data for 3 pairs could be called in a single request using a special method.
You can find the details here:
When I adapted it for BIST, I found it sufficient to call data for 2 pairs instead of 3 in a single go. Since asset prices are regular and have 2 decimal places, I used a fixed multiplier of $10^8$ and a fixed decimal count of 2 in Fikira's formulas.
With this method, the (high, low, open, close) values became accessible for each asset.
The summary up to this point is that instead of the ready-made formula + groups of 40, I used variable-sized groups and the method I will detail now.
Correlation/harmony/co-movement between assets provides advantages to market participants. Coherent assets are expected to rise or fall simultaneously.
Therefore, to convert co-movement into a mathematical value, I defined the possible movements of the current candle relative to the previous candle bar over a certain period (user-defined). These are:
Up := high > high and low > low
Down := high < high and low < low
Inside := high <= high and low >= low
Outside := high >= high and low <= low and NOT Inside.
Ignore := high = low = open = close
If both assets performed the same movement, 1 was added to the tracking counter.
If (Up-Up), (Down-Down), (Inside-Inside), or (Outside-Outside), then counter := counter + 1.
If the period length is 100 and the counter is 75, it means there is 75% co-movement.
Corr = counter / period ($75/100$)
Average = ta.sma(Corr, 100) is obtained.
The highest coefficients recorded in the array are presented to the user in a table.
From the user menu options, the user can choose to compare:
• With assets in its own sector
• With assets in the selected sector
• By activating the confirmation box and manually entering a single asset for comparison.
Table display options can be adjusted from the Settings tab.
In the attached examples:
Results for AKBNK stock from the Finance sector compared with GARAN stock from the same sector:
Timeframe: Daily, Period: 50 => Harmony 76% (They performed the same movement in 38 out of 50 bars)
Comment: Opposite movements at swing high and low levels may indicate a change in the direction of the price flow (SMT).
Looking at ASELS from the Electronic Technology sector over the last 30 daily candles, they performed the same movements by 40% with XU100, 73.3% (22/30) with XUTEK (Technology Index), and 86.9% according to the averages.
Comment: It is more appropriate to follow ASELS stock with XUTEK (Technology index) instead of the general index (XU100). Opposite movements at swing high and low levels may indicate a change in the direction of the price flow (SMT).
Again, when ASELS stock is taken on H1 instead of daily, and the length is 100 instead of 30, the harmony rate is seen to be 87%.
Please share your thoughts and criticisms regarding the indicator, which I prepared with a bit of an educational purpose specifically for BIST.
Happy trading.

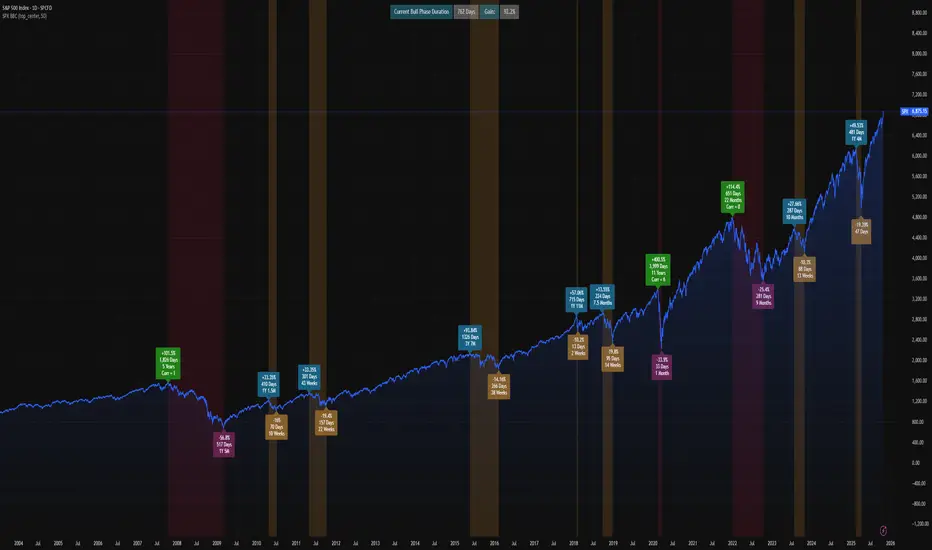
SPX Bull Market, Bear market and Corrections Since 1929 This script show visually with labels all the BULL & BEAR Market since 1929 with intermediary corrections.
Bear Market = Price drop of >=20% (based on closing price not intra day low)
Corrections = Price drop of >=10% and < 20% (based on closing price not intra day low, in intraday price it may go beyond 20% but closes in less than 20% )
The script doesn't update as we move forward , I need to manually update during every correction/bull/bear phases.
It is a good visual to study the past bull and bear market to gain some key insights!
Basic DCA Strategy by Wongsakon KhaisaengThe Core Principle and Philosophy Behind the Basic DCA Strategy
1. Introduction
The Basic DCA Strategy (Dollar-Cost Averaging) represents one of the most fundamental and enduring investment methodologies in the realm of systematic accumulation. The philosophy underpinning DCA is rooted not in speculation or prediction, but in disciplined participation. It assumes that the consistent act of investing a fixed amount of capital over time—regardless of short-term price volatility—can yield superior long-term outcomes through the natural smoothing effect of cost averaging.
This strategy, expressed through the Pine Script code above, formalizes the DCA concept into a fully systematic trading framework, enabling quantitative backtesting and objective evaluation of long-term accumulation efficiency.
2. Mechanism of Operation
At its technical core, the strategy executes a fixed-value buy order at every predefined interval within a specific accumulation period.
Each DCA event invests a constant “Investment Amount (USD)” irrespective of price fluctuations. When prices decline, this constant investment buys a larger quantity of the asset; when prices rise, it purchases fewer units. Over time, this behavior lowers the average cost basis of the accumulated position, effectively neutralizing short-term timing risks.
Mathematically, this is represented as:
Units Purchased = Investment Amount / Closing Price
Cost Basis = Total Invested USD / Total Units Acquired
Portfolio Value = Total Units Acquired × Current Price
The algorithm tracks cumulative investment, acquired units, and commissions dynamically, continuously recalculating key portfolio metrics such as total profit/loss (PnL), CAGR (Compound Annual Growth Rate), and maximum drawdown (peak-to-trough equity decline).
Furthermore, the script juxtaposes DCA results with a Buy & Hold benchmark, where the entire initial capital is invested at once. This comparison highlights the behavioral resilience and volatility resistance of the DCA method relative to market-timing strategies.
3. The Essence of DCA Philosophy
At its philosophical core, DCA is not a trading system, but a behavioral framework for rational capital deployment under uncertainty. It embodies the principle that time in the market often outweighs timing the market.
The DCA approach rejects the illusion of precision forecasting and embraces probabilistic humility—the recognition that even the most skilled investors cannot consistently predict short-term market fluctuations. Instead, it focuses on controlling what is controllable: the frequency, consistency, and size of investment actions.
This mindset reflects a broader principle of risk dispersion through temporal diversification. Rather than concentrating entry risk into a single price point (as in lump-sum investing), DCA spreads exposure across multiple time intervals, thereby converting volatility into opportunity.
In essence, volatility—often perceived as risk—is reframed as a mechanism for mean reversion advantage. The strategy thrives precisely because markets oscillate; each fluctuation provides a chance to accumulate at varied price levels, improving the weighted-average entry over time.
4. Long-Term Rationality Over Short-Term Emotion
DCA’s endurance stems from its ability to neutralize emotional biases inherent in human decision-making. Investors tend to overreact to market euphoria or panic—buying high out of greed and selling low out of fear. By automating purchases through predefined intervals, the DCA model enforces mechanical discipline, detaching decision-making from sentiment.
This transforms investing from an emotional endeavor into a systematic, algorithmic routine governed by rules rather than reactions. In doing so, DCA serves not only as a financial model but also as a psychological safeguard—aligning investor behavior with long-term compounding logic rather than short-term speculation.
5. Comparative Insight: DCA vs. Buy & Hold
While both DCA and Buy & Hold share a long-term investment horizon, they diverge in their treatment of entry timing. The Buy & Hold model assumes full deployment of capital at the beginning, maximizing exposure to growth but also to volatility. Conversely, DCA smooths the entry curve, trading off short-term returns for long-term stability and improved average entry price.
In environments characterized by volatility and cyclical corrections, DCA tends to outperform in terms of risk-adjusted returns, lower drawdowns, and improved investor adherence—since it reduces the psychological pain of entering at local peaks.
6. Conclusion
The Basic DCA Strategy exemplifies the synthesis of mathematical rigor and behavioral discipline. Its algorithmic construction in Pine Script transforms a classical investment philosophy into a quantifiable, testable, and transparent framework.
By automating fixed-amount purchases across time, the system operationalizes the central axiom of DCA: consistency over conviction. It is not concerned with predicting future prices but with ensuring persistent participation—trusting that the market’s upward bias and the power of compounding will reward patience more than precision.
Ultimately, DCA embodies the timeless principle that successful investing is less about forecasting markets, and more about designing behavior that can endure them.

Zarks 4H Range, 15M Triggers Pt1HTF Dividers + 4H Candle Structure + CRT Reference Tool
🔹 Vertical Blue Lines → represent divisions of the 4-hour timeframe, helping you visually segment intraday structure into HTF blocks.
Green Dotted Line → marks the High of each 4-hour interval.
🔵 Blue Dotted Line → shows the Open of that 4-hour interval.
⚫ Gray Dotted Line → displays the Close of that 4-hour interval.
🔴 Red Dotted Line → highlights the Low of that 4-hour interval.
💡 CRT Concepts (Candle Range Theory by Romeo TPT)
CRT signals are not direct buy/sell signals ❌💰 — they serve as contextual reference points 🧭.
A high-probability setup often appears when:
A 4H sweep of a previous candle’s high occurs 🐢 (liquidity manipulation),
Followed by a bearish 15-minute close,
Targeting the 50% retracement of that 4H candle’s range 🎯.
📊 Use this tool to frame market structure across timeframes, align entries with liquidity events, and visualize when price may be expanding from or reverting to institutional reference points.
This indicator is meant to be combined with vertical lines on the 15 min time frame at corresponding times example 1:45,4:45,9:45

AlfaBitcoin Dashboard – Estrategia Combinada (Juan + Gael)Integrate the TradingView (TV) indicators with the sessions from October 16 and 21 (Gael Sánchez Smith and Juan Rodríguez). We can build an alert system or dashboard that combines what was discussed in both sessions with your custom indicators on TradingView.

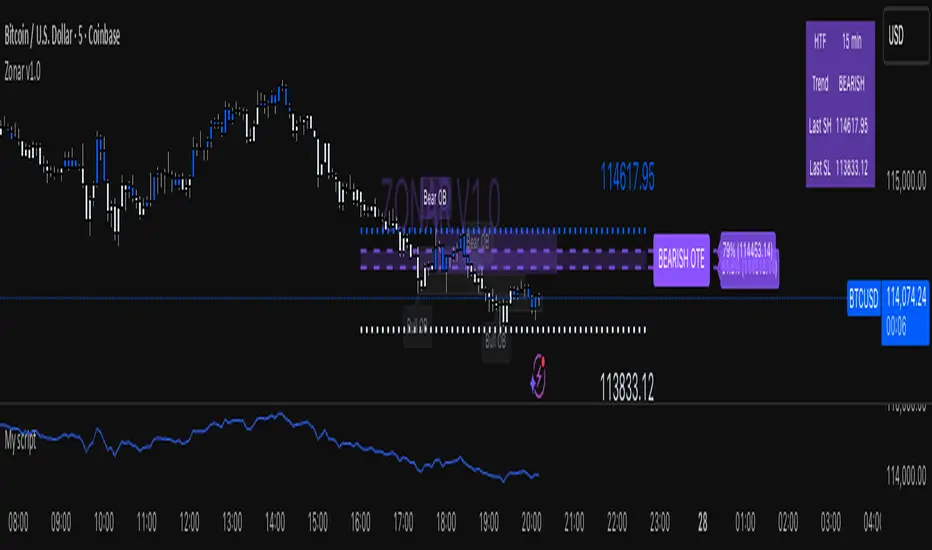
Zonar v1.5🟣 ZONAR v1.5 — Precision Market Mapping System
ZONAR is a proprietary market-structure engine that fuses price-action logic, real-time trend adaptation, and algorithmic zone validation into one integrated framework.
Unlike typical SMC indicators that simply draw order blocks or FVGs, Zonar reconstructs market intent by dynamically grading and updating structural zones as they evolve.
🧠 Core Logic
Zonar’s engine continuously analyses three key dimensions of price movement:
Hierarchical Market Structure Recognition — Detects higher-timeframe swing ranges, recalibrates the active trend, and synchronizes lower-timeframe structure shifts.
Adaptive Zone Generation — Builds order-block, mitigation-block, and imbalance zones only when algorithmic displacement and retracement criteria are met — filtering out noise and redundant zones.
Zone Integrity Tracking — Every plotted zone is validated, aged, and visually deactivated once mitigated or invalidated, giving traders a clean, self-updating chart environment.
⚙️ What Makes ZONAR Unique
Proprietary Zone Logic: Combines displacement candles, body/-wick validation, and retracement confirmation to mark institutional footprints with higher precision.
Dynamic Higher-Timeframe Context: Each zone aligns automatically with higher-timeframe BOS/CHOCH logic, updating the premium/discount bias in real time.
OTE Mapping Engine: Integrates a built-in Optimized Trade Entry (61.8–79%) range, synchronized with structural swing highs/lows for accurate retracement targeting.
Zone Lifecycle Visualization: Active zones transition through stages — valid → retraced → mitigated — visually represented with color fading and label updates.
Smart Signal Output: Generates live entry, stop-loss, and multi-target projections (TP1–TP3) derived from each zone’s structure and directional bias.
🎯 How It Helps
Zonar filters the chaos of price action into a clean, interpretable map — identifying where liquidity is engineered and where true institutional interest resides. It helps traders anticipate rather than react, focusing only on areas where probability, structure, and precision converge.
Psychological Levels + Retest The script detects key round-number psychological levels such as 00, 50, and 100 zones based on the pair’s pip structure.
It then monitors price behavior around these zones using customizable buffers to highlight reaction areas.
When price breaks above a major or minor psychological level while trading above the 200 EMA, the indicator tracks for a retest confirmation. Once the required number of touches occurs within the defined buffer, the indicator marks the retest area and can trigger alerts for trade opportunities.
