[blackcat] L2 Ehlers MAMALevel: 2
Background
John F. Ehlers introuced MESA Adaptive Moving Average-a.k.a "MAMA" in his "Rocket Science for Traders" chapter 17. Forgive the whimsy of the name Dr. Ehlers attached to this unique indicator, but with that name he is sure you will always remember it, like KAMA and VIDYA.
Function
blackcat L2 Ehlers MESA Adaptive Moving Average-a.k.a "MAMA" is used to follow trend. The concept of MAMA is to relate the phase rate of change to the EMA alpha, thus making the EMA adaptive. The cycle phase goes from 0 through 360 degrees in each cycle. The phase is continuous, but is usually drawn with the snap back to 0 degrees as the beginning of each cycle. Thus the phase rate of change is 360 degrees per cycle. The shorter the cycle, the faster the phase rate of change. For example, a 36-bar cycle has a phase rate of change of 10 degrees per bar, while a 10-bar cycle has a rate of change of 36 degrees per bar. The cycle periods tend to be longer when the market is in a Trend Mode.
The cycle phase is computed from the arctangent of the ratio of the Quadrature component to the Inphase component. Dr. Ehlers obtain the phase rate of change values by taking the difference of successive phase measurements. The arctangent function only measures phase over a half cycle, from -90 degrees to +90 degrees. Since the phase measurement snaps back every half cycle, a huge negative rate change of phase every half cycle results from the computation of the rate change of phase. Measured negative rate changes of phase can also occur when the market is in a Trend Mode. Any negative rate change of phase is theoretically impossible because phase must advance as time increases. Dr. Ehlers therefore limit all rate change of phase to be no less than unity.
Key Signal
Smooth --> 4 bar WMA w/ 1 bar lag
Detrender --> The amplitude response of a minimum-length HT can be improved by adjusting the filter coefficients by
trial and error. HT does not allow DC component at zero frequency for transformation. So, Detrender is used to remove DC component/ trend component.
Q1 --> Quadrature phase signal
I1 --> In-phase signal
Period --> Dominant Cycle in bars
SmoothPeriod --> Period with complex averaging
alpha ---> coefficient
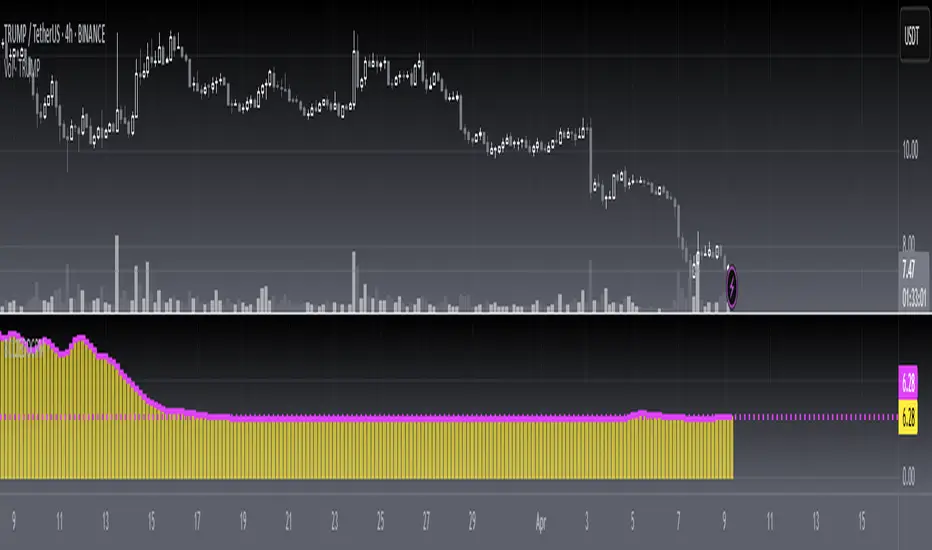
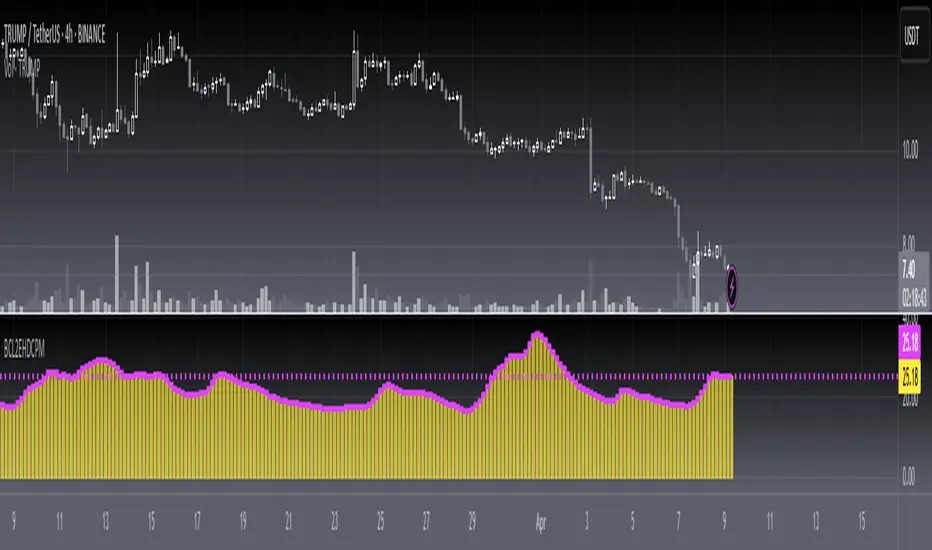
MAMA ---> MESA Adaptive Moving Average-a.k.a "MAMA"
FAMA ---> slow line of MAMA
Pros and Cons
100% John F. Ehlers definition translation of original work, even variable names are the same. This help readers who would like to use pine to read his book. If you had read his works, then you will be quite familiar with my code style.
Remarks
The 13th script for Blackcat1402 John F. Ehlers Week publication.
Readme
In real life, I am a prolific inventor. I have successfully applied for more than 60 international and regional patents in the past 12 years. But in the past two years or so, I have tried to transfer my creativity to the development of trading strategies. Tradingview is the ideal platform for me. I am selecting and contributing some of the hundreds of scripts to publish in Tradingview community. Welcome everyone to interact with me to discuss these interesting pine scripts.
The scripts posted are categorized into 5 levels according to my efforts or manhours put into these works.
Level 1 : interesting script snippets or distinctive improvement from classic indicators or strategy. Level 1 scripts can usually appear in more complex indicators as a function module or element.
Level 2 : composite indicator/strategy. By selecting or combining several independent or dependent functions or sub indicators in proper way, the composite script exhibits a resonance phenomenon which can filter out noise or fake trading signal to enhance trading confidence level.
Level 3 : comprehensive indicator/strategy. They are simple trading systems based on my strategies. They are commonly containing several or all of entry signal, close signal, stop loss, take profit, re-entry, risk management, and position sizing techniques. Even some interesting fundamental and mass psychological aspects are incorporated.
Level 4 : script snippets or functions that do not disclose source code. Interesting element that can reveal market laws and work as raw material for indicators and strategies. If you find Level 1~2 scripts are helpful, Level 4 is a private version that took me far more efforts to develop.
Level 5 : indicator/strategy that do not disclose source code. private version of Level 3 script with my accumulated script processing skills or a large number of custom functions. I had a private function library built in past two years. Level 5 scripts use many of them to achieve private trading strategy.
Pine Script® indicator