Calculator (weighted) - evoA tool to calculate the average price and position size.
The "Risk Amount" input means the amount of dollars you lose if the trade gets stopped out (it should be based on a small percentage of your account).
TIPS
- If you use the weights to calculate an average price, make sure it adds up to 100% in total or you will get a weird number.
- Keep an eye on the risk amount if you take a trade, if I ever update the script it might set back to default which will change your position size.
- I tested it all but you might trade in a different way than me, so do your own calculation for every new thing you try with it.
If you find any bug please tell me so that no one ends up with a weird calculation or position size.
Entry

[fikira] Harmonic Patterns (Gartley)When using "Harmonic Patterns", always look at the bigger picture, please do not depend solely on the "Pattern".
Use other indicators,... to confirm what you think is going on!
That said, it is quite useful!
Here we have "The Gartley", bullish and bearish.
The "Pattern" is created by checking 5 consecutive (pivot) points, starting with X, A, B, C, and ending with point D.
At point D all 5 points are compared, calculated and verified.
When confirmed, a "Label" will be plotted at point D, together with the "Entry", "Take Profit" and "Stop Loss" price.
The "Entry", "Take Profit" and "Stop Loss" lines will be plotted as well at point D.
Lastly, a "Drawing" automatically will be displayed which makes the "Pattern" visible.
Please do mind, the "Drawing" is calculated differently, the "Drawing" sometimes can be displayed incorrectly
when prices are too close to each other (for example low Satoshi price changes).
THE "ENTRY" , "TAKE PROFIT", "STOP LOSS" PRICES AND LINES ARE NOT AFFECTED AT ALL BY THIS, THEY WILL SHOW CORRECTLY!
- 1 "TP point" can be changed ("TP Level 0.618")
- "Labels", "Lines", "Drawings" can be disabled/enabled
- "Labels" can be made smaller or bigger ("Size Label")
- "Labels" can be placed further or closer to the bar ("Distance TP Label" > higher = closer, lower = further)
- "Lines" can be made thicker or thinner ("TP Linewidth")
- "Drawings" can be made thicker or thinner ("Drawings Linewidth")
- "Drawings" are created by comparing with 100 bars back in history (default), should it be (very rarely) a triangle is displayed flat on the left side,
possibly the first point(s) is/are further than 100 bars ago, in this case increase "Period Drawings" above 100.
- When a lot (really a lot!) of "Patterns" appear on the chart, the first ones will not be displayed anymore, first the "Drawings", then the "Lines"
The last (present) ones will always be displayed in total without a problem!
- If you want to see "Patterns" with less correct measurement, change "Error Marge" 0.9 - 1" and "Error Marge" 1 - 1.1"), this gives max. about 10% extra margin
Thank you very much!

Peakestsignal Indicator - Valuetrading Indicator - Cheap Entry'sPrivate indicator.
HI BIG PLAYERS
Are you looking for the cheapest entry signal for trading?
This indicator gives the really cheaply entry signals. For buysignals you get a green background vertical line and for sellsignals you get a red background vertical line.
If you have a trend strategy and only need THE TREND for trading: believe me, this indicator give you the right signals.
Alerts are possible with the TradingView Alertsystem.
More examples of another markets:
HOT TO GET ACCESS: looking on below signature.
Kind regards
NXT2017

Mirror TSI-MACD by Trader JayI was playing around with the TSI-MACD and surprisingly it works quite well as a mirror.
There are 2 ways this can be used
1. Enter long when Blue line crosses up the Red
2. Exit long when Green line crosses the blue
or
1. Enter long when Blue line crosses up the Red
2. Exit long when Blue line crosses back down below the Red

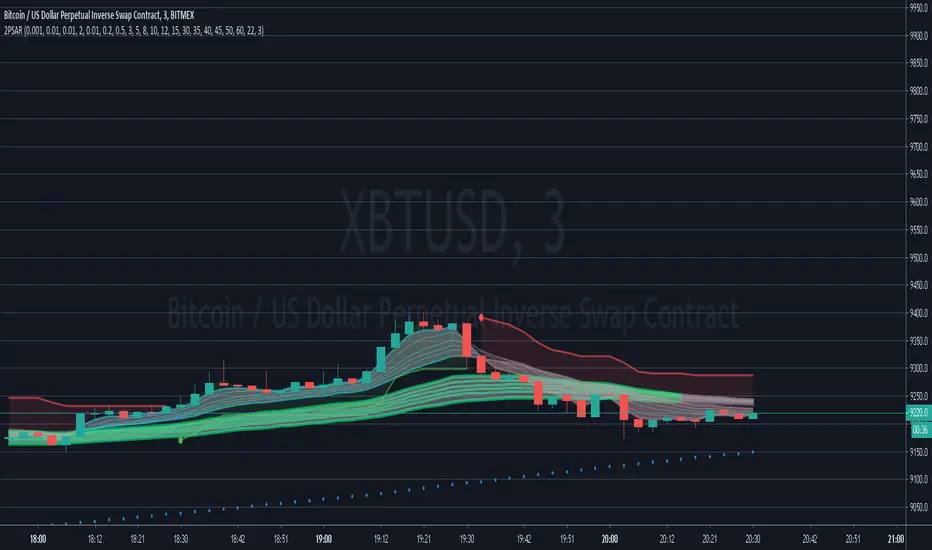
IMPULSE_2PSAR_ST_CMGEmasCurrently under Development.
Designed to easily get the trend using both SuperTrend and CM Guppy Emas, and using 2 PSARs for entry and trend change alert.
intended to trade scalping and options
CryptoJJ - SSL indicatorThe SSL indicator with colour change. Tool for spotting trends and finding good entry points. I recommend using it for higher timeframes, from 4h to 1D.
Play with the settings, you can change the moving avarage type, its length, if you prefer having the default
bar colours in your chart, disable the colouring function in the script.
Good luck crypto traders!
CryptoJJ

SWING POINTS HOUNDTry's to find possible swing points and reversal points using mutli time frame moving averages and Fibonacci retracement with multiple lengths. Can be used to gauge trends and find potential entry points for trend following strategies. Can also be used to find potential price reversal points and areas of heavy resistance/support.


ATR and RSI Buy / Sell Signal Beta 1.0This has been a long time coming for me.
I need to clean it up and add inputs for others to customize it that's why its protected.
This is configured for US securities.
Goal: Signal when to enter a trade on either side
Method: ATR and 2 RSI signals using:
3 Minute Chart Resolution
MUST have an active (can be hidden) BUILT-IN ATR ; length = 4 and set to RMA smoothing
MUST add the script; THEN go to the scripts settings and change the source to ATR. TV does not allow this to be set to default (that I know of)
I have default settings how I use them but you can modify:
ATR period (Length) =4
ATR multiplier = 0.9 (can edit by 0.1 increments.
The 1st Length/offset/resolution is defaulted to the 1 minute RSI.
The 2nd Length/offset/resolution is defaulted to the 3 minute RSI.
1)
OVERBOUGHT or OVERSOLD
*Please understand I use a length of 4 for this script, that is why the RSI OB/OS limits are so high/low.
Overbought conditions will light yellow if the 1m RSI > 90 and the 3min RSI > 85 and the time is between 09:42am and 16:00
Oversold conditions will light yellow if the 1m RSI < 10 and the 3min RSI < 10 and the time is between 09:42am and 16:00
The script ensures that if it is OB/OS under these conditions than it will not signal a buy or sell.
2)ATR
The script identifies reversals via the close breaking past the previous ATR on the preceding candle. ATR will not move UP on a short and will not move down on a long. It trails the last candle it was not broken.
The script plots labels up and down to identify the start of a reversal. Each start will have an accompanying line to display the continuation of the trend in one direction.
The script displays the value of the STOP as it trails price action. One could continue to mirror this value if you chose to. I use the fib tool for my targets and manage it as P/A demands.
3) RSI SIGNALLING
The script identifies a trend by analyzing BOTH RSI (1m and 3m) measures and requires that the current bar's readouts for BOTH measures are either greater or lower than the preceding candle.
The script also requires that both measures are above or below 50 to signal a trend.
The script will plot the trend as arrows up or down, it will display a (-) when the these conditions are not met.
Requirements to signal a BUY (LIME GREEN) or SELL (BRIGHT RED):
**Ensure your chart candle colors are faded so you can see the signal.**
**Precision is set to 0; remember TV rounds up or down for the visual measure but uses the exact measure for the script**
During the first 12 minutes:
----------------------------------
There are no OB/OS conditions as informed in section 1.
ATR stop line must be present OR the current bar close is higher than the ATR stop of the preceding candle whether it is a long or short stop signal. Quick whips are accounted for.
The current bar close MUST be higher or lower than the preceding candle's HIGH or LOW.
The script MUST identify the RSI signalling as detailed above in section 3.
The candle will light LIME or BRIGHT RED when these conditions are met and will not deceive the statements I have made.
It is important to understand that the signal may become null if the conditions do not persist through the final close of the candle. This means that a snapshot of the indicator does not accurately represent
what it will display at different times during each countdown of EACH 3 minute candle. Sometimes it signals to go long and once RSI gets too high it no longer signals. This is a good thing. Limits FOMO entries.
@ 09:42 until 16:00
-----------------------------------
OB/OS yellow candles will now occur as detailed in section 1.
Candles MUST clear the HIGH or LOW of the TWO preceding candles.
Candles MUST be trending as defined in section 3.
Candles MUST conform the conditions of the ATR stop.
I want to thank;
@pinescripters
@freedom_trader_
and I will even thank the manual lol
I have manually back tested this because I am working on the proper coding to have TV do it for me.
My strategy requires me to cover 25% of my position at 0.5 of the TV ATR 4 length RMA indicator.
Once the first target is hit than the STOP is moved to break-even.
If the target is not hit than my maximum loss is also 0.5 of the TV ATR 4 length RMA indicator.
I tested 3 full days, always on the 3min chart.
I tested 96 trades. All occurring immediately upon signal.
85 were wins and 9 were losses, 88.5% profitable.
Please understand that my intend is to cover enough quickly to cover commission costs and limit losses.
The remaining 75% of my position are sold off in the following pattern unless P/A demands that I override the FIB tool. Let them run when you can.
Position ENTRY
25% cover @ 0.5 x ATR
25% of remaining position cover @ 1.75 x ATR
25% of remaining position cover @ 2.5 x ATR
25% of remaining position cover @ 3.5 x ATR (APX 40% of the initial position)
I will further back test in the near future with an expanded risk.


Fisher Stochastic Center of GravityWhat happens when you take the Fisher Transform of a Stochastic Oscillator?
Well, you filter out all the stuff you don't want and are left with super-precise entries!
This indicator works especially well in with a trend-follower in a higher timeframe - iTrend, MAMA, Hull, etc...
How to trade:
Use with another indicator to tell you the current trend.
Take buy and sell signals as you would with the Stoch.
-DasanC


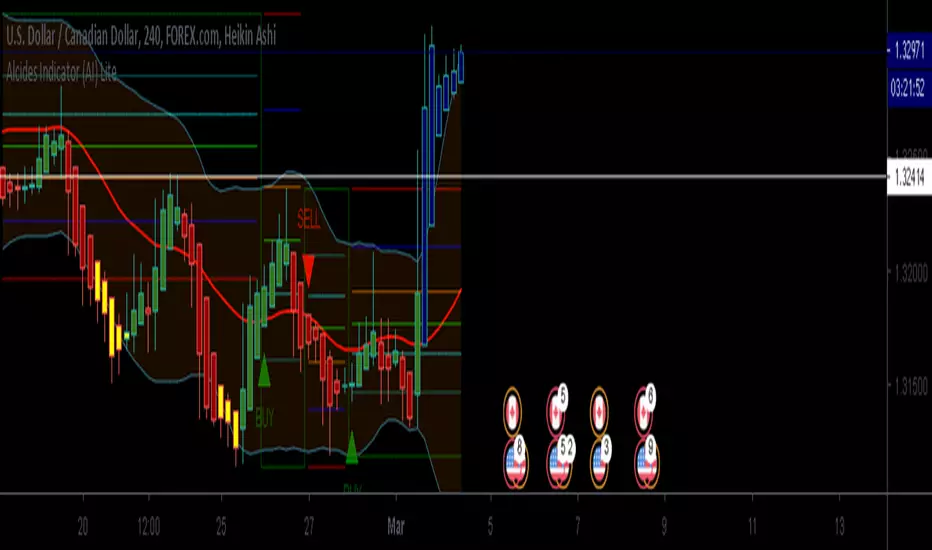
Alcides Indicator(AI) LiteAlcides Indicator (AI) Lite is a simple to use indicator that can be used with any type of asset, trading in any market including FOREX, Stocks, Commodities, Cryptocurrencies etc. The Lite version uses levels from either 1 hr or 4 hr time frame based on user input to indicate entry (BUY) into or exit (SELL) from an asset. The indicator also plots support for BUYs and Resistance for SELLs which can be used as a reference while setting your Stop Loss. BUY, SELL and TAKE GAINS alerts can be set on trading view to help monitor the asset as well.
Even though the indicator signals BUYs and SELLs based on chosen Time Frame levels, the user must always use their discretion based on their TA and FA. Also, indicator repainting can occur based on time of signal/chart used (ex. 5m chart on 1 hr timeframe levels can repaint a BUY/SELL after 1 hr closes).
Works best with Heikin Ashi candles and lower timeframes like 5m, 15m, 30m.
The full version has more time frame levels to choose from, a few extra useful features and also recommends sell and buy levels based on the chosen time from.
Contact me for access and more information.
LINEdicator - Trendanalysis toolThis indicator creates an trend channel based on an EMA/SMA combo and a Parabolc SAR indicator.
Watch for the peaks and the size of the red/green channel for possible trend change.
Can also be used as an Entry/Exit/Stop-Loss setting tool.


𝙇𝙄𝙌𝙐𝙄𝘿 𝙅𝘼𝘿𝙀 🇸🇨🇷🇮🇵🇹𝙇𝙄𝙌𝙐𝙄𝘿 𝙅𝘼𝘿𝙀 🇸🇨🇷🇮🇵🇹 v0.1
-Unique LJS breakout/reversal system
-Multi timeframe trend restricted trading
-Renko, ADX, MAs
-Risk Management, TP, SL
More to come!

Febres StrategyThe strategy consist in every time that price failed to break any of the EMAs, we need to wait for the right price action and make a buy or sell when it bounce from it to keep surfing on the trend (using the stochastic oscillator and the 5-13 EMAs cross as an additional confirmation).
When do we start looking for a change on the trend? When it repeats the blue tracer (high or low of the previous day) without breaking it and bouncing from it, there will be our signal to start looking for a change of direction on the trend.
Only applicable on 15 minute chart.

Bollinger Band Oscillator Filtered Long/Short Entries This script calculates entries using Bollinger Bands paired with a series of oscillators. Simply set the Bollinger Band length, as well as the length of the oscillators, and you're good to go. Filtered entries as well as unfiltered entries are plotted by default. Excellent results on longer timeframes (1 hour and higher), although scalping can be done on lower timeframes as well. Filtered entries give safer long/short entries, but plenty of good signals are generated by the unfiltered data as well. Has been tested and found to be effective on several stocks and cryptocurrencies.
Message me to try this script out, thanks!

CCI Cycle (Modified Schaff Trend Cycle)This is a modified Schaff Trend Cycle (STC), which is designed to provide quicker entries and exits.
I've been a huge fan of the STC for a long time, but being based on the MACD means its signals often lag by a bar or two (especially in fast moving markets). All I've done here is take the base STC script (all credit to user @LazyBear), and change the source to a modified CCI.
The CCI Cycle provides more timely entries and exits, often by 1-2 bars. The flip side of the increased responsiveness is a prevalence for more false signals (a perfect example is the 17th August on the above chart). It's the nature of the beast! Still, I've been using this for a few months now and it's (in my opinion) an upgrade on the standard STC.
As always, you will need to pair this with another indicator or method of technical analysis to provide a trade bias, as the CCI Cycle (and STC) aren't designed to trade every signal. In my experience, either divergence identification, or using one or more moving averages works particularly well.
The indicator is also MTF capable, so you can get some interesting results from that.
Any queries let me know.
DD

Easy ma cross STUDYEasy ma cross STUDY
Best to use with small timeframes (for example 5m chart) and uptrend (refer to 1H or 4H chart).
You can set up Alerts from the Entry and Exit signals.
Play around with the settings of SMA1 and SMA2 for better results for you currency pair / time frame.
Always use stop loss!
