VIX MTF MomentumSweet little momentum gadget to track the VIX Index.
What is the VIX?
The CBOE S&P 500 Volatility Index (VIX) is known as the 'Fear Index' which can measure how worried traders are that the S&P 500 might suddenly drop within the next 30 days.
When the VIX starts moving higher, it is telling you that traders are getting nervous. When the VIX starts moving lower, it is telling you that traders are gaining confidence.
VIX calculation?
The Chicago Board of Options Exchange Market Volatility Index (VIX) is a measure of implied volatility (Of the S&P 500 securities options), based on the prices of a basket of S&P 500 Index options with 30 days to expiration.
How to use:
If VIX Momentum is above 0 (RED) traders are getting nervous.
If VIX Momentum is below 0 (GREEN) traders are gaining confidence.
Follow to get updates and new scripts: www.tradingview.com
Fear

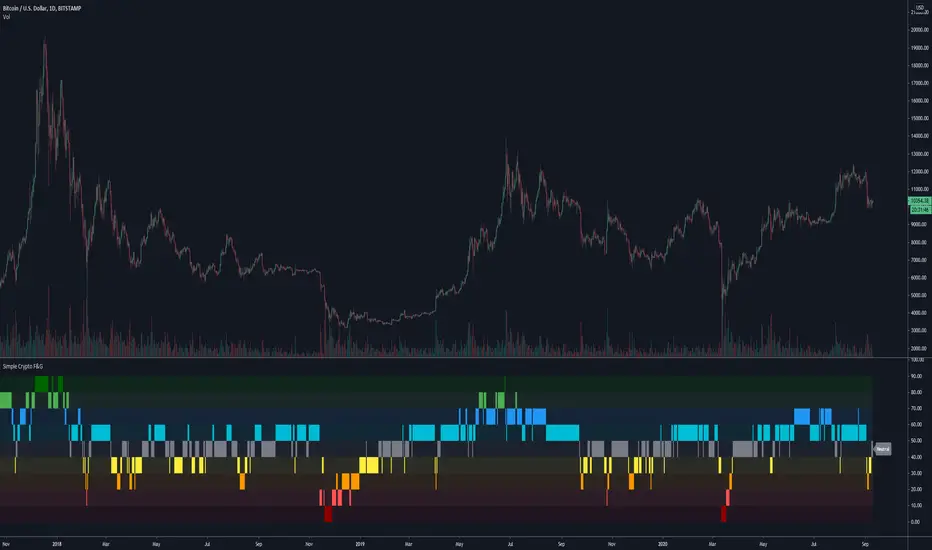
Simplified Crypto Fear & Greed DisplayA more simplified view of a Fear & Greed index.
This script has been made public because it uses Trading Psychology - Fear & Greed Index by DGT as the basis/inspiration for it.
I've re-imagined the visuals in order to display F&G data differently to the more traditional versions of the indicator floating around, as well as adapting it's calculations and reference assets for use with Crypto markets.
It's aim is to show the current status / mindset of market participants at a quick glance.
When there is a lot of fear in the market it is usually a good time to look for buying opportunities.
On the flip side you can use it to spot selling opportunities when there is too much greed / FOMO in the markets.
This indicator has the option for Traditional and Crypto markets.
The Traditional option uses the tickers VIX and GOLD as part of it's calculations, where as Crypto uses BVOL24H and BTC.D in order to base it's decisions off of more relevant data.
There are also 10 levels of smoothing so play around with that to get the desired result. Depending on the asset you are looking at, smoothing of 1 or 2 may work much better than 5+
Have a play around, customize it, use it and let me know what you think.
Trading Psychology - Fear & Greed Index by DGTPsychology of a Market Cycle - Where are we in the cycle?
Before proceeding with the question "where", let's first have a quick look at "What is market psychology?"
Market psychology is the idea that the movements of a market reflect the emotional state of its participants. It is one of the main topics of behavioral economics - an interdisciplinary field that investigates the various factors that precede economic decisions. Many believe that emotions are the main driving force behind the shifts of financial markets and that the overall fluctuating investor sentiment is what creates the so-called psychological market cycles - which is also dynamic.
Stages of Investor Emotions:
* Optimism – A positive outlook encourages us about the future, leading us to buy stocks.
* Excitement – Having seen some of our initial ideas work, we begin considering what our market success could allow us to accomplish.
* Thrill – At this point we investors cannot believe our success and begin to comment on how smart we are.
* Euphoria – This marks the point of maximum financial risk. Having seen every decision result in quick, easy profits, we begin to ignore risk and expect every trade to become profitable.
* Anxiety – For the first time the market moves against us. Having never stared at unrealized losses, we tell ourselves we are long-term investors and that all our ideas will eventually work.
* Denial – When markets have not rebounded, yet we do not know how to respond, we begin denying either that we made poor choices or that things will not improve shortly.
* Fear – The market realities become confusing. We believe the stocks we own will never move in our favor.
* Desperation – Not knowing how to act, we grasp at any idea that will allow us to get back to breakeven.
* Panic – Having exhausted all ideas, we are at a loss for what to do next.
* Capitulation – Deciding our portfolio will never increase again, we sell all our stocks to avoid any future losses.
* Despondency – After exiting the markets we do not want to buy stocks ever again. This often marks the moment of greatest financial opportunity.
* Depression – Not knowing how we could be so foolish, we are left trying to understand our actions.
* Hope – Eventually we return to the realization that markets move in cycles, and we begin looking for our next opportunity.
* Relief – Having bought a stock that turned profitable, we renew our faith that there is a future in investing.
It's hard to predict with certainty where we exactly are in the market cycle, we can only make an educated guess as to the rough stage based on data available. And here comes the study "Trading Psychology - Fear & Greed Index"
Factors taken into account in this study include:
1-Price Momentum : Price Divergence/Convergence versus its Slow Moving Average
2-Strenght : Rate of Return (RoR) also called Return on Investment (ROI) is a performance measure used to evaluate the efficiency of an investment, net gain or loss of an investment over a specified time period, the rate of change in price movement over a period of time to help investors determine the strength
3-Money Flow : Chaikin Money Flow (CMF) is a technical analysis indicator used to measure Money Flow Volume over a set period of time. CMF can be used as a way to further quantify changes in buying and selling pressure and can help to anticipate future changes and therefore trading opportunities. CMF calculations is based on Accumulation/Distribution
4-Market Volatility : CBOE Volatility Index (VIX), the Volatility Index, or VIX, is a real-time market index that represents the market's expectation of 30-day forward-looking volatility. Derived from the price inputs of the S&P 500 index options, it provides a measure of market risk and investors' sentiments. It is also known by other names like "Fear Gauge" or "Fear Index." Investors, research analysts and portfolio managers look to VIX values as a way to measure market risk, fear and stress before they take investment decisions
5-Safe Haven Demand : in this study GOLD demand is assumed
What to look for :
*Fear and Greed Index as explained above,
*Divergencies
Tool tip of the label displayed provides details of references
Conclusion:
As investors, we always get caught up in the day to day price movements, and lose sight of the bigger picture. The biggest crashes happen not when investors are cautious and fearful, it's when they're euphoric and expecting financial instruments to continue going higher. So as we continue investing, don’t forget to stop and ask yourself, where in the chart do you think we are right now? The Market Psychology Cycle shines light on how emotions evolve, fear and greed index can come in handy, provided that it is not the only tool used to make investment decisions. It is easy to look back at market cycles and recognize how the overall psychology changed. Analyzing previous data makes it obvious what actions and decisions would have been the most profitable. However, it is much harder to understand how the market is changing as it goes - and even harder to predict what comes next. Many investors use technical analysis (TA) to attempt to anticipate where the market is likely to go. Investors are advised to keep tabs on fear for potential buying the dips opportunities and view periods of greed as a potential indicator that financial instruments might be overvalued.
Warren Buffett's quote, buy when others are fearful, and sell when others are greedy
Trading success is all about following your trading strategy and the indicators should fit within your trading strategy, and not to be traded upon solely
Disclaimer : The script is for informational and educational purposes only. Use of the script does not constitute professional and/or financial advice. You alone have the sole responsibility of evaluating the script output and risks associated with the use of the script. In exchange for using the script, you agree not to hold dgtrd TradingView user liable for any possible claim for damages arising from any decision you make based on use of the script

Fearzone & Greedzone Levels - Contrarian & Breakout (Expo)"Be fearful when others are greedy, and greedy when others are fearful" - Warren Buffett. Fearzone & Greedzone Levels - Contrarian & Breakout (Expo) is a contrarian and breakout indicator that gives us an indication when fear and greed begins to take over in the market. Traders should be prepared for increased volatility and good trading opportunities.
This indicator can both be used to identify potential reversal points and be used to identify breakouts from previous Fear and Greed Levels.
The Fearzone and Greedzone can be visualized with candlesticks or with circles depending on what you prefer.
Alert conditions are added.
HOW TO USE
1. Use the indicator to identify when investors are fearful and greedy.
2. Use the indicator to identify potential reversal points.
3. Use the indicator to identify potential breakouts.
INDICATOR IN ACTION
4 hour chart
4 hour chart
I hope you find this indicator useful , and please comment or contact me if you like the script or have any questions/suggestions for future improvements. Thanks!
I will continually work on this indicator, so please share your experience and feedback as it will enable me to make even better improvements. Thanks to everyone that has already contacted me regarding my scripts. Your feedback is valuable for future developments!
-----------------
Disclaimer
Copyright by Zeiierman.
The information contained in my scripts/indicators/ideas does not constitute financial advice or a solicitation to buy or sell any securities of any type. I will not accept liability for any loss or damage, including without limitation any loss of profit, which may arise directly or indirectly from the use of or reliance on such information.
All investments involve risk, and the past performance of a security, industry, sector, market, financial product, trading strategy, or individual’s trading does not guarantee future results or returns. Investors are fully responsible for any investment decisions they make. Such decisions should be based solely on an evaluation of their financial circumstances, investment objectives, risk tolerance, and liquidity needs.
My scripts/indicators/ideas are only for educational purposes!

Fearzone (Expo) - Contrarian Indicator"Be fearful when others are greedy, and greedy when others are fearful" - Warren Buffett. Fearzone is a contrarian indicator that gives us an indication when fear begins to take over in the market. Traders should be prepared for increased volatility and good trading opportunities.
The Fearzone is visualized with red candlesticks below the price.
This version of the FearZone indicator is slightly different from the one ©kruskakli has published.
HOW TO USE
1. Use the indicator to identify when investors are fearful.
2. Use the indicator to identify potential reversal points.
INDICATOR IN ACTION
1 hour chart
5 min chart
I hope you find this indicator useful , and please comment or contact me if you like the script or have any questions/suggestions for future improvements. Thanks!
I will continually work on this indicator, so please share your experience and feedback as it will enable me to make even better improvements. Thanks to everyone that has already contacted me regarding my scripts. Your feedback is valuable for future developments!
-----------------
Disclaimer
Copyright by Zeiierman.
The information contained in my scripts/indicators/ideas does not constitute financial advice or a solicitation to buy or sell any securities of any type. I will not accept liability for any loss or damage, including without limitation any loss of profit, which may arise directly or indirectly from the use of or reliance on such information.
All investments involve risk, and the past performance of a security, industry, sector, market, financial product, trading strategy, or individual’s trading does not guarantee future results or returns. Investors are fully responsible for any investment decisions they make. Such decisions should be based solely on an evaluation of their financial circumstances, investment objectives, risk tolerance, and liquidity needs.
My scripts/indicators/ideas are only for educational purposes!

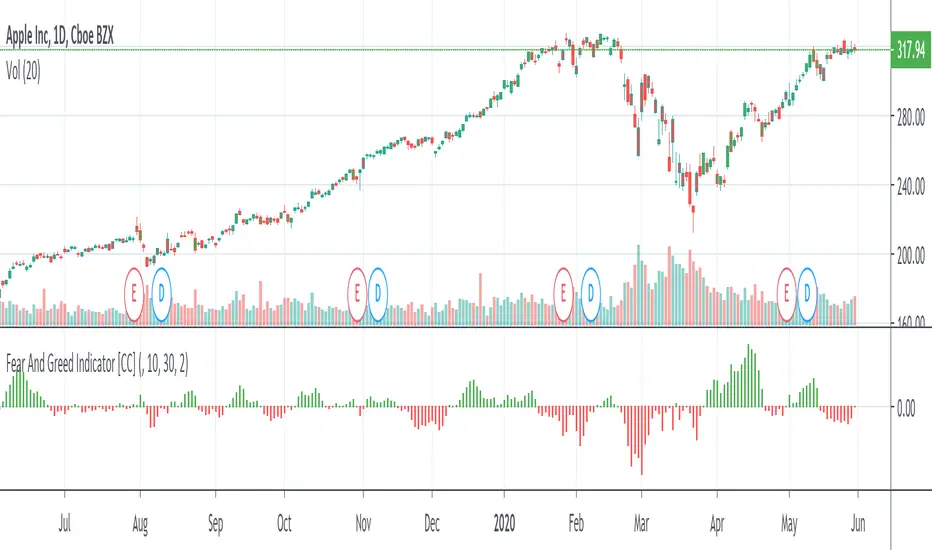
Fear And Greed IndicatorThe Fear And Greed Indicator is a very popular indicator on the Bloomberg platform and since I didn't have actual source code to work with, this is a very close approximation of that indicator. Let me know if you spot any discrepancies with the original and I will do my best to fix them.
For buy and sell signals it is pretty straightforward. Just buy when the green (greed) is in control and sell when the fear (red) is in control
This was a special request so let me know if you want to see more scripts from me or if you want something custom!
Bull and Bear Fear Expert by Walter Downs StrategyBull and Bear Fear Expert by Walter Downs Strategy

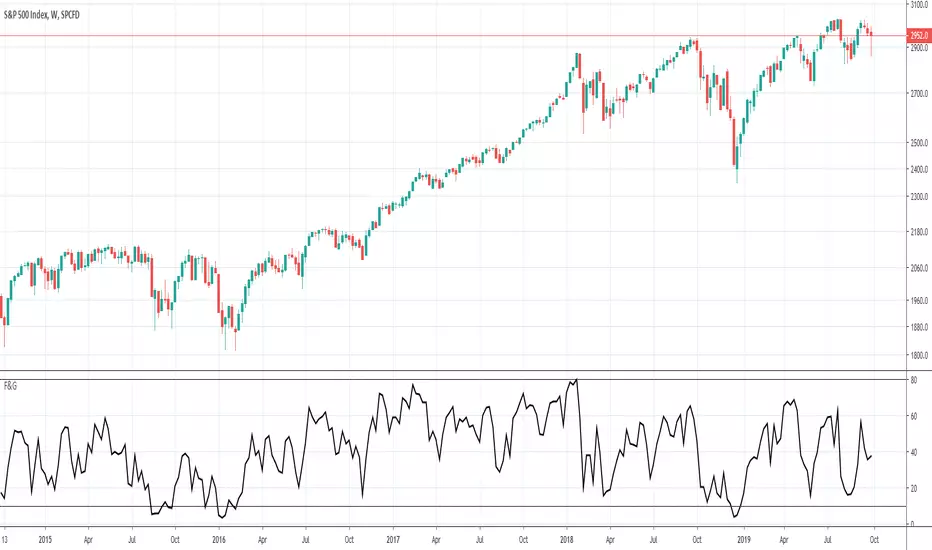
Fear & Greed Index-BuschiThis is an attempt to mimic the CNN Money "Fear & Greed Index": money.cnn.com
It's far from perfect, because the exact numbers can be a bit far off. Still, the highs and lows are quite on target. Alas, CNN does not give away too much information on how the index is calculated.
Feedback is most welcome.
Inverted Yield Curve with VIX Fear IndexUS 2 year and US 10 year comparison, inverted yield curve with VIX. I use this on a weekly chart with 2 moving averages, the 40 week (ma200 daily) and the 520 week (10 year median).
The bottom histogram is the VIX and the plot is the yield curve. When the VIX is above a certain level (you can set it in settings) and the ýield curve is close to or at inversion the background goes red.
The last seven recessions were preceded by an inverted yield curve. Here I combined the two main fear indexes, the VIX and the run for safe US treasuries (Inverted Yield Curve).
This is preset to the 2 year and 10 year US bond, weekly, and the normal VIX ticker but you can set it to whatever you like.
Published with source code for anyone to modify. Please comment below if you do so! This is the second in a series of indicators I intend to publish as a package of economic recoverty/recession symptom indicators.
Follow me for updates, next one up is commodities with dr Copper and oil!
