NEXT VWAP SlopeOverview:
This customizable oscillator tracks slope of the Volume-Weighted Average Price ( VWAP ) line, positive and negative, over a user-specified run (bar distance). It is highly responsive, far more so than VWAP alone, making it suitable for issuing long and short signals (especially around 0 crossovers) as well as exit signals at positive and negative extremes (corresponding to price-volume momentum exhaustion).
NASDAQ 100 Futures ( CME_MINI:NQ1! ) 1-minute trend following
The example below shows a NEXT VWAP Slope 0-crossover strategy, issuing long signals when the VWAP Slope line crosses over 0 and short when it crosses under it. You will need the NEXT Strategy Visualizer (free) to plot NEXT VWAP Slope's signals.
NEXT VWAP Slope is highly customizable, allowing you to change the length of the run (for smoother slopes), as well as the midline level - in the above example it is 0. The latter is useful if you want to introduce a bias into your strategies: long, if negative, short, if positive.
Input Parameters:
There are 2 groups of input.
Slope Settings
Slope Run - controls the length of time (in bars) for slope calculation with higher values yielding a smoother, more filtered, but less responsive curve
Midline - the NEXT VWAP Slope level above which market is considered long, below short; default is 0
Upper Limit - the NEXT VWAP Slope level above which market is considered overbought; default is 0 (off)
Lower Limit - the NEXT VWAP Slope level under which market is considered oversold; default is 0 (off)
VWAP Settings
Anchor Period - controls the origin of VWAP calculations, start of session being the default.
Source - data used for calculating the VWAP, typically HLC /3, but can be used with other price formats and data sources as well.
Offset - shifting of the VWAP line forward (+) or backward (-).
Here is how to set NEXT VWAP Slope crossing 0 alerts: open a chart, attach NEXT VWAP Slope, and right-click on chart -> Add Alert. Condition: NEXT VWAP Slope >> VWAP >> Crossing >> Value >> 0 >> Once Per Bar Close.
Following

Trend channel [log scale] with projection forecastTrend channel with projection forecast
This indicator is used to model data where growth or decay accelerates rapidly at first and then slows over time.
Because the channel distance is based off the largest pullback or highest peak within a trend, for effectively drawing and using this indicator it is recommended that this type of indicator is applied to mature trends .
This model is interesting for the long term series data (such as 10 or 20 years span) because can be plotted correctly on logarithmic charts .
Technical issues
*The user have to pan over the chart from the beginning to the end of the study range (such as 10 years of bars) so the pine script could generate those lines on the chart.
*If on the chart the number of bar is less than the lookback period, it won't generate any lines as well.
Disclaimer
Success in trading is all about following your trading strategy and indicators should fit into your own strategy, and not be traded purely on.
This script is for informational and educational purposes only. Use of the script does not constitute professional and / or financial advice. You are solely responsible for evaluating the outcome of the script and the risks associated with using the script. In exchange for the use of the script, you agree not to hold monpotejulien TradingView user responsible for any possible claims for damages arising out of any decisions you make based on the use of the script.

Pyramiding Entries On Early Trends (by Coinrule)Pyramiding the entries in a trading strategy may be risky but at the same time very profitable with a proper risk management approach. This strategy seeks to spot early signs of uptrends and increase the position's size while the right conditions persist.
Each trade comes with its stop-loss and take-profit to enforce a proportional risk/reward profile.
The strategy uses a mix of Moving Average based setups to define the buy-signal.
The Moving Average (200) is above the Moving Average (100), which prevents from buying when the uptrend is already in its late stages
The Moving Average (9) is above the Moving Average (100), indicating that the coin is not in a downtrend.
The price crossing above the Moving Average (9) confirms the potential upside used to fire the buy order.
Each entry comes with a stop-loss and a take-profit in a ratio of 1-to-1. After over 400 backtests, we opted for a 3% TP and 3% SL, which provides the best results.
The strategy is optimized on a 1-hour time frame.
The Advantages of this strategy are:
It offers the possibility of adjusting the size of the position proportionally to the confidence in the possibilities that an uptrend will eventually form.
Low drawdowns. On average, the percentage of trades in profit is above 60%, and the stop-loss equal to the take-profit reduces the overall risk.
This strategy returned good returns both with trading pairs with Fiat/stable coins and with BTC. Considering the mixed trends that cryptocurrencies experienced during 2020 vs BTC, this strengthens the strategy's reliability.
The strategy assumes each order to trade 20% of the available capital and pyramids the entries up to 7 times.
A trading fee of 0.1% is taken into account. The fee is aligned to the base fee applied on Binance, which is the largest cryptocurrency exchange.

The Lazy Trader - Index (ETF) Trend Following Robot50/150 moving average, index (ETF) trend following robot. Coded for people who cannot psychologically handle dollar-cost-averaging through bear markets and extreme drawdowns (although DCA can produce better results eventually), this robot helps you to avoid bear markets. Be a fair-weathered friend of Mr Market, and only take up his offer when the sun is shining! Designed for the lazy trader who really doesn't care...
Recommended Chart Settings:
Asset Class: ETF
Time Frame: Daily
Necessary ETF Macro Conditions:
a) Country must have healthy demographics, good ratio of young > old
b) Country population must be increasing
c) Country must be experiencing price-inflation
Default Robot Settings:
Slow Moving Average: 50 (integer) //adjust to suit your underlying index
Fast Moving Average: 150 (integer) //adjust to suit your underlying index
Bullish Slope Angle: 5 (degrees) //up angle of moving averages
Bearish Slope Angle: -5 (degrees) //down angle of moving averages
Average True Range: 14 (integer) //input for slope-angle formula
Risk: 100 (%) //100% risk means using all equity per trade
ETF Test Results (Default Settings):
SPY (1993 to 2020, 27 years), 332% profit, 20 trades, 6.4 profit factor, 7% drawdown
EWG (1996 to 2020, 24 years), 310% profit, 18 trades, 3.7 profit factor, 10% drawdown
EWH (1996 to 2020, 24 years), 4% loss, 26 trades, 0.9 profit factor, 36% drawdown
QQQ (1999 to 2020, 21 years), 232% profit, 17 trades, 3.6 profit factor, 2% drawdown
EEM (2003 to 2020, 17 years), 73% profit, 17 trades, 1.1 profit factor, 3% drawdown
GXC (2007 to 2020, 13 years), 18% profit, 14 trades, 1.3 profit factor, 26% drawdown
BKF (2009 to 2020, 11 years), 11% profit, 13 trades, 1.2 profit factor, 33% drawdown
A longer time in the markets is better, with the exception of EWH. 6 out of 7 tested ETFs were profitable, feel free to test on your favourite ETF (default settings) and comment below.
Risk Warning:
Not tested on commodities nor other financial products like currencies (code will not work), feel free to leave comments below.
Moving Average Slope Angle Formula:
Reproduced and modified from source:

EMA Slope - ValenteThis indicator will show you the EMA SLOPE as a HISTOGRAM.
Este indicador mostra a INCLINACAO da EMA como um HISTOGRAMA

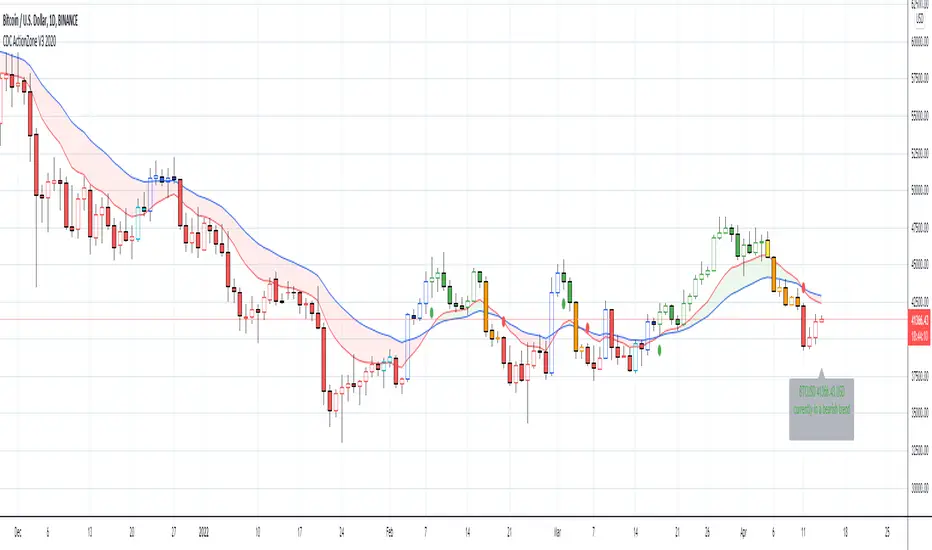
CDC ActionZone V3 2020## CDC ActionZone V3 2020 ##
This is an update to my earlier script, CDC ActionZone V2
The two scripts works slightly differently with V3 reacting slightly faster.
The main update is focused around conforming the standard to Pine Script V4.
## How it works ##
ActionZone is a very simple system, utilizing just two exponential moving
averages. The 'Zones' in which different 'actions' should be taken is
highlighted with different colors on the chart. Calculations for the zones
are based on the relative position of price to the two EMA lines and the
relationship between the two EMAs
CDCActionZone is your barebones basic, tried and true, trend following system
that is very simple to follow and has also proven to be relatively safe.
## How to use ##
The basic method for using ActionZone is to follow the green/red color.
Buy when bar closes in green.
Sell when bar closes in red.
There is a small label to help with reading the buy and sell signal.
Using it this way is safe but slow and is expected to have around 35-40%
accuracy, while yielding around 2-3 profit factors. The system works best
on larger time frames.
The more advanced method uses the zones to switch between different
trading system and biases, or in conjunction with other indicators.
example 1:
Buy when blue and Bullish Divergence between price and RSI is visible,
if not Buy on Green and vise-versa
example 2:
Set up a long-biased grid and trade long only when actionzone is in
green, yellow or orange.
change the bias to short when actionzone turns to te bearish side
(red, blue, aqua)
(Look at colors on a larger time frame)
## Note ##
The price field is set to close by default. change to either HL2 or OHLC4
when using the system in intraday timeframes or on market that does not close
(ie. Cryptocurrencies)
## Note2 ##
The fixed timeframe mode is for looking at the current signal on a larger time frame
ie. When looking at charts on 1h you can turn on fixed time frame on 1D to see the
current 'zone' on the daily chart plotted on to the hourly chart.
This is useful if you wanted to use the system's 'Zones' in conjunction with other
types of signals like Stochastic RSI, for example.
Uber Kuskus Starlight [UTS]General Usage
The Kuskus Starlight is a Zero-Line Indicator that produces signals based on zero line cross.
It is designed to offer traders the much needed information on trend direction. Just like the name suggests, the indicator produces starlight shaped bodies to form a slope that runs above or below the zero reference level.
Interestingly, the starlight shaped bodies are seen to alter their color between blue (when the starlight shaped bodies are above the zero reference level) and red (when the starlight shaped bodies are below the zero signal level).
Buy Signal
Buy Signal
Go long when the blue starlights get above the zero signal level.
Sell Signal
Go short when the red starlights go below the zero signal level.
Exit buy trade
Close all buy orders if while a bullish trend is ongoing, the Kuskus Starlight Indicator pops up a red starlight slightly below the zero level.
Exit sell trade
Close all sell orders if while a bearish trend is running, the Kuskus Starlight Indicator displays a blue starlight somewhat above the zero level.
Styles
Four different styles are available:
Original Starlight
Area Chart
Histograms
Line Chart
Line Chart
Signals
The (alert-) signal generating line crosses can optionally be shown.
Alerts
Traders can easily use the trend change signals to trigger alerts from:
Up Signal
Down Signal
Those values are > zero if a condition is triggered.
Alert condition example: "Up Signal" - "GreaterThan" - "0"

FRAMA - Supertrend strategyFRAMA Strategy
I found this strategy on internet, in a well-known forex forum.
I have translated the two indicators mentioned in that strategy (originally in mq4) in pine script.
Thanks to Fractured and Shizaru for the FRAMA snippets, to mejialucas for Supertrend snippet, to JayRogers for trade management snippet and to Trost for backtesting snippet.
I also added some code to have FRAME with a deiiferent timeframe
Indicators set-up:
FRAMA period 24 (it was originally 25 but it's better to use an even number)
FRAMA timefarme lower then chart timeframe (e.g. daily chart and weekly FRAMA)
Supertrend indicator as it is.
Of course, it is better to adapt above setting to traded instrument.
Long/Buy rules:
1 - Enter at crossover between FRAMA and its signal
2 - Option to filter entries based on supertrend signal
3 - Exit when Supertrend change direction;
4 - Exit long when short signal occurs;
Short/Sell rules:
1 - Enter at crossunder between FRAMA and its signal
2 - Option to filter entries based on supertrend signal
3 - Exit when Supertrend change direction;
4 - Exit short when long signal occurs;
VERY IMPORTANT NOTE: this is a trend following strategy, so the target is to stay in the trade as much as possible (drawdown my be high). If your trading style is more focused on scalping and/or pullbaks, this strategy is not for you.
Credits to who developed this startegy (google it).
Thanks to all pinescripters mentined in the code for their snippets.
I have also a study with alerts.
Please use comment section for any feedback or contact me if you need support.

Project MarsProject Mars is a next generation trend following system that finds a balance between the sensitivity and smoothness needed for well timed trades, without any lagging or repainting. This indicator has two sets of lines that help you with entries and exits with their respective crossover signals. The blue lines work together work together to try to give early signals to emerging trends. When the light blue line is over the dark blue line that is bullish, and when the light blue line is under the dark blue line that is bearish. The red lines work together to confirm new trends, they react slower than the blue lines but add an additional layer of confluence. When the light red line is over the dark red line that is bullish, and when the light red line is under the dark red line that is bearish. If you're looking for longer or shorter term opportunities you can set the lengths of the lines to be longer or shorter. If the lengths of the lines are satisfactory you can still adjust the sensitivity of the blue lines by adjusting the sensitivity setting.
This indicator works by a proprietary de-noising technique that does its best to decide which movements are just market noise and which movements traders should focus on.
To start your free four day trial please see the link below to receive access and free tutorials for this indicator!

Stochastic binary option styleUsing Time Frames For Trend – You can also use different time frames to determine trends with stochastic. To do this you will need to use two different time frame charts, I like to use the weekly/daily or daily/hourly combination depending on the asset. Weekly/daily works well with stocks and indices while I prefer the shorter time frame for currency and commodities. This is how it works; stochastic on the longer term chart sets trend, stochastic on the shorter term chart gives the signal. If, on the weekly chart, stochastic is pointing up then you would trade bullish signals on the daily charts. Or if using the daily/hourly combo the stochastic on the daily would set trend while signals would come from the hourly chart.
Green color bar and background means k is > d, the crowd is bullish (trend is bullish, a bullish crossover is happened), red is the contrary (bears are the leaders)
Credit to Michael Hodges

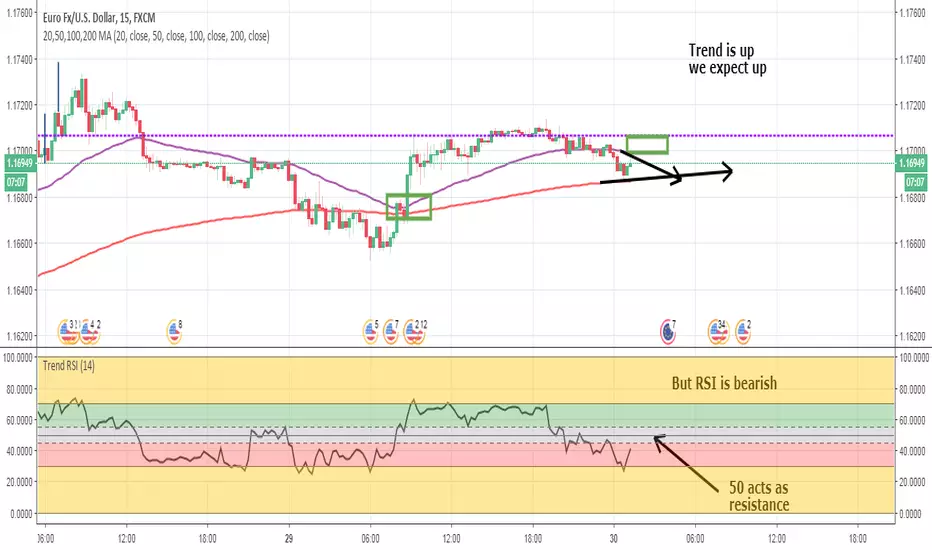
Trend RSIThis version of RSI shows the proper levels of how to trade price action.
RSI is more than a reversal tool. It is also a trend following tool.
I've added bands to show Overbought/Oversold.
Above 55 is bullish. Below 45 is bearish.
Do not make any transactions in the 45-55 gray band area.
Coupled with a 50/200 EMA strategy this is more than enough to make a living at trading.
Price FlowFor those who like to trade with the trend instead of against it. This little script shows you what side of the daily/weekly/monthly timeframe open, price is currently trading at so that you dont accidentally trade against the higher timeframe momentum. Timeframes are customizable through the indicator settings panel.
