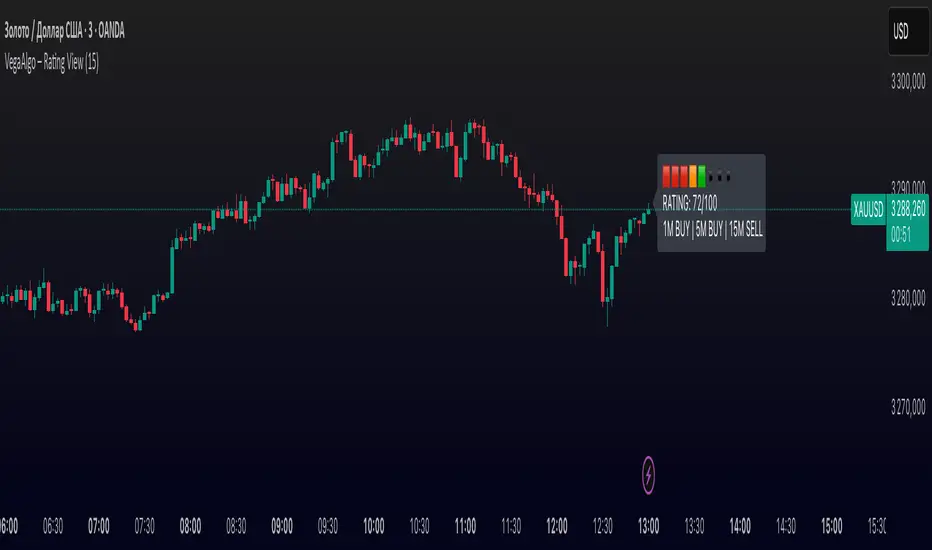
VegaAlgo – Rating ViewVegaAlgo – Rating View is a market condition analysis tool designed to evaluate the current price structure.
The indicator calculates a RATING (from 0 to 100) that reflects how clean, directional, and structured the recent price movement is. The rating is based on the number of price direction changes (from bullish to bearish candles and vice versa) within a selected period. Fewer direction changes indicate a clearer trend and result in a higher rating, while a choppy or highly volatile market leads to a lower score.
Additionally, the indicator provides directional signals on three key timeframes — 1M, 5M, and 15M, using a comparison of fast and slow moving averages. This allows traders to quickly assess the dominant trend both locally and across higher timeframes.
This script is intended for visual market analysis only and should not be considered financial advice.
Forecasting
[Mad]Triple Bollinger Bands ForecastTriple Bollinger Bands Forecast (BBx3+F)
This open-source indicator is an advanced version of the classic Bollinger Bands, designed to provide a more comprehensive and forward-looking view of market volatility and potential price levels.
It plots three distinct sets of Bollinger Bands and projects them into the future based on statistical calculations.
How It Is Built and Key Features
Triple Bollinger Bands: Instead of a single set of bands, this indicator plots three. All three share the same central basis line (a Simple Moving Average), but each has a different standard deviation multiplier. This creates three distinct volatility zones for analyzing price deviation from its mean.
Multi-Timeframe (MTF) Capability: The indicator can calculate and display Bollinger Bands from a higher timeframe (e.g., showing daily bands on a 4-hour chart). This allows for contextualizing price action within the volatility structure of a more significant trend.
(Lower HTF selection will result in script-crash!)
Future Forecasting: This is the indicator's main feature. It projects the calculated Bollinger Bands up to 8 bars into the future. This forecast is a recalculation of the Simple Moving Average and Standard Deviation based on a projected future source price.
Selectable Forecast Methods: The mathematical model for estimating the future source price can be selected:
Flat: A model that uses the most recent closing price as the price for all future bars in the calculation window.
Linreg (Linear Regression): A model that calculates a linear regression trend on the last few bars and projects it forward to estimate the future source price.
Efficient Drawing with Polylines: The future projections are drawn on the chart using Pine Script's polyline object. This is an efficient method that draws the forecast data only on the last bar, which avoids repainting issues.
Differences from a Classical Bollinger Bands Indicator
Band Count: A classical indicator shows one set of bands. This indicator plots three sets for a multi-layered view of volatility.
Perspective: Classical Bollinger Bands are purely historical. This indicator is both historical and forward-looking .
Forecasting: The classic version has no forecasting capability. This indicator projects the bands into the future .
Timeframe: The classic version works only on the current timeframe. This indicator has full Multi-Timeframe (MTF) support .
The Mathematics Behind the Future Predictions
The core challenge in forecasting Bollinger Bands is that a future band value depends on future prices, which are unknown. This indicator solves this by simulating a future price series. Here is the step-by-step logic:
Forecast the Source Price for the Next Bar
First, the indicator estimates what the price will be on the next bar.
Flat Method: The forecasted price is the current bar's closing price.
Price_forecast = close
Linreg Method: A linear regression is calculated on the last few bars and extrapolated one step forward.
Price_forecast = ta.linreg(close, linreglen, 1)
Calculate the Future SMA (Basis)
To calculate the Simple Moving Average for the next bar, a new data window is simulated. This window includes the new forecasted price and drops the oldest historical price. For a 1-bar forecast, the calculation is:
SMA_future = (Price_forecast + close + close + ... + close ) / length
Calculate the Future Standard Deviation
Similarly, the standard deviation for the next bar is calculated over this same simulated window of prices, using the new SMA_future as its mean.
// 1. Calculate the sum of squared differences from the new mean
d_f = Price_forecast - SMA_future
d_0 = close - SMA_future
// ... and so on for the rest of the window's prices
SumOfSquares = (d_f)^2 + (d_0)^2 + ... + (d_length-2)^2
// 2. Calculate future variance and then the standard deviation
Var_future = SumOfSquares / length
StDev_future = sqrt(Var_future)
Extending the Forecast (2 to 8 Bars)
For forecasts further into the future (e.g., 2 bars), the script uses the same single Price_forecast for all future steps in the calculation. For a 2-bar forecast, the simulated window effectively contains the forecasted price twice, while dropping the two oldest historical prices. This provides a statistically-grounded projection of where the Bollinger Bands are likely to form.
Usage as a Forecast Extension
This indicator's functionality is designed to be modular. It can be used in conjunction with as example Mad Triple Bollinger Bands MTF script to separate the rendering of historical data from the forward-looking forecast.
Configuration for Combined Use:
Add both the Mad Triple Bollinger Bands MTF and this Triple Bollinger Bands Forecast indicator to your chart.
Open the Settings for this indicator (BBx3+F).
In the 'General Settings' tab, disable the Activate Plotting option.
To ensure data consistency, the Bollinger Length, Multipliers, and Higher Timeframe settings should be identical across both indicators.
This configuration prevents the rendering of duplicate historical bands. The Mad Triple Bollinger Bands MTF script will be responsible for visualizing the historical and current bands, while this script will overlay only the forward-projected polyline data.

Maqs previous day close and today's highDifferenceIt gives previous day close and today's high Difference and hence capacity of the stock
Opening Range Breakout (ORB) with Fib RetracementOverview
“ORB with Fib Retracement” is a Pine Script indicator that anchors a full Fibonacci framework to the first minutes of the trading day (the opening-range breakout, or ORB).
After the ORB window closes the script:
Locks-in that session’s high and low.
Calculates a complete ladder of Fibonacci retracement levels between them (0 → 100 %).
Projects symmetric extension levels above and below the range (±1.618, ±2.618, ±3.618, ±4.618 by default).
Sub-divides every extension slice with additional 23.6 %, 38.2 %, 50 %, 61.8 % and 78.6 % mid-lines so each “zone” has its own inner fib grid.
Plots the whole structure and—optionally—extends every line into the future for ongoing reference.
**Session time / timezone** – Defines the ORB window (defaults 09:30–09:45 EST).
**Show All Fib Levels** – Toggles every retracement and extension line on or off.
**Show Extended Lines** – Draws dotted, extend-right projections of every level.
**Color group** – Assigns colors to buy-side (green), sell-side (red), and internal fibs (gray).
**Extension value inputs** – Allows custom +/- 1.618 to 4.618 fib levels for personalized projection zones.
EPS and Sales Magic Indicator V2EPS and Sales Magic Indicator V2
EPS and Sales Magic Indicator V2
Short Title: EPS V2
Author: Trading_Tomm
Platform: TradingView (Pine Script v6)
License: Free for public use under fair usage guidelines
Overview
The EPS and Sales Magic Indicator V2 is a powerful stock fundamental visualization tool built specifically for TradingView users who wish to incorporate earnings intelligence directly onto their price chart. Designed and developed by Trading_Tomm, this upgraded version of the original 'EPS and Sales Magic Indicator' includes an enriched and more insightful presentation of company performance metrics — now with TTM EPS support, advanced color-coding, label sizing, and refined control options.
This indicator is tailored for retail traders, swing investors, and long-term fundamental analysts who need to view Quarter-over-Quarter (QoQ) earnings and revenue changes directly on the price chart without switching tabs or breaking focus.
What Does It Display?
The EPS and Sales Magic Indicator V2 intelligently detects quarterly financial updates and displays the following data points via labels:
1. EPS (Earnings Per Share) – Current Quarterly Value
This is the most recent Diluted EPS published by the company, fetched using TradingView’s request.financial() function.
Displayed in the format: EPS: ₹20.45
2. EPS QoQ Percentage Change
Shows the percentage change in EPS compared to the previous quarter.
Highlights improvement or decline using arrows (up for improvement, down for decline).
Displayed in the format: EPS: ₹20.45 (up 15.3 percent)
3. Sales (Revenue) – Current Quarterly Value
Fetches and displays Total Revenue of the company in ₹Crores for easier Indian-market readability.
Displayed in the format: Sales: ₹460Cr
4. Sales QoQ Percentage Change
Measures and presents the quarter-over-quarter percentage change in total revenue.
Uses arrows to indicate growth or contraction.
Displayed in the format: Sales: ₹460Cr (down 3.8 percent)
5. EPS TTM (Trailing Twelve Months)
You now get the TTM EPS — the sum of the last four quarterly EPS values.
This value provides a better long-term earnings snapshot compared to a single quarter.
Displayed in the format: TTM EPS: ₹78.12
All of these values are automatically calculated and displayed only on the bars where a new financial report is detected, keeping your chart clean and insightful.
Customization Features
This indicator is built with user control in mind, allowing you to personalize how and what you want to see:
Show EPS in Label: Enable or disable the display of EPS and EPS QoQ values.
Show Sales in Label: Toggle the visibility of revenue and sales change percentage.
Color Options for Label Themes: The label background color is automatically determined based on performance.
Green: Both EPS and Sales increased QoQ.
Red: Both decreased.
Orange: One increased and the other decreased.
Gray: Default color (if values are unavailable or mixed).
Label Text Size: Choose from Tiny, Small (default), or Normal.
Visual Design
Placement: The labels are positioned just below the candlesticks using yloc.belowbar, so they do not obstruct price action or interfere with technical indicators.
Anchor: Aligned precisely with the financial reporting bars to maintain clarity in historical comparisons.
Background Style: Clean, semi-transparent styling with soft text colors for comfortable viewing.
How It Works
The indicator relies on TradingView’s powerful request.financial() function to extract fiscal quarterly financials (FQ). Internally, it uses detection logic to identify fresh data updates by comparing current vs. previous values, arithmetic to compute QoQ percentage changes in EPS and Sales, logic to build formatted labels dynamically based on user selections, and conditional color and sizing logic to enhance interpretability.
Use Cases
For Long-Term Investors: Quickly identify if a company’s profitability and revenue are improving over time.
For Swing Traders: Combine recent earnings trends with price action to evaluate if post-result momentum has real backing.
For Technical and Fundamental Traders: Layer it with moving averages, RSI, or volume to create a hybrid analysis environment.
Limitations and Notes
Financial data is provided by TradingView’s financial API, and occasional missing values may occur for less-covered stocks.
This tool does not repaint but depends on the timing of the official financial updates.
All values are rounded and formatted to prioritize readability.
Works best on Daily or higher timeframes (weekly or monthly also supported).
License and Fair Use
This script is free to use and share under TradingView’s open-use guidelines. You may copy, fork, and build upon this indicator for personal or educational purposes, but commercial usage requires attribution to the author: Trading_Tomm.
Future Enhancements (Planned)
Addition of Net Profit (QoQ and TTM)
Inclusion of Operating Margin, Profit Margin, and Book Value
Option to switch between numeric and graphical display (table mode)
Alerts on extreme earnings deviation or sales slumps
Final Thoughts
The EPS and Sales Magic Indicator V2 represents a clean, visual, and smart way to monitor a company’s core performance from your chart screen. It helps you align fundamental strength with technical strategies and provides instant financial clarity, which is especially vital in today’s fast-moving markets.
Whether you’re preparing for an earnings season or scanning past performance to pick your next investment, this indicator saves time, enhances insights, and sharpens decisions.

Initial balance - weeklyWeekly Initial Balance (IB) — Indicator Description
The Weekly Initial Balance (IB) is the price range (High–Low) established during the week’s first trading session (most commonly Monday). You can measure it over the entire day or just the first X hours (e.g. 60 or 120 minutes). Once that session ends, the IB High and IB Low define the key levels where the initial weekly range formed.
Why Measure the Weekly IB?
Week-Opening Sentiment:
Monday’s range often sets the tone for the rest of the week. Trading above the IB High signals bullish control; trading below the IB Low signals bearish control.
Key Liquidity Zones:
Large institutions tend to place orders around these extremes, so you’ll frequently see tests, breakouts, or rejections at these levels.
Support & Resistance:
The IB High and IB Low become natural barriers. Price will often return to them, bounce off them, or break through them—ideal spots for entries and exits.
Volatility Forecast:
The width of the IB (High minus Low) indicates whether to expect a volatile week (wide IB) or a quieter one (narrow IB).
Significance of IB Levels
Breakout:
A clear break above the IB High (for longs) or below the IB Low (for shorts) can ignite a strong trending move.
Fade:
A rejection off the IB High/Low during low momentum (e.g. low volume or pin-bar formations) offers a high-probability reversal trade.
Mid-Point:
The 50% level of the IB range often “magnetizes” price back to it, providing entry points for continuation or reversal strategies.
Three Core Monday IB Strategies
A. Breakout (Open-Range Breakout)
Entry: Wait for 1–2 candles (e.g. 5-minute) to close above IB High (long) or below IB Low (short).
Stop-Loss: A few pips below IB High (long) or above IB Low (short).
Profit-Target: 2–3× your risk (Reward:Risk ≥ 2:1).
Best When: You spot a clear impulse—such as a strong pre-open volume spike or news-driven move.
B. Fade (Reversal at Extremes)
Entry: When price tests IB High but shows weakening momentum (shrinking volume, upper-wick candles), enter short; vice versa for IB Low and longs.
Stop-Loss: Just beyond the IB extreme you’re fading.
Profit-Target: Back toward the IB mid-point (50% level) or all the way to the opposite IB extreme.
Best When: Monday’s action is range-bound and lacks a clear directional trend.
C. Mid-Point Trading
Entry: When price returns to the 50% level of the IB range.
In an up-trend: buy if it bounces off mid-point back toward IB High.
In a down-trend: sell if it reverses off mid-point back toward IB Low.
Stop-Loss: Just below the nearest swing-low (for longs) or above the nearest swing-high (for shorts).
Profit-Target: To the corresponding IB extreme (High or Low).
Best When: You see a strong initial move away from the IB, followed by a pullback to the mid-point.
Usage Steps
Configure your session: Measure IB over your chosen Monday timeframe (whole day or first X hours).
Choose your strategy: Align Breakout, Fade, or Mid-Point entries with the current market context (trend vs. range).
Manage risk: Keep risk per trade ≤ 1% of account and maintain at least a 2:1 Reward:Risk ratio.
Backtest & forward-test: Verify performance over multiple Mondays and in a paper-trading environment before going live.

Candle Closer Levels & TP Zones📝 Description:
This indicator is designed to provide intrabar trade levels for high-speed execution strategies, such as scalping and intraday momentum trading.
🧩 Key Features:
Plots High, Low, Mid, and two Quarter Levels on the current candle only, keeping charts clean
Take Profit (TP) lines are calculated as a percentage of candle range, not fixed ticks — this makes it highly adaptable for futures like NQ/ES or volatile markets like crypto
Supports both long and short setups via a simple toggle
Customizable colors, line thickness, and length
Each TP level can be enabled or muted individually
📈 Use Case:
Apply this tool to spot candle-based breakouts or rejections. You can scale TPs dynamically based on the strength of the current candle. This is especially helpful in assets where volatility fluctuates greatly intrabar.
This is not a repackaged built-in indicator — it’s purpose-built for real-time tactical level plotting without historical noise.

Multi-Position DashMulti-Position Dash — Risk Dashboard for Forex, Stocks & Indices
Overview:
The Multi-Position Dash is a highly customizable trading dashboard designed to help active traders manage up to 8 simultaneous positions across Forex, Stocks, and Indices. Whether you're trading single entries, layering positions, using DCA (Dollar Cost Averaging), or running complex hedging setups, this tool provides essential, real-time risk and P&L insights—directly on your chart.
Key Features:
✔️ Supports Forex, Stocks, Indices — with automatic pip and contract conversions
✔️ Track up to 8 manual positions, each with customizable direction, lot size or contracts, entry price, Take Profit, and Stop Loss
✔️ Full GBP-based P&L and risk calculation, including automatic USD-to-GBP conversion for non-FX assets
✔️ Real-time display of:
Total potential Take Profit (GBP)
Total potential Stop Loss (GBP)
Risk % relative to account balance
Live P&L (GBP) based on current price
✔️ Breakeven price calculation, even across mixed-direction positions (DCA & hedging aware)
✔️ Visual breakeven line, live P&L arrows, and entry price markers
✔️ Shared Stop Loss option for all positions — perfect for DCA traders
✔️ Easy export strings for logging trades to external tools like spreadsheets
Ideal For:
✅ Forex traders using lot-based risk models
✅ Stock & Index traders wanting simplified contract-based position tracking
✅ Traders managing multiple active positions, with or without hedging
✅ Anyone needing at-a-glance P&L and risk monitoring, independent of broker platforms
Notes & Usage:
This is a manual tracking tool—you enter your positions, TP, SL levels, etc., and the dashboard calculates the rest. It does not place or manage live orders.
Supports both Long and Short positions.
All calculations are based on your inputs and market price—accuracy depends on maintaining your inputs properly.
Shared Stop Loss feature applies a single, unified stop across all active positions for simplified risk control in DCA setups.
GBP is used as the account currency—USD-to-GBP conversion is applied to stocks and indices as needed.
Disclaimer:
This tool is for educational and planning purposes only. It does not place or manage live trades, and is not a substitute for broker risk management tools. Always double-check your own position sizing and risk before placing live orders.

ATR FX DashboardATR FX Dashboard – Multi-Timeframe Volatility Monitor
Overview:
The ATR FX Dashboard provides a quick, at-a-glance view of market volatility across multiple timeframes for any forex pair. It uses the well-known Average True Range (ATR) indicator to display real-time volatility information in both pips and percentage terms, helping traders assess potential risk, position sizing, and market conditions.
How It Works:
This dashboard displays:
✔ ATR in Pips — The average price movement over a given timeframe, converted to pips for easy interpretation, automatically adjusting for JPY pairs.
✔ ATR as a Percentage of Price — Shows how significant the ATR is relative to the current price. Higher percentages often signal higher volatility or more active markets.
✔ Color-Coded Volatility Highlights — On the daily timeframe, ATR % cells are color-coded:
Green: High volatility
Orange: Moderate volatility
Red: Low volatility
Timeframes Displayed:
15 Minutes
1 Hour
4 Hour
Daily
This gives traders a clear, multi-timeframe view of short-term and broader market volatility conditions, directly on the chart.
Ideal For:
✅ Forex traders seeking quick, reliable volatility reference points
✅ Day traders and swing traders needing help with risk assessment and position sizing
✅ Anyone using ATR-based strategies or simply wanting to stay aware of changing market conditions
Additional Features:
Toggle option to display or hide ATR % relative to price
Automatic pip conversion for JPY pairs
Simple, clean table layout in the bottom-right corner of the chart
Supports all forex symbols
Disclaimer:
This tool is for informational purposes only and is not financial advice. As with all technical indicators, it should be used in conjunction with other tools and proper risk management.

M2 Liquidity Divergence ModelM2 Liquidity Divergence Model
The M2 Liquidity Divergence Model is a macro-aware visualization tool designed to compare shifts in global liquidity (M2) against the performance of a benchmark asset (default: Bitcoin). This script captures liquidity flows across major global economies and highlights whether price action is aligned ("Agreement") or diverging ("Divergence") from macro trends.
🔍 Core Features
M2 Global Liquidity Index (GLI):
Aggregates M2 money supply from major global economies, FX-adjusted, including extended contributors like India, Brazil, and South Africa. The slope of this composite is used to infer macro liquidity trends.
Lag Offset Control:
Allows the M2 signal to lead benchmark asset price by a configurable number of days (Lag Offset), useful for modeling the forward-looking nature of macro flows.
Gradient Macro Context (Background):
Displays a color-gradient background—aqua for expansionary liquidity, fuchsia for contraction—based on the slope and volatility of M2. This contextual backdrop helps users visually anchor price action within macro shifts.
Divergence Histogram (Optional):
Plots a histogram showing dynamic correlation or divergence between the liquidity index and the selected benchmark.
Agreement Mode: M2 and asset are moving together.
Divergence Mode: Highlights break in expected macro-asset alignment.
Adaptive Transparency Scaling:
Histogram and background gradients scale their visual intensity based on statistical deviation to emphasize stronger signals.
Toggle Options:
Show/hide the M2 Liquidity Index line.
Show/hide divergence histogram.
Enable/disable visual offset of M2 to benchmark.
🧠 Suggested Usage
Macro Positioning: Use the background context to align directional trades with macro liquidity flows.
Disagreement as Signal: Use divergence plots to identify when price moves against macro expectations—potential reversal or exhaustion zones.
Time-Based Alignment: Adjust Lag Offset to synchronize M2 signals with asset price behavior across different market conditions.
⚠️ Disclaimer
This indicator is designed for educational and analytical purposes only. It does not constitute financial advice or an investment recommendation. Always conduct your own research and consult a licensed financial advisor before making trading decisions.

MNQ/NQ Risk Management ToolThis tool helps MNQ and NQ futures traders automatically calculate position size based on either a fixed dollar risk or a percentage of account balance.
Simply enter your stop loss level and choose whether to risk a set dollar amount or a percentage of your account. The script will display how many contracts to trade based on your setup.
Features:
Calculates contracts based on stop loss and risk size
Toggle between dollar-based or percent-of-account risk
Works with both MNQ ($2/point) and NQ ($20/point)
Automatically updates based on current price and direction (long or short)
Displays a clean info box on your chart with risk, contracts, and settings
This tool is ideal for intraday or swing traders who want to stay consistent with risk management across trades.

Bitcoin Power Law Clock [LuxAlgo]The Bitcoin Power Law Clock is a unique representation of Bitcoin prices proposed by famous Bitcoin analyst and modeler Giovanni Santostasi.
It displays a clock-like figure with the Bitcoin price and average lines as spirals, as well as the 12, 3, 6, and 9 hour marks as key points in the cycle.
🔶 USAGE
Giovanni Santostasi, Ph.D., is the creator and discoverer of the Bitcoin Power Law Theory. He is passionate about Bitcoin and has 12 years of experience analyzing it and creating price models.
As we can see in the above chart, the tool is super intuitive. It displays a clock-like figure with the current Bitcoin price at 10:20 on a 12-hour scale.
This tool only works on the 1D INDEX:BTCUSD chart. The ticker and timeframe must be exact to ensure proper functionality.
According to the Bitcoin Power Law Theory, the key cycle points are marked at the extremes of the clock: 12, 3, 6, and 9 hours. According to the theory, the current Bitcoin prices are in a frenzied bull market on their way to the top of the cycle.
🔹 Enable/Disable Elements
All of the elements on the clock can be disabled. If you disable them all, only an empty space will remain.
The different charts above show various combinations. Traders can customize the tool to their needs.
🔹 Auto scale
The clock has an auto-scale feature that is enabled by default. Traders can adjust the size of the clock by disabling this feature and setting the size in the settings panel.
The image above shows different configurations of this feature.
🔶 SETTINGS
🔹 Price
Price: Enable/disable price spiral, select color, and enable/disable curved mode
Average: Enable/disable average spiral, select color, and enable/disable curved mode
🔹 Style
Auto scale: Enable/disable automatic scaling or set manual fixed scaling for the spirals
Lines width: Width of each spiral line
Text Size: Select text size for date tags and price scales
Prices: Enable/disable price scales on the x-axis
Handle: Enable/disable clock handle
Halvings: Enable/disable Halvings
Hours: Enable/disable hours and key cycle points
🔹 Time & Price Dashboard
Show Time & Price: Enable/disable time & price dashboard
Location: Dashboard location
Size: Dashboard size

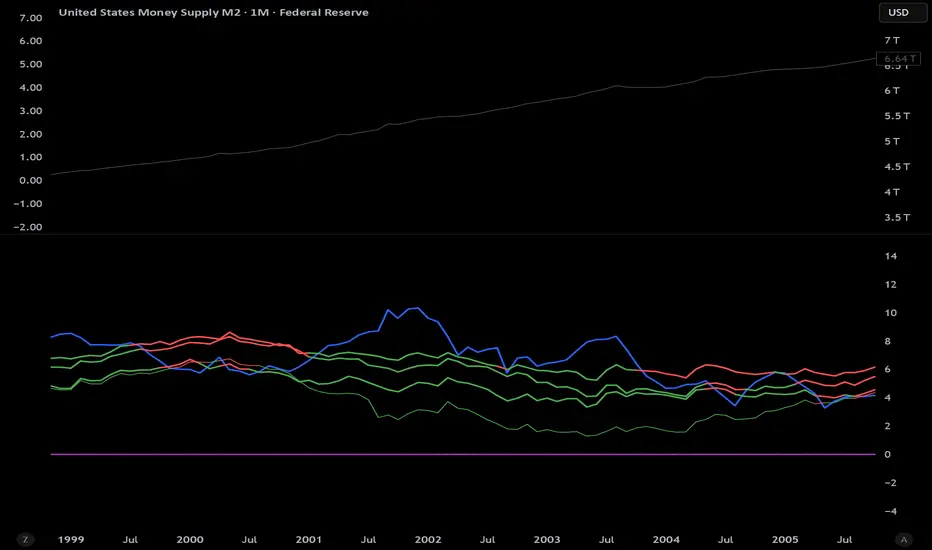
M2 Growth Rate vs Borrowing RateHave you ever wondered how fast M2 is actually growing? Have you ever wanted to compare its percentage growth rate to the actual cost of borrowing? Are you also, like me, a giant nerd with too much time on your hands?
M2 Growth Rate vs Borrowing Rate
This Pine Script indicator analyzes the annualized growth rate of M2 money supply and compares it to key borrowing rates, providing insights into the relationship between money supply expansion and borrowing costs. Users can select between US M2 or a combined M2 (aggregating US, EU, China, Japan, and UK money supplies, adjusted for currency exchange rates). The M2 growth period is customizable, offering options from 1 month to 5 years for flexible analysis over different time horizons. The indicator fetches monthly data for US M2, EU M2, China M2, Japan M2, UK M2, and exchange rates (EURUSD, CNYUSD, JPYUSD, GBPUSD) to compute the combined M2 in USD terms.
It plots the annualized M2 growth rate alongside borrowing rates, including US 2-year and 10-year Treasury yields, corporate bond effective yield, high-yield bond effective yield, and 30-year US mortgage rates. Borrowing rates are color-coded for clarity: red if the rate exceeds the selected M2 growth rate, and green if below, highlighting relative dynamics. Displayed on a separate pane with a zero line for reference, the indicator includes labeled plots for easy identification.
This tool is designed for informational purposes, offering a visual framework to explore economic trends without providing trading signals or financial advice.
Bitcoin Power Law [LuxAlgo]The Bitcoin Power Law tool is a representation of Bitcoin prices first proposed by Giovanni Santostasi, Ph.D. It plots BTCUSD daily closes on a log10-log10 scale, and fits a linear regression channel to the data.
This channel helps traders visualise when the price is historically in a zone prone to tops or located within a discounted zone subject to future growth.
🔶 USAGE
Giovanni Santostasi, Ph.D. originated the Bitcoin Power-Law Theory; this implementation places it directly on a TradingView chart. The white line shows the daily closing price, while the cyan line is the best-fit regression.
A channel is constructed from the linear fit root mean squared error (RMSE), we can observe how price has repeatedly oscillated between each channel areas through every bull-bear cycle.
Excursions into the upper channel area can be followed by price surges and finishing on a top, whereas price touching the lower channel area coincides with a cycle low.
Users can change the channel areas multipliers, helping capture moves more precisely depending on the intended usage.
This tool only works on the daily BTCUSD chart. Ticker and timeframe must match exactly for the calculations to remain valid.
🔹 Linear Scale
Users can toggle on a linear scale for the time axis, in order to obtain a higher resolution of the price, (this will affect the linear regression channel fit, making it look poorer).
🔶 DETAILS
One of the advantages of the Power Law Theory proposed by Giovanni Santostasi is its ability to explain multiple behaviors of Bitcoin. We describe some key points below.
🔹 Power-Law Overview
A power law has the form y = A·xⁿ , and Bitcoin’s key variables follow this pattern across many orders of magnitude. Empirically, price rises roughly with t⁶, hash-rate with t¹² and the number of active addresses with t³.
When we plot these on log-log axes they appear as straight lines, revealing a scale-invariant system whose behaviour repeats proportionally as it grows.
🔹 Feedback-Loop Dynamics
Growth begins with new users, whose presence pushes the price higher via a Metcalfe-style square-law. A richer price pool funds more mining hardware; the Difficulty Adjustment immediately raises the hash-rate requirement, keeping profit margins razor-thin.
A higher hash rate secures the network, which in turn attracts the next wave of users. Because risk and Difficulty act as braking forces, user adoption advances as a power of three in time rather than an unchecked S-curve. This circular causality repeats without end, producing the familiar boom-and-bust cadence around the long-term power-law channel.
🔹 Scale Invariance & Predictions
Scale invariance means that enlarging the timeline in log-log space leaves the trajectory unchanged.
The same geometric proportions that described the first dollar of value can therefore extend to a projected million-dollar bitcoin, provided no catastrophic break occurs. Institutional ETF inflows supply fresh capital but do not bend the underlying slope; only a persistent deviation from the line would falsify the current model.
🔹 Implications
The theory assigns scarcity no direct role; iterative feedback and the Difficulty Adjustment are sufficient to govern Bitcoin’s expansion. Long-term valuation should focus on position within the power-law channel, while bubbles—sharp departures above trend that later revert—are expected punctuations of an otherwise steady climb.
Beyond about 2040, disruptive technological shifts could alter the parameters, but for the next order of magnitude the present slope remains the simplest, most robust guide.
Bitcoin behaves less like a traditional asset and more like a self-organising digital organism whose value, security, and adoption co-evolve according to immutable power-law rules.
🔶 SETTINGS
🔹 General
Start Calculation: Determine the start date used by the calculation, with any prior prices being ignored. (default - 15 Jul 2010)
Use Linear Scale for X-Axis: Convert the horizontal axis from log(time) to linear calendar time
🔹 Linear Regression
Show Regression Line: Enable/disable the central power-law trend line
Regression Line Color: Choose the colour of the regression line
Mult 1: Toggle line & fill, set multiplier (default +1), pick line colour and area fill colour
Mult 2: Toggle line & fill, set multiplier (default +0.5), pick line colour and area fill colour
Mult 3: Toggle line & fill, set multiplier (default -0.5), pick line colour and area fill colour
Mult 4: Toggle line & fill, set multiplier (default -1), pick line colour and area fill colour
🔹 Style
Price Line Color: Select the colour of the BTC price plot
Auto Color: Automatically choose the best contrast colour for the price line
Price Line Width: Set the thickness of the price line (1 – 5 px)
Show Halvings: Enable/disable dotted vertical lines at each Bitcoin halving
Halvings Color: Choose the colour of the halving lines

Intraweek Highs & Lows🔎 Track and analyze intraweek price extremes with full flexibility.
The indicator detects weekly highs or lows for any selected weekday and monitors when other days break those levels.
⚙️ Inputs
Select day
Pick which weekday’s extreme you want to monitor.
Find Low/High
Select whether you want to track Lows or Highs.
Use candle Wick/Body
Choose if extremes are calculated by full wick or candle body.
Cutoff date
Toggle the date-based filter and choose the starting date for event display.

RACZ-SIGNAL-V2.1RACZ-SIGNAL-V2.1 – Reactive Analytical Confluence Zones
Developed by: RACZ Trading
Indicator Type: Multi-Factor Confluence System
Overlay: Off (separate pane)
Purpose: Detect powerful trade opportunities through confluence of technical signals.
⸻
🔍 What is RACZ?
RACZ stands for Reactive Analytical Confluence Zones.
It’s a high-precision trading tool built for traders who rely on multi-signal confirmation, momentum alignment, and market structure awareness.
Rather than relying on a single technical metric, RACZ dynamically combines RSI, VWAP-RSI, Divergence, ADX, and Volume Analytics to produce a composite signal score from 0 to 12 — the higher the score, the stronger the signal.
⸻
🧠 How It Works – Core Components
1. RSI Analysis
• Detects momentum shifts.
• Compares RSI value to overbought (default: 67) and oversold (default: 33) thresholds.
• Adds points to Bullish or Bearish score.
2. VWAP-RSI
• Uses RSI based on VWAP (Volume Weighted Average Price).
• Adds weight to signals influenced by volume-adjusted price movement.
3. Divergence Detection
• Detects potential reversal zones.
• Bullish Divergence: RSI crosses up from low zone.
• Bearish Divergence: RSI crosses down from high zone.
• Strong confluence signal when present.
4. ADX Dynamic Strength Filter
• Custom-calculated ADX (trend strength indicator).
• Uses a dynamic threshold derived from SMA of ADX over a lookback period, scaled by a factor (default 0.9).
• Ensures signals are only validated in strong trend environments.
5. Volume Z-Score
• Detects anomalies in volume behavior.
• Z-score applied to 20-period volume average & deviation.
• Labels spikes, drops, high/low volume conditions.
⸻
📊 Signal Scoring Logic
Each component (RSI, VWAP-RSI, Divergence, ADX) can score up to 3 points each.
• Bullish Score: Total from bullish alignment of each factor.
• Bearish Score: Total from bearish alignment of each factor.
• Signal Power = max(bullish, bearish)
📈 Signal Interpretation
• BUY: Bullish Score > Bearish Score
• SELL: Bearish Score > Bullish Score
• NEUTRAL: Scores are equal
• Signal power is plotted on a 0–12 histogram:
• 0–5 = Weak
• 6–8 = Medium
• 9–12 = Strong (High Confluence Zone)
🖥️ Live Status Panel (Top-Right Corner)
This real-time panel helps you break down the signal:Component
Value Explanation: RSI / VWAP / DIV / ADX
Shows points contributing to signal
SIGNAL: Current market bias (BUY, SELL, NEUTRAL)
VOLUME: Volume classification (Spike, Drop, High, Low, Normal)
Color-coded for quick interpretation.
✅ How to Use
1. Look at Histogram: Bars ≥6 suggest valid setups, especially ≥9.
2. Confirm Panel Agreement: Check which components are supporting the signal.
3. Validate Volume: Unusual spikes/drops often precede strong moves.
4. Follow Direction: Use BUY/SELL signals aligned with signal power and trend.
⸻
⚙️ Customizable Inputs
• RSI period, overbought/oversold levels
• VWAP-RSI period
• ADX period and dynamic threshold settings
• Fully adjustable to fit any trading style
⸻
🚀 Why Choose RACZ?
• Clarity: Scores & signals derived from multiple tools, not just one.
• Confluence Logic: Designed for traders who look for confirmation across indicators.
• Speed: Real-time responsiveness to changing market dynamics.
• Volume Awareness: Integrated volume intelligence gives a deeper edge.
⸻
⚠️ Disclaimer
This indicator is intended strictly for educational and informational purposes only. It is not financial advice and should not be used to make actual investment decisions. Always conduct your own research or consult with a licensed financial advisor before trading or investing. Use of this script is at your own risk.

Yelober_Momentum_BreadthMI# Yelober_Momentum_BreadthMI: Market Breadth Indicator Analysis
## Overview
The Yelober_Momentum_BreadthMI is a comprehensive market breadth indicator designed to monitor market internals across NYSE and NASDAQ exchanges. It tracks several key metrics including up/down volume ratios, TICK readings, and trend momentum to provide traders with real-time insights into market direction, strength, and potential turning points.
## Indicator Components
This indicator displays a table with data for:
- NYSE breadth metrics
- NASDAQ breadth metrics
- NYSE TICK data and trends
- NASDAQ TICK (TICKQ) data and trends
## Table Columns and Interpretation
### Column 1: Market
Identifies the data source:
- **NYSE**: New York Stock Exchange data
- **NASDAQ**: NASDAQ exchange data
- **Tick**: NYSE TICK index
- **TickQ**: NASDAQ TICK index
### Column 2: Ratio
Shows the current ratio values with different calculations depending on the row:
- **For NYSE/NASDAQ rows**: Displays the up/down volume ratio
- Positive values (green): More up volume than down volume
- Negative values (red): More down volume than up volume
- The magnitude indicates the strength of the imbalance
- **For Tick/TickQ rows**: Shows the ratio of positive to negative ticks plus the current TICK reading in parentheses
- Format: "Ratio (Current TICK value)"
- Positive values (green): More stocks ticking up than down
- Negative values (red): More stocks ticking down than up
### Column 3: Trend
Displays the directional trend with both a symbol and value:
- **For NYSE/NASDAQ rows**: Shows the VOLD (volume difference) slope
- "↗": Rising trend (positive slope)
- "↘": Falling trend (negative slope)
- "→": Neutral/flat trend (minimal slope)
- **For Tick/TickQ rows**: Shows the slope of the ratio history
- Color-coding: Green for positive momentum, Red for negative momentum, Gray for neutral
The trend column is particularly important as it shows the current momentum of the market. The indicator applies specific thresholds for color-coding:
- NYSE: Green when normalized value > 2, Red when < -2
- NASDAQ: Green when normalized value > 3.5, Red when < -3.5
- TICK/TICKQ: Green when slope > 0.01, Red when slope < -0.01
## How to Use This Indicator
### Basic Interpretation
1. **Market Direction**: When multiple rows show green ratios and upward trends, it suggests strong bullish market internals. Conversely, red ratios and downward trends indicate bearish internals.
2. **Market Breadth**: The magnitude of the ratios indicates how broad-based the market movement is. Higher absolute values suggest stronger market breadth.
3. **Momentum Shifts**: When trend arrows change direction or colors shift, it may signal a potential reversal or change in market momentum.
4. **Divergences**: Look for divergences between different markets (NYSE vs NASDAQ) or between ratios and trends, which can indicate potential market turning points.
### Advanced Usage
- **Volume Normalization**: The indicator includes options to normalize volume data (none, tens, thousands, millions, 10th millions) to handle different exchange scales.
- **Trend Averaging**: The slope calculation uses an averaging period (default: 5) to smooth out noise and identify more reliable trend signals.
## Examples for Interpretation
### Example 1: Strong Bullish Market
```
| Market | Ratio | Trend |
|--------|---------|-----------|
| NYSE | 1.75 | ↗ 2.85 |
| NASDAQ | 2.10 | ↗ 4.12 |
| Tick | 2.45 (485) | ↗ 0.05 |
| TickQ | 1.95 (320) | ↗ 0.03 |
```
**Interpretation**: All metrics are positive and trending upward (green), indicating a strong, broad-based rally. The high ratio values show significant bullish dominance. This suggests continuation of the upward move with good momentum.
### Example 2: Weakening Market
```
| Market | Ratio | Trend |
|--------|---------|-----------|
| NYSE | 0.45 | ↘ -1.50 |
| NASDAQ | 0.85 | → 0.30 |
| Tick | 0.95 (105) | ↘ -0.02 |
| TickQ | 1.20 (160) | → 0.00 |
```
**Interpretation**: The market is showing mixed signals with positive but low ratios, while NYSE and TICK trends are turning negative. NASDAQ shows neutral to slightly positive momentum. This divergence often occurs near market tops or during consolidation phases. Traders should be cautious and consider reducing position sizes.
### Example 3: Negative Market Turning Positive
```
| Market | Ratio | Trend |
|--------|---------|-----------|
| NYSE | -1.25 | ↗ 1.75 |
| NASDAQ | -0.95 | ↗ 2.80 |
| Tick | -1.35 (-250) | ↗ 0.04 |
| TickQ | -1.10 (-180) | ↗ 0.02 |
```
**Interpretation**: This is a potential bottoming pattern. Current ratios are still negative (red) showing overall negative breadth, but the trends are all positive (green arrows), indicating improving momentum. This divergence often occurs at market bottoms and could signal an upcoming reversal. Look for confirmation with price action before establishing long positions.
### Example 4: Mixed Market with Divergence
```
| Market | Ratio | Trend |
|--------|---------|-----------|
| NYSE | 1.45 | ↘ -2.25 |
| NASDAQ | -0.85 | ↘ -3.80 |
| Tick | 1.20 (230) | ↘ -0.03 |
| TickQ | -0.75 (-120) | ↘ -0.02 |
```
**Interpretation**: There's a significant divergence between NYSE (positive ratio) and NASDAQ (negative ratio), while all trends are negative. This suggests sector rotation or a market that's weakening but with certain segments still showing strength. Often seen during late-stage bull markets or in transitions between leadership groups. Consider reducing risk exposure and focusing on relative strength sectors.
## Practical Trading Applications
1. **Confirmation Tool**: Use this indicator to confirm price movements. Strong breadth readings in the direction of the price trend increase confidence in trade decisions.
2. **Early Warning System**: Watch for divergences between price and breadth metrics, which often precede market turns.
3. **Intraday Trading**: The real-time nature of TICK and volume data makes this indicator valuable for day traders to gauge intraday momentum shifts.
4. **Market Regime Identification**: Sustained readings can help identify whether the market is in a trend or chop regime, allowing for appropriate strategy selection.
This breadth indicator is most effective when used in conjunction with price action and other technical indicators rather than in isolation.

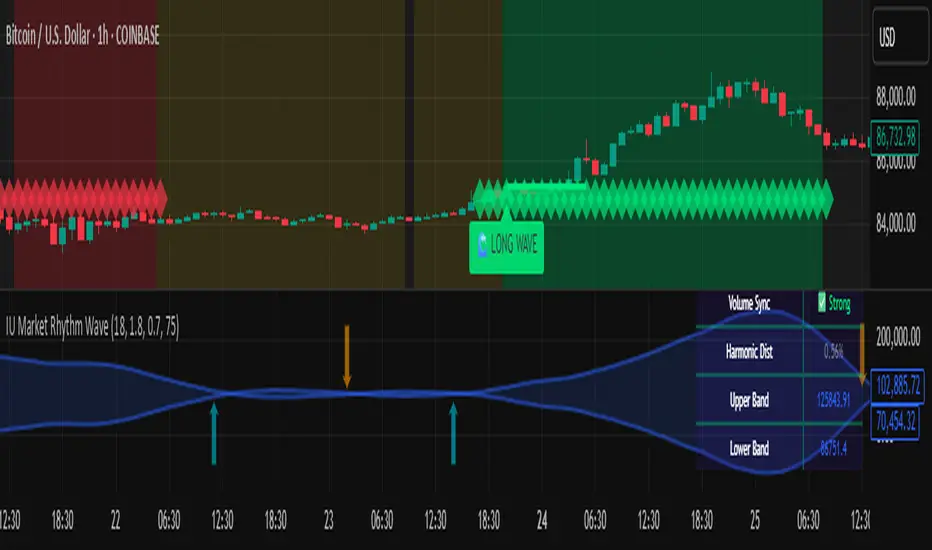
IU Market Rhythm WaveDESCRIPTION:
The IU Market Rhythm Wave is a multi-dimensional indicator designed to reveal the underlying rhythm and energy of the market. By analyzing price momentum, harmonic oscillations, volume behavior, and market breadth, it helps traders identify high-quality long and short wave signals. It also visualizes rhythm bands, wave strength zones, and harmonic levels to provide comprehensive context for decision-making.
This tool is best used on trending instruments where rhythm cycles and volume patterns create clear wave-based opportunities.
USER INPUTS:
Rhythm Cycle Length
Controls the main lookback period used to calculate price waves, harmonic oscillation, volume rhythm, and breath. A longer cycle smooths signals, while a shorter cycle makes them more responsive. Recommended range: 8 to 35.
Wave Signal Strength
Multiplies the standard deviation of rhythm to define dynamic breakout thresholds. A higher value results in fewer but stronger signals, filtering out minor fluctuations.
Harmonic Filter
Applies a sensitivity filter to the harmonic mean and standard deviation. It helps eliminate weak or noisy signals and ensures rhythm-based signals align with harmonic structure.
Show Wave Energy Zones
Toggles background color shading based on current rhythm conditions. Greenish zones indicate strong upward rhythm, red for strong downward rhythm, yellow for positive bias, and gray for weak or neutral zones.
Show Rhythm Bands
Enables the display of upper and lower rhythm bands derived from ATR and rhythm volatility. These bands act as dynamic price envelopes and potential support/resistance zones.
Wave Zone Opacity
Adjusts the transparency of background energy zones, allowing users to control how prominent these zones appear on the chart. Range: 60 to 90 for optimal visibility.
INDICATOR LOGIC:
The indicator combines multiple rhythmic components into a composite rhythm score:
1. Price Wave – Based on momentum (rate of price change) smoothed by a moving average.
2. Harmonic Oscillation – Measures how far price has deviated from a central harmonic average (HLC3).
3. Volume Rhythm – Uses volume’s deviation from its mean, standardized by its volatility.
4. Market Breath – Captures range expansion and closing strength relative to range.
These elements form the Raw Rhythm, which is further smoothed to produce the Market Rhythm. When the rhythm exceeds statistically calculated thresholds and other conditions like volume confirmation and harmonic proximity are met, wave signals are triggered.
Harmonic Fibonacci levels (0.236, 0.382, 0.618, 0.764) are also calculated every rhythm cycle to identify nearby structural price zones. Signals occurring near these levels are considered more reliable.
The Rhythm Bands use ATR and rhythm strength to define dynamic boundaries above and below price. Visual zones and arrows mark rhythm shifts and highlight the underlying energy of the market.
WHY IT IS UNIQUE:
This indicator goes beyond traditional oscillators or volume indicators by blending multiple market dimensions into one rhythmic framework. It adapts to volatility, applies harmonic structure awareness, and filters signals based on real-time market conditions. It offers:
* A unique rhythm-based view of price, volume, and volatility
* Dynamic, adaptive signal generation and zone coloring
* Visual analytics and contextual data in a summary table
* Signal filtering using harmonic alignment and market breath
Its real-time responsiveness and multi-layered logic make it suitable for intraday, swing, and positional traders.
HOW USER CAN BENEFIT FROM IT:
* Spot high-conviction long or short entries when rhythm, volume, and structure align
* Avoid low-quality trades during weak or noisy rhythm periods
* Use visual wave zones to gauge trend strength and rhythm direction
* Monitor harmonic proximity to enter or exit near key structural levels
* Apply rhythm bands for dynamic stop-loss and target setting
* Use rhythm direction arrows and analytics table to gain deeper market insight
DISCLAIMER:
This indicator is created for educational and informational purposes only. It does not constitute financial advice or a recommendation to buy or sell any asset. All trading involves risk, and users should conduct their own analysis or consult with a qualified financial advisor before making any trading decisions. The creator is not responsible for any losses incurred through the use of this tool. Use at your own discretion.
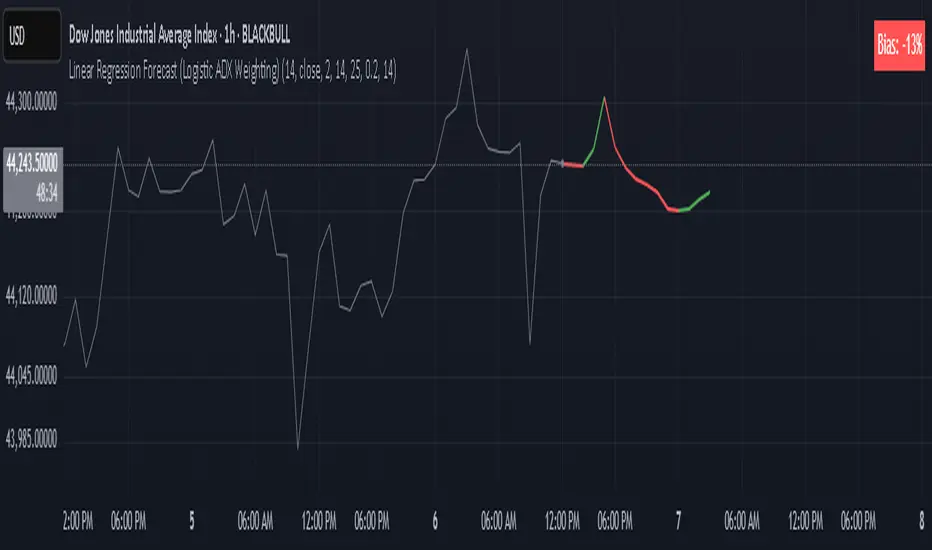
Linear Regression Forecast (ADX Adaptive)Linear Regression Forecast (ADX Adaptive)
This indicator is a dynamic price projection tool that combines multiple linear regression forecasts into a single, adaptive forecast curve. By integrating trend strength via the ADX and directional bias, it aims to visualize how price might evolve in different market environments—from strong trends to mean-reverting conditions.
Core Concept:
This tool builds forward price projections based on a blend of linear regression models with varying lookback lengths (from 2 up to a user-defined max). It then adjusts those projections using two key mechanisms:
ADX-Weighted Forecast Blending
In trending conditions (high ADX), the model follows the raw forecast direction. In ranging markets (low ADX), the forecast flips or reverts, biasing toward mean-reversion. A logistic transformation of directional bias, controlled by a steepness parameter, determines how aggressively this blending reacts to price behavior.
Volatility Scaling
The forecast’s magnitude is scaled based on ADX and directional conviction. When trends are unclear (low ADX or neutral bias), the projection range expands to reflect greater uncertainty and volatility.
How It Works:
Regression Curve Generation
For each regression length from 2 to maxLength, a forward projection is calculated using least-squares linear regression on the selected price source. These forecasts are extrapolated into the future.
Directional Bias Calculation
The forecasted points are analyzed to determine a normalized bias value in the range -1 to +1, where +1 means strongly bullish, -1 means strongly bearish, and 0 means neutral.
Logistic Bias Transformation
The raw bias is passed through a logistic sigmoid function, with a user-defined steepness. This creates a probability-like weight that favors either following or reversing the forecast depending on market context.
ADX-Based Weighting
ADX determines the weighting between trend-following and mean-reversion modes. Below ADX 20, the model favors mean-reversion. Above 25, it favors trend-following. Between 20 and 25, it linearly blends the two.
Blended Forecast Curve
Each forecast point is blended between trend-following and mean-reverting values, scaled for volatility.
What You See:
Forecast Lines: Projected future price paths drawn in green or red depending on direction.
Bias Plot: A separate plot showing post-blend directional bias as a percentage, where +100 is strongly bullish and -100 is strongly bearish.
Neutral Line: A dashed horizontal line at 0 percent bias to indicate neutrality.
User Inputs:
-Max Regression Length
-Price Source
-Line Width
-Bias Steepness
-ADX Length and Smoothing
Use Cases:
Visualize expected price direction under different trend conditions
Adjust trading behavior depending on trending vs ranging markets
Combine with other tools for deeper analysis
Important Notes:
This indicator is for visualization and analysis only. It does not provide buy or sell signals and should not be used in isolation. It makes assumptions based on historical price action and should be interpreted with market context.
MTF Pivot Fib Speed Resistance FansOverview
This Pine Script indicator, titled "MTF Pivot Fib Speed Resistance Fans", is a multi-timeframe tool that automatically plots Fib Speed Resistance Fan lines based on pivot structures derived from higher timeframes. It mirrors the functionality of TradingView’s built-in “Fib Speed Resistance Fan” drawing tool, but in a dynamic, programmatic way. It uses pivot highs and lows to anchor fan projections, drawing forward-facing trend lines that align with well-known Fibonacci ratios and their extensions.
Pivot Detection Logic
The script identifies pivots by comparing the current bar’s high and low against the highest and lowest prices over a user-defined pivot period. This pivot detection occurs on a higher timeframe of your choice, giving a broader and more strategic view of price structure. The script tracks direction changes in the pivot trend and stores only the most recent few pivots to maintain clean and meaningful fan drawings.
Fan Direction Control
The user can select whether to draw fans for "Buys", "Sells", or "Both". The script only draws fan lines when a new directional move is detected based on the pivot structure and the selected bias. For example, in “Buys” mode, a rising pivot followed by another higher low will trigger upward fan projections.
Fib Speed Resistance Levels
Once two pivots are identified, the script draws multiple fan lines from the first pivot outward, at angles defined by a preset list of Fibonacci levels. These fan lines help visualize speed and strength of a price move.
The script also draws a horizontal line from the pivot for additional confluence at the base level (1.0).
Price Level Plotting
In addition to drawing fan lines, the indicator also plots their price levels on the right-hand price scale. This makes it easier for users to visually reference the projected support and resistance levels without needing to trace the lines manually across the chart.
Mapping to TradingView’s "Fib Speed Resistance Fan"
The expanded set of values used in this script is not arbitrary—they closely align with the default and extended levels available in TradingView's built-in "Fib Speed Resistance Fan" tool.
TradingView’s Fib Fan tool offers several levels by default, including traditional Fibonacci ratios like 0.382, 0.5, 0.618, and 1. However, if you right-click the tool and open its settings, you’ll find additional toggles for levels like 1.618, 2.000, 2.618, and even 4.000. These deeper levels are used to project stronger trend continuations beyond the standard retracement zones.
The inclusion of levels such as 0.25, 0.75, and 1.34 reflects configurations that are available when you manually add or customize levels in TradingView’s fan tool. While 1.34 is not a canonical Fibonacci ratio, it is often found in hybrid Gann/Fib methods and is included in some preset templates in TradingView’s drawing tool for advanced users.
By incorporating these levels directly into the Pine Script, the indicator faithfully reproduces the fan structure users would manually draw using TradingView’s graphical Fib Fan tool—but does so programmatically, dynamically, and with multi-timeframe control. This eliminates manual errors, allows for responsive updating, and adds custom visual tracking via the price scale.
These values are standardized within the context of TradingView's Fib Fan tool and not made up. This script automates what the manual drawing tool achieves, with added precision and flexibility.

Golden Crossover Momentum Check📊 Golden Cross Momentum Screener — Summary
🔍 What It Does
This indicator identifies Golden Cross events — where the 50 EMA crosses above the 200 EMA, signaling a potential long-term trend reversal — and evaluates the momentum strength to help determine whether price is likely to:
Surge immediately (Group B), or
Retrace first (Group A)
It uses 5 momentum-confirming conditions to score the quality of the breakout and display a single label on the chart with a classification.
✅ Momentum Conditions Validated
RSI > 60 and rising – Indicates bullish buying pressure
MACD Histogram > 0 and rising – Confirms increasing momentum
Volume > 2× 20-day average – Validates participation on the breakout
ADX > 25 – Measures trend strength
Price is >5% above 200 EMA – Confirms price extension above long-term trend
Each passing condition adds 1 point to the momentum score (0–5).
📈 How to Use
Watch for a Golden Cross signal (triangle appears below candle)
If momentum score ≥ 4, the script labels the setup as:
"🚀 Surge Likely (Group B)" — consider immediate breakout entries
If score is 2–3, labeled:
"🔄 Pullback Likely (Group A)" — expect retest/consolidation before continuation
If score < 2, labeled:
"❌ No Momentum Confirmed" — avoid or wait for confirmation

IU Liquidity Flow TrackerDESCRIPTION
The IU Liquidity Flow Tracker is a powerful market analysis tool designed to visualize hidden buying and selling activity by analyzing price action, volume behavior, market pressure, and depth. It provides a composite view of liquidity dynamics to help traders identify accumulation, distribution, and neutral phases with high clarity.
This indicator is ideal for traders who want to gauge the flow of market participants and make informed entry/exit decisions based on the underlying liquidity structure.
USER INPUTS:
* Flow Analysis Period: Length used for analyzing price spread and volume flow.
* Pressure Sensitivity: Adjusts the sensitivity of threshold detection for flow classification.
* Flow Smoothing: Controls the smoothing applied to raw flow data.
* Market Depth Analysis: Sets the depth range for rejection and wick analysis.
* Colors: Customize colors for accumulation, distribution, neutral zones, and pressure visualization.
INDICATOR LOGIC:
The IU Liquidity Flow Tracker uses a multi-factor model to evaluate market behavior:
1. Liquidity Pressure: Combines price spread, price efficiency, and volume imbalance.
2. Flow Direction: Weighted momentum using short, medium, and long-term price changes adjusted for volume.
3. Market Depth: Wick-based rejection scoring to estimate buying/selling aggressiveness at price extremes.
4. Composite Flow Index: Blended value of flow direction, pressure, and depth—smoothed for clarity.
5. Dynamic Thresholds: Automatically adjusts based on volatility to classify the market into:
* Accumulation: Strong buying signals.
* Distribution: Strong selling signals.
* Neutral: No significant flow dominance.
6. Entry Signals: Long/Short signals are generated when flow state shifts, supported by momentum, volume surge, and depth strength.
WHY IT IS UNIQUE:
Unlike typical indicators that rely solely on price or volume, this tool combines spread behavior, volume polarity, momentum weighting, and price rejection zones into a single visual interface. It dynamically adjusts sensitivity based on market volatility, helping avoid false signals during sideways or low-volume periods.
It is not based on any traditional indicator (RSI, MACD, etc.), making it ideal for traders looking for an original and data-driven market read.
HOW USER CAN BENEFIT FROM IT:
* Understand Market Context: Know whether the market is being accumulated, distributed, or ranging.
* Improve Entries/Exits: Use flow transitions combined with volume confirmation for high-probability setups.
* Spot Institutional Activity: Detect subtle shifts in liquidity that precede major price moves.
* Reduce Whipsaws: Dynamic thresholds and multi-factor confirmation help filter noise.
* Use with Any Style: Whether you're a swing trader, day trader, or scalper, this tool adapts to different timeframes and strategies.
DISCLAIMER:
This indicator is created for educational and informational purposes only. It does not constitute financial advice or a recommendation to buy or sell any asset. All trading involves risk, and users should conduct their own analysis or consult with a qualified financial advisor before making any trading decisions. The creator is not responsible for any losses incurred through the use of this tool. Use at your own discretion.

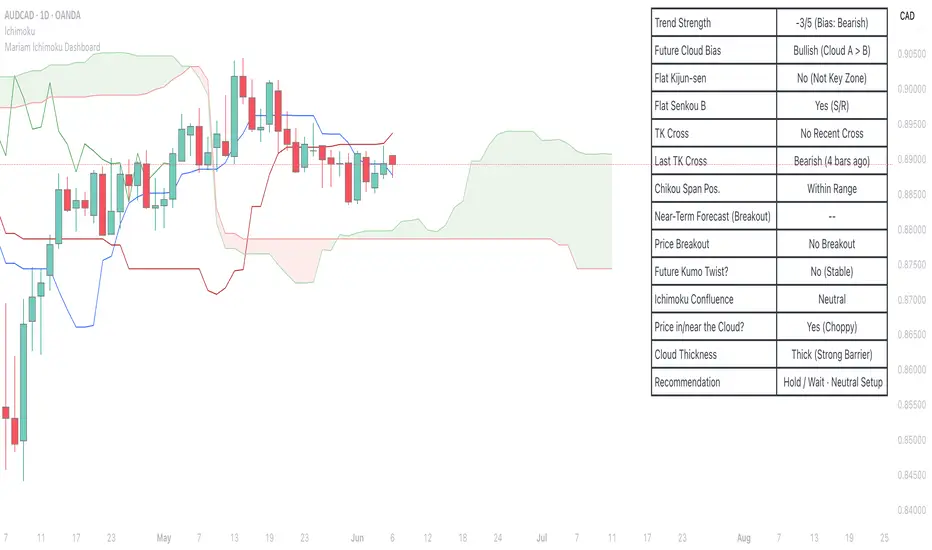
Mariam Ichimoku DashboardPurpose
The Mariam Ichimoku Dashboard is designed to simplify the Ichimoku trading system for both beginners and experienced traders. It provides a complete view of trend direction, strength, momentum, and key signals all in one compact dashboard on your chart. This tool helps traders make faster and more confident decisions without having to interpret every Ichimoku element manually.
How It Works
1. Trend Strength Score
Calculates a score from -5 to +5 based on Ichimoku components.
A high positive score means strong bullish momentum.
A low negative score shows strong bearish conditions.
A near-zero score indicates a sideways or unclear market.
2. Future Cloud Bias
Looks 26 candles ahead to determine if the future cloud is bullish or bearish.
This helps identify the longer-term directional bias of the market.
3. Flat Kijun / Flat Senkou B
Detects flat zones in the Kijun or Senkou B lines.
These flat areas act as strong support or resistance and can attract price.
4. TK Cross
Identifies Tenkan-Kijun crosses:
Bullish Cross means Tenkan crosses above Kijun
Bearish Cross means Tenkan crosses below Kijun
5. Last TK Cross Info
Shows whether the last TK cross was bullish or bearish and how many candles ago it happened.
Helps track trend development and timing.
6. Chikou Span Position
Checks if the Chikou Span is above, below, or inside past price.
Above means bullish momentum
Below means bearish momentum
Inside means mixed or indecisive
7. Near-Term Forecast (Breakout)
Warns when price is near the edge of the cloud, preparing for a potential breakout.
Useful for anticipating price moves.
8. Price Breakout
Shows if price has recently broken above or below the cloud.
This can confirm the start of a new trend.
9. Future Kumo Twist
Detects upcoming twists in the cloud, which often signal potential trend reversals.
10. Ichimoku Confluence
Measures how many key Ichimoku signals are in agreement.
The more signals align, the stronger the trend confirmation.
11. Price in or Near the Cloud
Displays if the price is inside the cloud, which often indicates low clarity or a choppy market.
12. Cloud Thickness
Shows whether the cloud is thin or thick.
Thick clouds provide stronger support or resistance.
Thin clouds may allow easier breakouts.
13. Recommendation
Gives a simple trading suggestion based on all major signals.
Strong Buy, Strong Sell, or Hold.
Helps simplify decision-making at a glance.
Features
All major Ichimoku signals summarized in one panel
Real-time trend strength scoring
Detects flat zones, crosses, cloud twists, and breakouts
Visual alerts for trend alignment and signal confluence
Compact, clean design
Built with simplicity in mind for beginner traders
Tips
Best used on 15-minute to 1-hour charts for short-term trading
Avoid entering trades when price is inside the cloud because the market is often indecisive
Wait for alignment between trend score, TK cross, cloud bias, and confluence
Use the dashboard to support your trading strategy, not replace it
Enable alerts for major confluence or upcoming Kumo twists