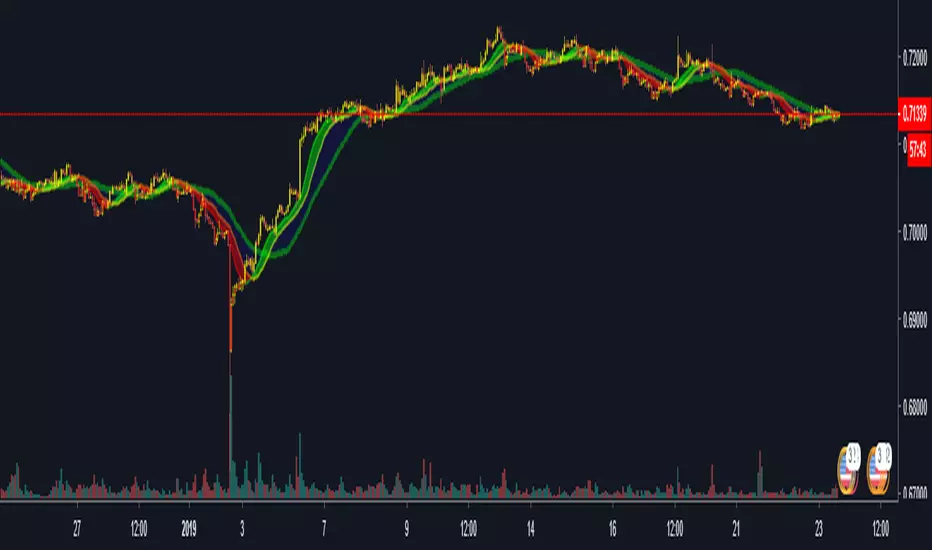
PpSignal RSI Kaufman SMOOTHING Moving AverageSuper smoother Rsi Kaufman (ama) adaptive moving average.
Forex
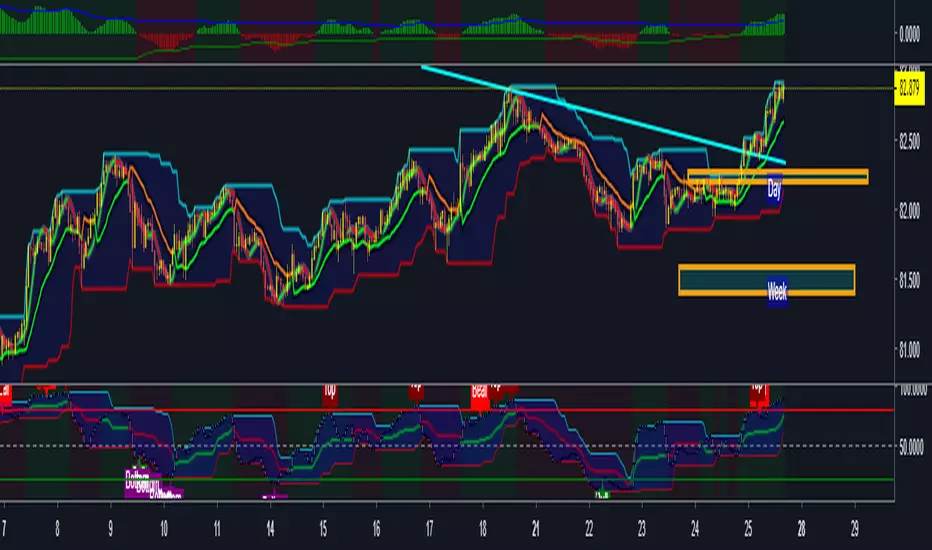
PpSignal RSI Donchian Channels (Dynamic Zone Leo Zamansky)Rsi Donchian channel stoch based in teory of Dynamic Zone Leo Zamanky
PpSignal RSI MACD Adaptive Trima MA Just a simple MACD (Moving Aveage Convergence Divergence) indicator made of RSI, calc with TRIMA Moving Average, but this time with adaptive period for the moving averages.
As usual, you can play with settings to find your best parameters to your own trading style.
Converted from a MQL4 version to prorealtime, by a request in the Spanish forum.


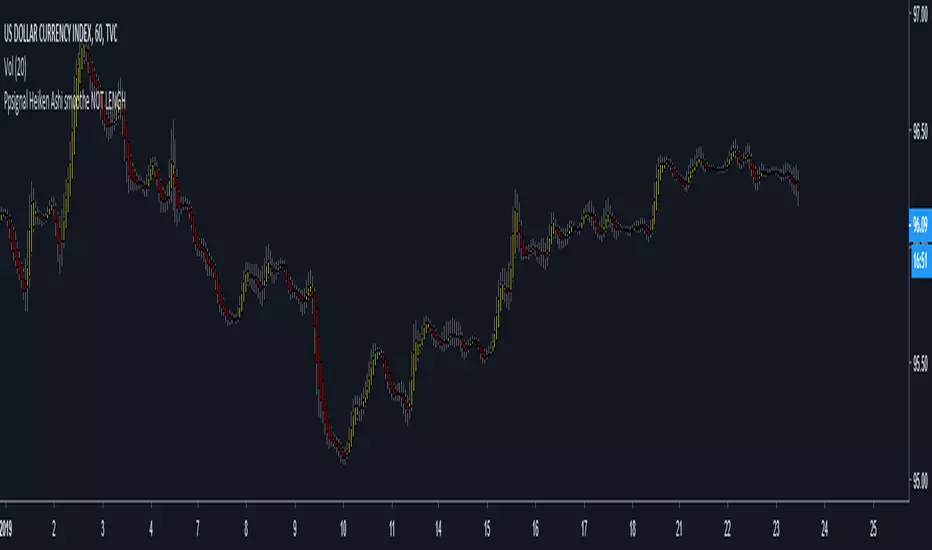
Ppsignal Heiken Ashi Candles Smoothe NOT LENGHHeiken ashi candles smoothed have no tongue shown the actual price smooth
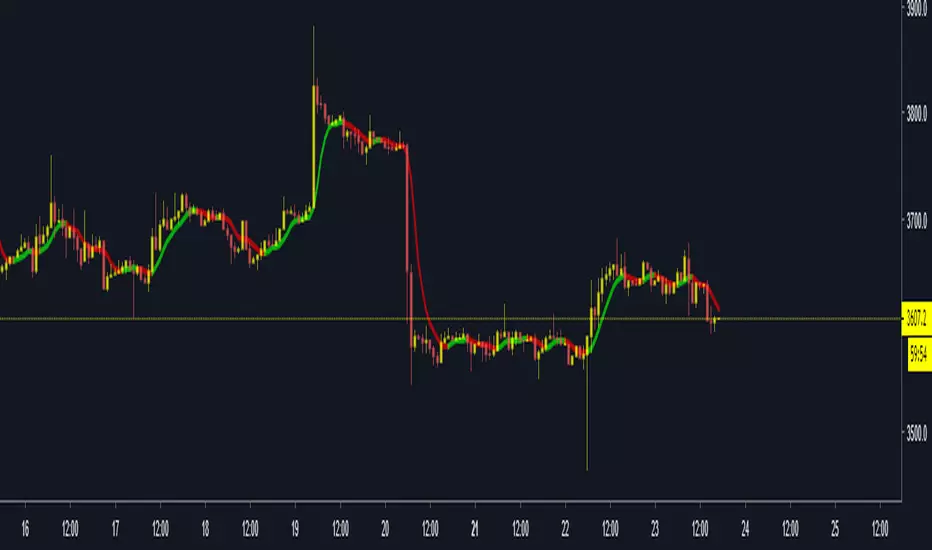
Oscillator Based Scalping (Forex Majors)This is a scalping strategy based on oscillator divergences.
Tested on ForexICE market data.
Signal might appear and disappear during candle making since it is based on Moving Average and therefore acts on close, but since candle closed signal is final and does not repaint.
1M timeframes is recommended for bot trading. 5M-15M is more suitable for manual trading.
Full list of tested intraday timeframes below:
EUR-USD - 1M-5M-15M
USD-JPY - 1M-5M
GBP-USD - 1M
AUD-USD - 1M-5M-15M
USD-CHF - 1M-15M
NZD-USD - 1M-5M-15M
USD-CAD - 1M-5M
There is 2 more similar trading strategies that im finishing now, 1 for BITMEX ETHUSD and XBTUSD contracts, and 1 for bitmex alts. Should be ready in a day or two.
Additional notes on executing trades:
-Trade should be entered as close to sell signal as possible. You can enter at market at red circle candle or at limit at top of sell signal candle. In both cases your target is red Moving Average and entering at market just makes overall R/R for a trade is lower yet limit order might not always get filled.
-This strategy doesnt have a defined stop loss by itself, but your target is a moving average and 1-1 risk reward should be enough. Although the win rate is much higher than 50% so you can be less greedy if you feel like playing it safer.
-Strategy itself uses pyramiding, so i would recommend averaging up if you get 2-3 consecutive sell signals above moving average.
-It is assumed that you have OANDA spread rates or better.
-- Free trial for 24 hours. Contact me here or at twitter.com --

PpSignal Haiken Hashi and Alma Super Smoother John Ehlers Buy or sell when alma and Haiken Ashi Change a Color.
PpSignal Price Channel ZonesAdded parameters for source of highest and lowest line. It's usefull for ultra volatile markets like cryptocurrencies, forex, futures and penny stocks. Using close price as source helps to filter out false breakout signals in turtle trading strategy.
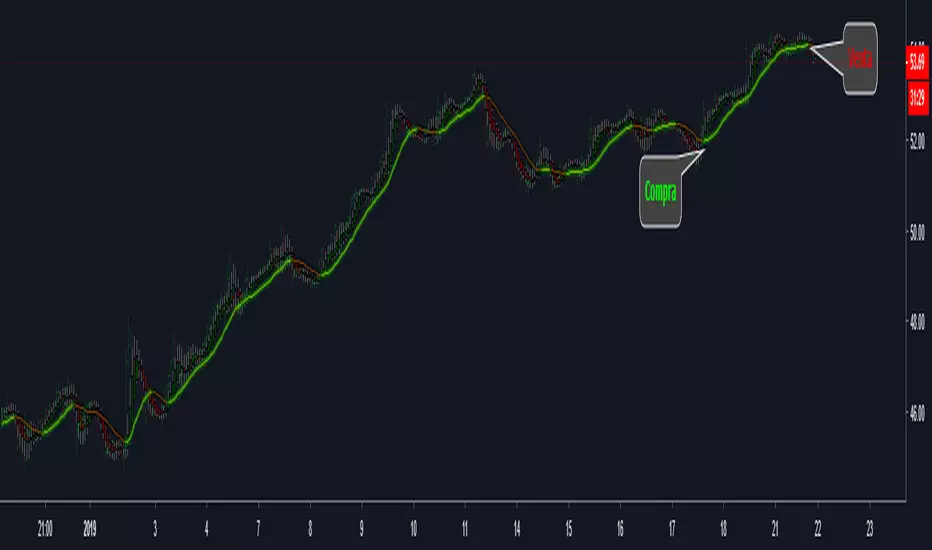
look the arrow...green buy and red sell

Ppsignal JURIK CrossoverIdeally, you would like a filtered signal to be both smooth and lag-free. Lag causes delays in your trades, and increasing lag in your indicators typically result in lower profits. In other words, late comers get what's left on the table after the feast has already begun.
That's why investors, banks and institutions worldwide ask for the Jurik Research Moving Average (JMA). You may apply it just as you would any other popular moving average. However, JMA's improved timing and smoothness will astound you.


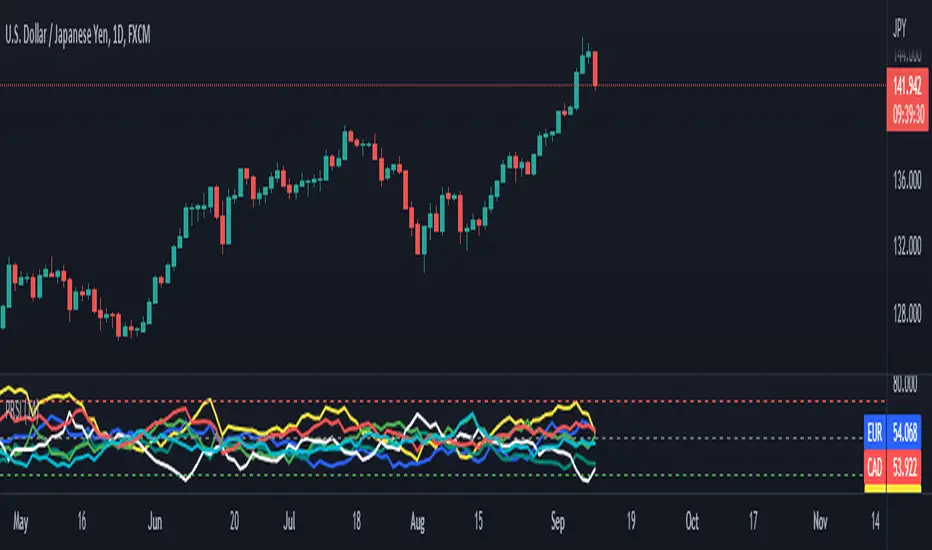
pooya AVG RSIThis is an RSI range for the most popular index in FOREX:
EUR
USD
GBP
JPY
AUD
CAD
CHF
NZD
comment your opinion
[New series!] [Consistent Losing Strategies] 34 EMA Scalping//---------------------------INTRO------------------------------
Hi All!
Let me introduce myself as a semi-successful forex trader & lover of automation.
I've taken to algo trading and have been hunting down strategies (that usually use indicators) to automate, backtest, and hopefully implement in MT4.
Unfortunately, most strategies are complete bulls*** and the select cases that are shown to "prove" success are limited.
These strategy sources often do not provide useful analytics either.
I want to change that approach to trading! We can really benefit each other and the community by being methodical about backtesting
as well as evaluating our results with some kind of scoring heuristic.
As for what that standardized process looks like..well I'm still working on it.
I'm pretty much on Tv for multiple hours of the day, screening strategies via Pinescript and I'd like to start sharing my progress!
This is a new series I'd like to start on consistently losing strategies. I'll make all the code public, so if you think I've made a blunder
or approached a problem the wrong way, then drop me a DM or paste your fix into the comments.
//---------------------------STRAT------------------------------
34 EMA Scalping strategy (ref. forextradingstrategies4u )
How you're supposed to trade it:
BUY:
1. Market is in an down trend as shown by the 34 EMA
2. Price breaks above a downwards trend line
3. Price breaks above the 34 EMA
4. Look for a very bullish candlestick or chart pattern
SELL:
1. Look for the 34 EMA to show we are in an uptrend
2. Price breaks below an upwards sloping trend line
3. Price breaks below 34 EMA
4. Look for a bearish candlestick or a chart pattern
//---------------------------CONC------------------------------
Q: Why does it fail?
A: I believe this strategy relies too much on subjective input (aka, trendlines).
Q: Why does it fail as an algo?
A: The 34 EMA is no more predictive than any other EMA, although it does a good job at filtering out noise.
Q: Should I try it out?
A: No, it's trash. This is the proof that it is trash.

Prometheus Scalping vs. Swinging by ZekisIt's been a while since i did not post a script, so here it is...
I found some simple indicators,put them together and saw some nice results.
There is an indicator for scalping, swinging and for exit.
With the right setup it can be very useful, so you can play with it to find what you need
It works in any timeframe in any market, just change values (default ones are good for 1H or more), all you need is volatility... (this is what you need in any market!)
Also you can enable or disable background and bar colors
Enjoy!
@Zekis

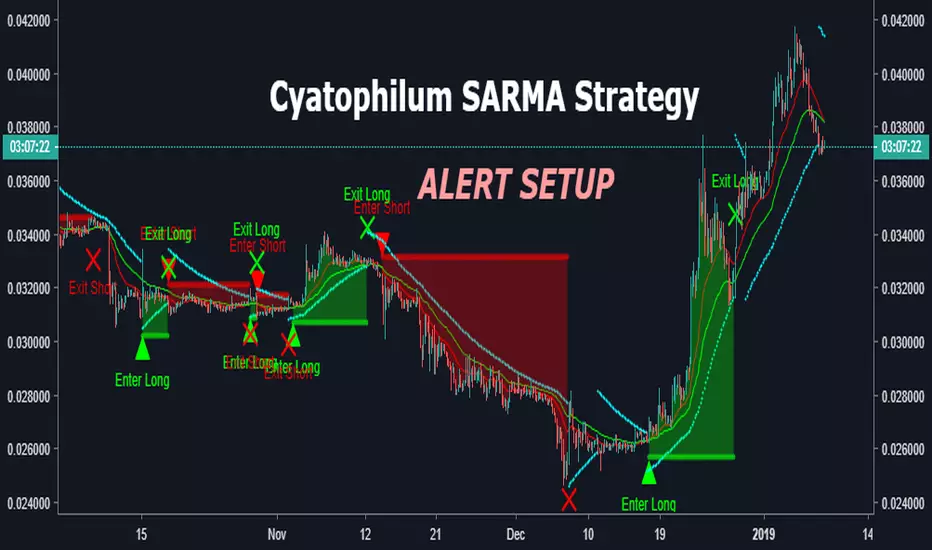
Cyatophilum SAR-MA Strategy [ALERT SETUP]An Automated Strategy based on Parabolic SAR and EMAs, also called the SARMA Strategy. Works on any timeframe and market.
Read More
This indicator will trigger long/short signals entries and exits. Excellent for manual or bot trading!
It has a stop loss system that you can activate to reduce risk.
Note: If a stop loss is reached, an exit alert is triggered.
This is the Alert Setup version. That means it is used to create automatic email or SMS alerts.
It has a Backtest version that you can use to find the best configuration. I will also be there to help you on my Discord channel .
Sample Use cases
Get the indicator today!
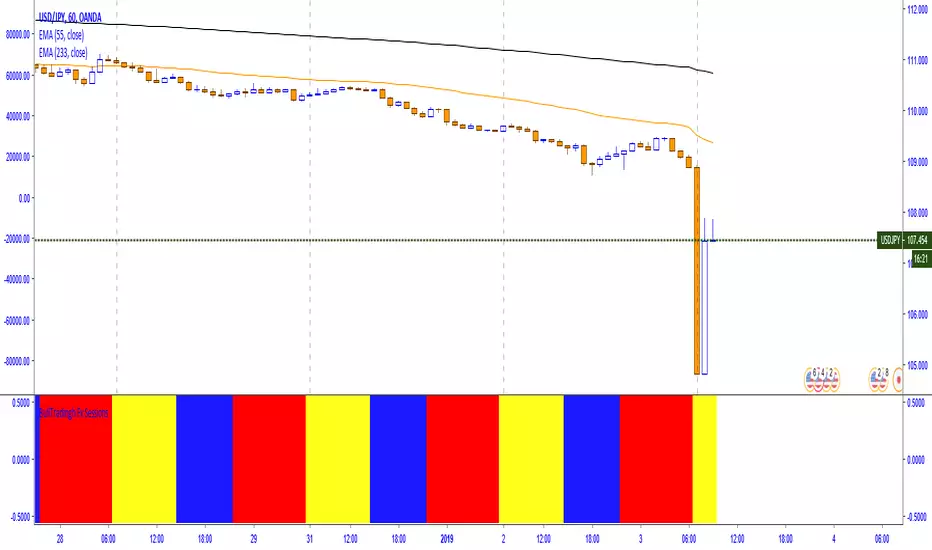
FX Scalping Indicators (Revised)This is an edit from: 1 minute 'Forex Scalping Strategy'
Added realistic Stop/Loss + Take Profit
Now works fluently with 1-15 Minute charts.
Adjusted EMA lengths
Tested on other majors and provides the same if not better results. (:
I'll be using this upon open and will update with live results.

SecretSauceForLife X1SecretSauceForLife X1 Is Finally here!
Finally after so much trial and error we have it! Our 3% DD indicator.
This indicator gives 'long' 'short' 'close short' and 'close long' calls, we made this indicator based of the original GODMODE indicator credits to the original author for that!
It was pretty complicated to understand the calls that the indicator gave so we made it easy for you guys. THIS IS STILL AN INDICATOR so not a get rich quick method.
This indicator works best on USD forex pairs, and on BTC, ETH and XRP. It is optimized for scalps and daytrades.
If you don't manage your risk well your account will still be blown.
BUT if you use this indicator next to your own knowledge about charts you should see a significant increase in profitable trades. If there are enough people interested we will make a Chat group where we will add all the people that get this indicator and keep updating you guys on the newest updates and share our own trades taken with this indicator.
We are not advertising this indicator as an flawless signal provider, it does have losing trades but at the end its always in a net profit. We made this to add value to your trading experience so if you think that this is something you want to use send me a PM and we will see if you are committed enough. FYI this is NOT a FREE indicator, but ask yourself this: is it a matter of money or a matter of value? if you need to invest a couple hundred or even a couple thousands
into something that will help you for the rest of your tradinglife does it even matter to pay that price?
So again, we want to help people that take trading seriously and KNOW that trading isn't a get rich quick scheme (if you do it the right way :)). If you can relate to that and you are interested in investing in yourself don't hesitate to shoot me a PM!
Have a nice start of 2019 and don't forget that you are the only one that can make a change to your life, so get up and start today!
***EDIT****
The indicator summary is based of a certain timeframe. Wider and more accurate info PM!

Colored Volume Bars All Markets: Combining Volume SourcesUsing volume in Forex is potentially misleading as we are only provided the broker volume or futures exchange volume for the currency or commodity in a decentralised market. This code combines the volumes from FXCM, Onanda and futures for the instrument being studied. The combination of the volumes could improve the reliability of the volume being considered. Using this approach other volume indicators can also be improved.
