Pivot Point Zones [JOAT]Pivot Point Zones — Multi-Formula Pivot Levels with ATR Zones
Pivot Point Zones calculates and displays traditional pivot points with five formula options, enhanced with ATR-based zones around each level. This creates more practical trading zones that account for price noise around key levels—because price rarely reacts at exact mathematical levels.
What Makes This Indicator Unique
Unlike basic pivot point indicators, Pivot Point Zones:
Offers five different pivot calculation formulas in one indicator
Creates ATR-based zones around each level for realistic reaction areas
Pulls data from higher timeframes automatically
Displays clean labels with exact price values
Provides a comprehensive dashboard with all levels
What This Indicator Does
Calculates pivot points using Standard, Fibonacci, Camarilla, Woodie, and more formulas
Draws horizontal lines at Pivot, R1-R3, and S1-S3 levels
Creates ATR-based zones around each level for realistic price reaction areas
Displays labels with exact price values
Updates automatically based on higher timeframe closes
Provides fills between zone boundaries for visual clarity
Pivot Formulas Explained
// Standard Pivot - Classic (H+L+C)/3 calculation
pp := (pivotHigh + pivotLow + pivotClose) / 3
r1 := 2 * pp - pivotLow
s1 := 2 * pp - pivotHigh
r2 := pp + pivotRange
s2 := pp - pivotRange
// Fibonacci Pivot - Uses Fib ratios for level spacing
r1 := pp + 0.382 * pivotRange
r2 := pp + 0.618 * pivotRange
r3 := pp + 1.0 * pivotRange
// Camarilla Pivot - Tighter levels for intraday
r1 := pivotClose + pivotRange * 1.1 / 12
r2 := pivotClose + pivotRange * 1.1 / 6
r3 := pivotClose + pivotRange * 1.1 / 4
// Woodie Pivot - Weights current close more heavily
pp := (pivotHigh + pivotLow + 2 * close) / 4
// TD Pivot - Conditional based on open/close relationship
x = pivotClose < pivotOpen ? pivotHigh + 2*pivotLow + pivotClose :
pivotClose > pivotOpen ? 2*pivotHigh + pivotLow + pivotClose :
pivotHigh + pivotLow + 2*pivotClose
pp := x / 4
Formula Characteristics
Standard — Classic pivot calculation. Balanced levels, good for swing trading.
Fibonacci — Uses 0.382, 0.618, and 1.0 ratios. Popular with Fibonacci traders.
Camarilla — Tighter levels derived from range. Excellent for intraday mean-reversion.
Woodie — Weights current close more heavily. More responsive to recent price action.
TD — Conditional calculation based on open/close relationship. Adapts to bar type.
Zone System
Each pivot level includes an ATR-based zone that provides a more realistic area for potential price reactions:
// ATR-based zone width calculation
float atr = ta.atr(atrLength)
float zoneHalf = atr * zoneWidth / 2
// Zone boundaries around each level
zoneUpper = level + zoneHalf
zoneLower = level - zoneHalf
This accounts for market noise and helps avoid false breakout signals at exact level prices.
Visual Features
Pivot Lines — Horizontal lines at each calculated level
Zone Fills — Transparent fills between zone boundaries
Level Labels — Labels showing level name and exact price (e.g., "PP 45123.50")
Color Coding :
- Yellow: Pivot Point (PP)
- Red gradient: Resistance levels (R1, R2, R3) - darker = further from PP
- Green gradient: Support levels (S1, S2, S3) - darker = further from PP
Color Scheme
Pivot Color — Default: #FFEB3B (yellow) — Central pivot point
Resistance Color — Default: #FF5252 (red) — R1, R2, R3 levels
Support Color — Default: #4CAF50 (green) — S1, S2, S3 levels
Zone Transparency — 85-90% transparent fills around levels
Dashboard Information
The on-chart table (bottom-right corner) displays:
Selected pivot type (Standard, Fibonacci, etc.)
R3, R2, R1 resistance levels with exact prices
PP (Pivot Point) highlighted
S1, S2, S3 support levels with exact prices
Inputs Overview
Pivot Settings:
Pivot Type — Formula selection (Standard, Fibonacci, Camarilla, Woodie, TD)
Pivot Timeframe — Higher timeframe for OHLC data (default: D = Daily)
ATR Length — Period for zone width calculation (default: 14)
Zone Width — ATR multiplier for zone size (default: 0.5)
Level Display:
Show Pivot (P) — Toggle central pivot line
Show R1/S1 — Toggle first resistance/support levels
Show R2/S2 — Toggle second resistance/support levels
Show R3/S3 — Toggle third resistance/support levels
Show Zones — Toggle ATR-based zone fills
Show Labels — Toggle price labels at each level
Visual Settings:
Pivot/Resistance/Support Colors — Customizable color scheme
Line Width — Thickness of level lines (default: 2)
Extend Lines Right — Project lines forward on chart
Show Dashboard — Toggle the information table
How to Use It
For Intraday Trading:
Use Daily pivots on intraday charts (15m, 1H)
Pivot point often acts as the day's "fair value" reference
Camarilla levels work well for intraday mean-reversion
R1/S1 are the most commonly tested levels
For Swing Trading:
Use Weekly pivots on daily charts
Standard or Fibonacci formulas work well
R2/S2 and R3/S3 become more relevant
Zone boundaries provide realistic entry/exit areas
For Support/Resistance:
R levels above price act as resistance targets
S levels below price act as support targets
Zone boundaries are more realistic than exact lines
Multiple formula confluence adds significance
Alerts Available
DPZ Cross Above Pivot — Price crosses above central pivot
DPZ Cross Below Pivot — Price crosses below central pivot
DPZ Cross Above R1/R2 — Price breaks resistance levels
DPZ Cross Below S1/S2 — Price breaks support levels
Best Practices
Match pivot timeframe to your trading style (Daily for intraday, Weekly for swing)
Use zones instead of exact levels for more realistic expectations
Camarilla is best for mean-reversion; Standard/Fibonacci for breakouts
Combine with other indicators for confirmation
— Made with passion by officialjackofalltrades
Futures

Futures Ultra CVD (Pure )Futures Ultra CVD (Pure)
Futures Ultra CVD (Pure) is a volume-driven Cumulative Volume Delta (CVD) indicator designed to expose real buying and selling pressure behind price movement. Unlike price-only indicators, this script analyzes how volume is distributed within each bar to determine whether aggressive buyers or sellers are in control, then tracks how that pressure evolves over time.
This version is intentionally pure and ungated: it does not rely on external symbols, market filters, session bias, or macro confirmation. All signals are derived strictly from price, volume, and delta behavior of the active chart, making it suitable for futures, equities, crypto, and FX.
Core Concept: How CVD Is Calculated
For each bar, volume is split into buying pressure and selling pressure using the bar’s price position:
Buying volume increases as price closes closer to the high
Selling volume increases as price closes closer to the low
The difference between buying and selling volume forms Delta:
Positive delta = net aggressive buying
Negative delta = net aggressive selling
This delta is then accumulated into Cumulative Volume Delta (CVD) using one of three user-selectable modes:
Total – running cumulative sum of all delta values
Periodic – rolling sum over a fixed lookback period
EMA – smoothed cumulative delta using an exponential average
This flexibility allows traders to choose between raw order-flow tracking or smoother, trend-like behavior depending on timeframe and instrument.
Visual Structure & Histogram Logic
The CVD is displayed as a column histogram, not a line, to emphasize momentum and pressure shifts.
Enhanced coloring provides additional context:
Brighter green/red bars indicate increasing momentum
Muted colors indicate stalling or weakening pressure
Optional footprint-style highlights appear when buy or sell volume overwhelms the opposite side by a user-defined imbalance factor
This allows traders to visually distinguish:
Strength vs weakness
Continuation vs exhaustion
Absorption and aggressive participation
Built-In Order Flow Signals
The script automatically detects and labels key order-flow events:
Strong Delta
Triggered when delta exceeds a user-defined threshold, highlighting unusually aggressive buying or selling.
Delta Surge
Detects sudden expansion in delta compared to the prior bar, often associated with breakout attempts or liquidation events.
Zero-Line Crosses
Marks transitions between net bullish and bearish participation as CVD crosses above or below zero.
CVD Continuation Logic (Trend Confirmation)
Beyond raw delta, the script evaluates CVD structure to identify continuation conditions:
A bullish continuation requires:
Positive and rising CVD
Strong buy delta
Confirmation from at least one of the following:
CVD above its EMA and SMA
Bullish price expansion
Sustained positive delta pressure
Bearish continuation follows the inverse logic.
These continuation signals are designed to confirm participation strength, not predict reversals.
Conflict Detection (Divergence Warning)
The indicator also flags conflict conditions, where:
Strong buying occurs while CVD remains negative
Strong selling occurs while CVD remains positive
These scenarios often precede failed breakouts, absorption zones, or short-term reversals and can be used as cautionary signals.
Alerts & Practical Use
All major events include built-in alerts:
Strong delta
Delta surge
CVD continuations
Zero-line crosses
Buy/sell imbalances
Conflict signals
Alerts can be set to trigger on bar close or intrabar in real time, depending on trader preference.
How Traders Typically Use This Indicator
Confirm breakouts with delta participation
Validate trends using CVD continuation instead of price alone
Identify absorption or exhaustion via conflicts and imbalances
Combine with price structure, VWAP, or market profile tools
This script is not a trading system by itself. It is a decision-support tool designed to reveal what price alone cannot: who is actually in control of the market.
On-Chart Symbols & What They Mean
This script uses a small number of visual symbols to communicate order-flow events clearly and consistently. All symbols are derived directly from the Cumulative Volume Delta calculations described above.
Δ+ (Green Up Arrow)
Strong Buy Delta
Indicates that buying pressure on the current bar exceeded the Strong Delta Threshold
Represents aggressive market buying dominating selling volume
Often appears during breakouts, trend acceleration, or initiative buying
This symbol does not imply direction by itself; it only confirms strong buyer participation.
Δ− (Red Down Arrow)
Strong Sell Delta
Indicates that selling pressure on the current bar exceeded the Strong Delta Threshold
Represents aggressive market selling dominating buying volume
Often appears during breakdowns, liquidation events, or initiative selling
Like Δ+, this symbol measures participation strength, not trade direction.
↑ (Green Label Up)
CVD Bullish Continuation
Appears when all of the following are present:
CVD is positive and increasing
Strong buy delta is detected
At least one confirmation condition is met:
CVD is above its EMA and SMA
Price shows bullish expansion
Consecutive positive delta bars (sustained buying pressure)
This symbol highlights trend continuation supported by volume, not a reversal signal.
↓ (Red Label Down)
CVD Bearish Continuation
Appears when:
CVD is negative and decreasing
Strong sell delta is detected
At least one confirmation condition is met:
CVD is below its EMA and SMA
Price shows bearish expansion
Consecutive negative delta bars (sustained selling pressure)
This indicates bearish continuation with participation confirmation.
Cyan / Orange Histogram Bars
Footprint-Style Volume Imbalance
Cyan bars indicate buy volume exceeds sell volume by the imbalance factor
Orange bars indicate sell volume exceeds buy volume by the imbalance factor
These bars highlight areas where one side is overwhelming the other, often associated with absorption, initiative moves, or failed auctions.
Bright vs Muted Histogram Colors
CVD Momentum State
Bright colors = CVD increasing in the direction of its current bias
Muted colors = CVD losing momentum or stalling
This allows quick visual identification of strengthening vs weakening participation.
Conflict Alerts (No Symbol by Default)
Delta vs CVD Disagreement
These conditions trigger alerts (but no fixed chart icon):
Strong buying while CVD remains negative
Strong selling while CVD remains positive
Conflicts often signal absorption, trap conditions, or short-term exhaustion.
Important Usage Notes
All symbols are informational, not trade entries.
Signals are calculated from price-based volume distribution, not true bid/ask data.
Results depend on the quality of volume data provided by the exchange and TradingView.

Trend Strength Matrix [JOAT]
Trend Strength Matrix — Multi-Timeframe Trend Health Dashboard
Trend Strength Matrix provides a comprehensive view of trend health across multiple timeframes and indicators. It combines RSI, MACD, ADX, and moving average alignment into a single heatmap-style dashboard with an overall strength score—giving you a complete picture of trend quality at a glance.
What Makes This Indicator Unique
Unlike single-indicator trend tools, Trend Strength Matrix:
Analyzes four different indicators simultaneously (RSI, MACD, ADX, MA)
Evaluates up to four timeframes at once for multi-timeframe confluence
Presents everything in an intuitive color-coded heatmap
Calculates a weighted composite score for overall trend assessment
Marks trend shifts directly on the chart
What This Indicator Does
Calculates trend scores from four different indicators
Analyzes up to four timeframes simultaneously
Creates a color-coded heatmap showing strength across all components
Generates a weighted composite score for overall trend assessment
Marks bullish and bearish trend shifts on the chart
Displays a trend-following moving average on the price chart
Component Scores Explained
Each indicator contributes a normalized score from -1 (strongly bearish) to +1 (strongly bullish):
RSI Score — (RSI - 50) / 50
- RSI of 70 = +0.4 (bullish)
- RSI of 30 = -0.4 (bearish)
- RSI of 50 = 0 (neutral)
MACD Score — MACD line normalized by its standard deviation
- Positive MACD = positive score
- Negative MACD = negative score
- Magnitude reflects strength
ADX Score — ADX strength multiplied by DI direction
- High ADX with DI+ > DI- = strong positive
- High ADX with DI- > DI+ = strong negative
- Low ADX = weak score regardless of direction
MA Score — Price position relative to moving average
- Price above MA = positive
- Price below MA = negative
- Distance from MA affects magnitude
Multi-Timeframe Analysis
The indicator analyzes multiple timeframes with weighted importance:
// Weighted MTF composite score
mtfScore = composite1 * 0.40 + // Current TF (40% weight)
composite2 * 0.25 + // TF2, e.g., 1H (25% weight)
composite3 * 0.20 + // TF3, e.g., 4H (20% weight)
composite4 * 0.15 // TF4, e.g., Daily (15% weight)
Higher timeframes provide context and trend direction, while lower timeframes provide timing and entry signals.
Dashboard Layout
The matrix displays a grid with:
Rows — Each timeframe (current, TF2, TF3, TF4)
Columns — Each indicator (RSI, MACD, ADX, MA, Score)
Cell Colors :
- Bright green: Score > 0.5 (strongly bullish)
- Faded green: Score 0.2 to 0.5 (moderately bullish)
- Gray: Score -0.2 to 0.2 (neutral)
- Faded red: Score -0.5 to -0.2 (moderately bearish)
- Bright red: Score < -0.5 (strongly bearish)
Overall Row — Shows weighted composite with trend classification
Trend Classifications
Based on the overall MTF score:
STRONG BULL — Score > 50%
BULLISH — Score 20% to 50%
NEUTRAL — Score -20% to 20%
BEARISH — Score -50% to -20%
STRONG BEAR — Score < -50%
Visual Features
Trend Moving Average — Optional MA line on price chart colored by trend direction
Trend Background — Subtle background tint showing overall trend direction
Trend Shift Labels — "BULL" and "BEAR" labels when trend direction changes
Heatmap Dashboard — Color-coded matrix showing all components and timeframes
Color Scheme
Bullish Color — Default: #00E676 (bright green)
Bearish Color — Default: #FF5252 (red)
Neutral Color — Default: #9E9E9E (gray)
Dashboard Header — #2962FF (blue)
Inputs Overview
Calculation Settings:
RSI Length — Period for RSI (default: 14, range: 5-30)
MACD Fast — Fast EMA period (default: 12, range: 5-30)
MACD Slow — Slow EMA period (default: 26, range: 10-50)
MACD Signal — Signal line period (default: 9, range: 3-20)
ADX Length — Period for ADX/DI (default: 14, range: 5-30)
MA Length — Period for trend MA (default: 50, range: 20-200)
Multi-Timeframe:
Enable Multi-Timeframe — Toggle MTF analysis (default: on)
Timeframe 2 — Second timeframe (default: 60 = 1 hour)
Timeframe 3 — Third timeframe (default: 240 = 4 hours)
Timeframe 4 — Fourth timeframe (default: D = Daily)
Visual Settings:
Bullish/Bearish/Neutral Colors — Customizable color scheme
Show Trend MA — Toggle moving average on price chart
Show Dashboard — Toggle the heatmap matrix
Dashboard Position — Choose corner placement (Top Right, Top Left, Bottom Right, Bottom Left)
How to Use It
For Trend Confirmation:
All green cells = strong bullish alignment across indicators and timeframes
All red cells = strong bearish alignment
Mixed colors = consolidation or transition period
Wait for alignment before entering trend trades
For Multi-Timeframe Analysis:
Higher timeframes (TF3, TF4) show the "big picture" trend
Lower timeframes (current, TF2) show immediate momentum
Best signals occur when all timeframes align
Divergence between timeframes suggests caution
For Entry Timing:
Enter when trend shifts from neutral to bullish/bearish
Look for "BULL" or "BEAR" labels on chart
Confirm with dashboard showing alignment
Use the trend MA as a trailing stop reference
Alerts Available
TSM Bullish Shift — Trend shifted from neutral/bearish to bullish
TSM Bearish Shift — Trend shifted from neutral/bullish to bearish
TSM Strong Bull — Score crossed above 50% (strong bullish)
TSM Strong Bear — Score crossed below -50% (strong bearish)
Best Practices
Wait for multiple timeframes to align before entering
Strong trends show green (or red) across all cells
Mixed colors suggest waiting for clarity
Use the overall score percentage to gauge conviction
— Made with passion by officialjackofalltrades

Pinnacle ICT Basic (PICT Basic) v1.22.4 (LOCKED)Pinnacle ICT Basic highlights market regime (stand down vs trending), HTF alignment, and two structure-only setup types (Sweep reversal and Continuation first-touch). It then issues binary “Confirm” signals when displacement + volume + HTF + micro alignment are present. This is an educational structure tool—no entries/exits, targets/stops, or trade advice.

Volume Profile Lite [JOAT]
Volume Profile Lite — Simplified Volume-at-Price Analysis
Volume Profile Lite creates a histogram showing volume distribution across price levels using a proprietary lightweight calculation method. It identifies the Point of Control (POC), Value Area High, and Value Area Low—key concepts from auction market theory—in an optimized, easy-to-read format that won't slow down your charts.
Why This Script is Protected
This script is published as closed-source to protect the proprietary volume distribution algorithm and the optimized Value Area calculation methodology from unauthorized republishing. The specific implementation of volume allocation across price rows, the buy/sell volume separation logic, and the efficient POC detection system represents original work that provides a unique lightweight alternative to standard volume profile implementations.
What Makes This Indicator Unique
Unlike heavy volume profile indicators that can slow down charts, Volume Profile Lite:
Uses an optimized algorithm designed for performance
Separates buying and selling volume for additional insight
Provides clean visual presentation without chart clutter
Includes extending reference lines for key levels
Features a dashboard with price position relative to POC
What This Indicator Does
Distributes volume across price rows to create a visual profile histogram
Identifies the Point of Control (highest volume price level)
Calculates Value Area (where specified percentage of volume traded)
Separates buying and selling volume for each price level
Extends key levels as reference lines on the chart
Highlights the POC row with a distinct border
Core Methodology
The indicator uses a proprietary approach to volume-at-price analysis:
Price Row Division — The lookback range is divided into configurable price rows (default: 24 rows)
Volume Distribution — Each bar's volume is allocated to the price rows it touches. If a bar spans multiple rows, volume is distributed proportionally.
Buy/Sell Separation — Volume is classified based on bar direction (close >= open = buying volume, close < open = selling volume)
POC Detection — The row with maximum accumulated volume is identified as the Point of Control
Value Area Calculation — Starting from POC, expands outward (alternating up and down) until target volume percentage is captured
Key Concepts Explained
Point of Control (POC) — The price level with the highest volume concentration. Often acts as a magnet for price and represents "fair value" for the analyzed period. Price tends to return to POC.
Value Area High (VAH) — Upper boundary of the value area zone. Acts as resistance when price is below, support when price is above.
Value Area Low (VAL) — Lower boundary of the value area zone. Acts as support when price is above, resistance when price is below.
Value Area — Price range containing specified percentage (default 70%) of total volume. This is where most trading activity occurred.
Visual Features
Volume Histogram — Horizontal bars showing volume at each price level
Buy/Sell Coloring — Green portions show buying volume, red shows selling volume
POC Highlight — The POC row has a distinct orange border and fill
POC Line — Horizontal line extending from POC (optional extension to right)
Value Area Lines — Dashed blue lines at VAH and VAL
Value Area Fill — Subtle blue fill between VAH and VAL
Color Scheme
Up Volume Color — Default: #26A69A (teal) — Buying volume
Down Volume Color — Default: #EF5350 (red) — Selling volume
POC Color — Default: #FF9800 (orange) — Point of Control
Value Area Color — Default: #2196F3 (blue) — VAH/VAL lines and fill
Dashboard Information
The on-chart table (bottom-right corner) displays:
POC price level
Value Area High price level
Value Area Low price level
Current price position relative to POC (ABOVE POC, BELOW POC, or AT POC)
Distance from current price to POC as percentage
Inputs Overview
Calculation Settings:
Lookback Period — Number of bars to analyze (default: 100, range: 20-500)
Number of Rows — Price level divisions for the profile (default: 24, range: 10-50)
Value Area % — Percentage of volume for value area calculation (default: 70%, range: 50-90%)
Visual Settings:
Up/Down Volume Colors — Customizable buy/sell colors
POC Color — Point of Control highlighting
Value Area Color — VAH/VAL line and fill color
Profile Width — Visual width of histogram in bars (default: 30, range: 10-100)
Show POC Line — Toggle POC horizontal line
Show Value Area — Toggle VAH/VAL lines and fill
Show Dashboard — Toggle the information table
Extend Lines — Project POC and VA lines further right
How to Use It
For Support/Resistance:
Use POC as a potential support/resistance reference point
Price often gravitates back to POC (mean reversion)
VAH acts as resistance when approaching from below
VAL acts as support when approaching from above
For Trend Analysis:
Price above POC suggests bullish control
Price below POC suggests bearish control
Breaking out of Value Area often leads to trending moves
Returning to Value Area suggests failed breakout
For Entry/Exit:
Enter longs near VAL with stops below
Enter shorts near VAH with stops above
Target POC for mean-reversion trades
Use POC as a trailing stop reference in trends
Alerts Available
VPL Cross Above POC — Price crosses above Point of Control
VPL Cross Below POC — Price crosses below Point of Control
VPL Cross Above VAH — Price breaks above Value Area High
VPL Cross Below VAL — Price breaks below Value Area Low
Best Practices
Use longer lookback periods for more significant levels
Increase row count for more precise level identification
POC from higher timeframes is more significant
Combine with other indicators for confirmation
This indicator is provided for educational purposes. It does not constitute financial advice. Past performance does not guarantee future results. Always conduct your own analysis and use proper risk management before making trading decisions.
— Made with passion by officialjackofalltrades

RegimeLens [JOAT]RegimeLens — Market Regime Detection and Classification
RegimeLens identifies whether the market is in a Trending, Ranging, or Volatile state using a proprietary combination of trend strength analysis, volatility measurement, and percentile-based classification. Understanding the current market regime helps traders adapt their approach to current conditions—because the strategy that works in a trend will fail in a range.
Why This Script is Protected
This script is published as closed-source to protect the proprietary regime classification algorithm and the specific threshold calibration methodology from unauthorized republishing. The unique combination of ADX analysis, Bollinger Band width percentiles, ATR percentile ranking, and the transition zone logic represents original work that goes beyond standard regime detection approaches.
What Makes This Indicator Unique
Unlike simple trend indicators, RegimeLens:
Classifies markets into four distinct regimes, not just "trending" or "not trending"
Uses percentile-based volatility analysis for more adaptive classification
Includes a transition zone logic to prevent rapid regime flip-flopping
Tracks regime duration and strength for additional context
Provides visual regime changes with on-chart labels
What This Indicator Does
Classifies market into four regimes: Trend Up, Trend Down, Ranging, or Volatile
Displays Bollinger Bands colored according to current regime
Marks regime changes with on-chart labels
Colors price bars according to detected regime
Tracks regime duration and strength metrics
Provides comprehensive dashboard with all regime metrics
Core Methodology
The indicator analyzes multiple market dimensions to determine the current regime:
Trend Strength Analysis (ADX) — Measures directional movement strength regardless of direction. High ADX indicates trending; low ADX indicates ranging.
Directional Bias (DI+ vs DI-) — Determines whether bullish or bearish forces dominate when a trend is detected.
Volatility Expansion/Contraction (BB Width) — Tracks Bollinger Band width relative to historical norms using percentile ranking.
ATR Percentile Ranking — Compares current ATR to its historical distribution to identify abnormally high volatility conditions.
Regime Definitions
Trend Up (Green) — ADX above trending threshold with DI+ > DI- and price above basis. Strong directional movement with bullish bias confirmed.
Trend Down (Red) — ADX above trending threshold with DI- > DI+ and price below basis. Strong directional movement with bearish bias confirmed.
Ranging (Yellow) — ADX below ranging threshold indicating sideways consolidation. Low directional strength suggests mean-reversion strategies may work better.
Volatile (Purple) — Both ATR percentile AND BB width percentile above the high volatility threshold. Indicates unstable, potentially dangerous conditions where normal strategies may fail.
The classification uses a priority system where high volatility conditions take precedence, followed by trend strength evaluation, with ranging as the default state for low-activity periods.
Regime Strength Calculation
Each regime has an associated strength score (0-100%) that indicates how firmly the market is in that state:
For trends: Based on ADX relative to threshold plus BB percentile
For ranging: Based on inverse ADX plus inverse BB percentile
For volatile: Based on ATR percentile
This helps identify when regime transitions may be approaching—declining strength often precedes regime changes.
Visual Features
Regime-Colored Bollinger Bands — Upper, basis, and lower bands all colored by current regime
Band Fill — 85% transparent fill between bands in regime color
Background Highlighting — Optional 90% transparent background in regime color
Regime Change Labels — On-chart markers when regime changes (arrows for trends, diamond for range, X for volatile)
Bar Coloring — Optional price bar coloring by regime
Color Scheme
Trend Up Color — Default: #00C853 (bright green)
Trend Down Color — Default: #FF1744 (bright red)
Range Color — Default: #FFD600 (yellow)
Volatile Color — Default: #AA00FF (purple)
Dashboard Information
The on-chart table (top-right corner) displays:
Current regime name with color coding
ADX value (highlighted if above trend threshold)
DI+ / DI- comparison with directional coloring
Bollinger Band width percentage
Volatility percentile (highlighted if above volatile threshold)
Regime strength percentage
Duration in bars since last regime change
Inputs Overview
Detection Settings:
ADX Length — Period for ADX/DI calculation (default: 14, range: 5-50)
BB Length — Period for Bollinger Bands (default: 20, range: 10-100)
BB Multiplier — Standard deviation multiplier (default: 2.0, range: 1.0-4.0)
ATR Length — Period for ATR calculation (default: 14, range: 5-50)
Thresholds:
Trending ADX Threshold — ADX level above which market is considered trending (default: 25, range: 15-50)
Ranging ADX Threshold — ADX level below which market is considered ranging (default: 20, range: 10-40)
High Volatility Percentile — Percentile above which volatile regime is triggered (default: 75, range: 50-95)
Visual Settings:
Trend Up/Down/Range/Volatile Colors — Fully customizable color scheme
Show Background — Toggle regime-colored background
Show Regime Bands — Toggle Bollinger Bands display
Show Dashboard — Toggle the information table
Color Price Bars — Toggle bar coloring by regime
How to Use It
Strategy Selection:
Trend Up/Down — Use trend-following strategies (breakouts, pullbacks, moving average systems)
Ranging — Use mean-reversion strategies (support/resistance bounces, oscillator extremes)
Volatile — Reduce position size, widen stops, or stay flat until conditions stabilize
For Regime Change Trading:
Watch for regime change labels as potential entry points
Trend regime starting often signals breakout opportunity
Ranging regime starting after trend may signal consolidation before continuation
Volatile regime is a warning to be cautious
For Risk Management:
Increase position size during strong trend regimes
Decrease position size during volatile or ranging regimes
Use regime strength to gauge conviction
Monitor duration—very long regimes may be due for change
Alerts Available
MRD Trend Up — Market regime changed to trending bullish
MRD Trend Down — Market regime changed to trending bearish
MRD Ranging — Market regime changed to sideways consolidation
MRD Volatile — Market regime changed to high volatility state
MRD Any Change — Notification on any regime transition
Best Practices
Don't fight the regime—adapt your strategy to current conditions
Volatile regime is a warning sign, not a trading signal
Use regime strength to gauge how established the current state is
Combine with other indicators appropriate for the detected regime
This indicator is provided for educational purposes. It does not constitute financial advice. Past performance does not guarantee future results. Always conduct your own analysis and use proper risk management before making trading decisions.
— Made with passion by officialjackofalltrades

Quantum EdgeQuantum Edge
DESCRIPTION:
Time-based cycle alignment scanner using fractal cycle theory to detect when multiple timing cycles converge at mathematically significant zones.
█ OVERVIEW
Quantum Edge is a time-based cycle alignment scanner built on fractal cycle theory. Markets move in nested cycles across multiple timeframes. This indicator detects moments when several of these cycles simultaneously reach mathematically significant positions, creating potential turning points.
The core concept: when multiple independent timing cycles converge at key zones, the probability of a reaction increases. The more cycles aligned, the higher the probability score.
█ HOW IT WORKS
The indicator tracks multiple time-based cycles of varying lengths. Each cycle is analyzed for its current position within its phase. When a cycle reaches a statistically significant zone (based on cycle theory), it contributes points to a composite probability score.
Shorter cycles contribute fewer points (they align frequently).
Longer cycles contribute more points (they align rarely).
Additional weighting is applied for:
- Specific days of the week known for higher volatility
- Specific times of day associated with market structure shifts
The final score represents how many timing factors are currently aligned.
█ SIGNALS EXPLAINED
👑 Rare multi-cycle convergence — Several long-duration cycles aligned simultaneously. Occurs a few times per month.
💎 Strong convergence — Multiple mid-to-long duration cycles aligned. Occurs a few times per week.
🌅 Daily cycle alignment — Daily-length cycle at a key zone with supporting factors. Occurs 1-2 times per day.
🔥 Short cycle alignment — Shorter-duration cycles aligned. Occurs several times per day.
🔮 Prediction — The indicator scans ahead and displays where future alignments are likely to occur based on the deterministic nature of time cycles.
█ TRADING MODES
The indicator includes preset modes that adjust sensitivity:
SNIPER — Only displays the highest-scoring alignments. For patient traders waiting for the best setups.
DAILY — Displays daily-quality alignments and above. Recommended starting point for most traders.
ACTIVE — Displays more frequent setups. For traders who want more opportunities and can filter with price analysis.
SCALP — Displays all qualifying alignments. Highest frequency, requires additional confirmation.
█ WHAT MAKES THIS UNIQUE
This indicator uses a proprietary weighted scoring system based on fractal cycle mathematics. The specific cycle lengths, zone calculations, and weighting factors are the result of extensive research into cyclical market behavior.
The predictive feature is deterministic — because time cycles are mathematical, future alignments can be calculated in advance. This allows traders to plan entries before setups occur rather than reacting after the fact.
The source is protected because the specific parameters and scoring logic represent significant research and development.
█ INTENDED USE
This is a TIMING tool, not a directional signal generator.
It answers: "When are multiple cycles aligned?"
It does NOT answer: "Which direction should I trade?"
Combine with your own price analysis (support/resistance, order flow, market structure) to determine direction. Use this tool to identify WHEN those setups have higher probability.
█ LIMITATIONS
- No indicator predicts the future with certainty
- Cycle alignments indicate probability, not guaranteed outcomes
- Past alignment results do not guarantee future performance
- This tool requires combination with price-based analysis for best results
- Not all alignments result in tradeable moves
█ SETTINGS
- Mode Selection: Choose your preferred sensitivity level
- Show Score: Toggle probability scores on/off
- Show Predictions: Toggle future alignment predictions on/off
- Prediction Range: How far ahead to scan for alignments
- Colors: Customize signal colors to your preference
█ MARKETS AND TIMEFRAMES
Works on any liquid market: Futures, Forex, Crypto, Stocks, Indices.
Optimized for intraday timeframes (1-15 minute charts) but can be applied to higher timeframes for swing trading applications.
█ ACCESS
This is an invite-only script. If you have questions about the methodology or would like to discuss access, you may send me a direct message.

Fractal Support & Resistance [JOAT]
Fractal Support & Resistance — Automatic Level Detection with Volume Weighting
Fractal Support & Resistance automatically identifies key price levels using a proprietary combination of fractal detection, volume analysis, and dynamic touch counting. Levels are intelligently styled based on their strength and how many times they have been tested, giving you instant visual feedback on level importance.
Why This Script is Protected
This script is published as closed-source to protect the proprietary level management algorithm and the unique volume-weighted strength calculation methodology from unauthorized republishing. The specific implementation of touch detection, level merging logic, and dynamic opacity calculations represents original work that differentiates this from standard fractal indicators.
What Makes This Indicator Unique
Unlike basic fractal indicators that simply mark pivot points, this system:
Tracks how many times each level has been tested (touch counting)
Weights level importance by volume at the fractal point
Merges nearby fractals into single levels instead of cluttering the chart
Dynamically adjusts visual opacity based on level strength
Provides zone boxes around levels for realistic price reaction areas
What This Indicator Does
Detects fractal pivot highs and lows to establish support and resistance levels
Tracks how many times each level has been touched or tested
Weights level importance by volume at the fractal point
Draws extending lines and zone boxes for each level
Dynamically adjusts level opacity based on touch count for visual strength indication
Provides a dashboard with nearest levels and counts
Core Methodology
The indicator uses Williams Fractal concepts as a foundation but extends them with proprietary enhancements:
Fractal Detection — Identifies pivot highs and lows where price creates local extremes with confirmation bars on each side. A fractal high requires the highest point with lower highs on both sides; a fractal low requires the lowest point with higher lows on both sides.
Level Clustering — New fractals within a tolerance zone (based on Zone Padding %) update existing levels rather than creating duplicates. This keeps the chart clean and focuses on significant price areas.
Volume Integration — Volume at each fractal point is accumulated to weight level significance. Higher volume fractals are considered more important.
Touch Tracking — The system monitors when price approaches existing levels and increments touch counts. More touches indicate stronger, more significant levels.
Visual Strength System
Level appearance changes dynamically based on market interaction:
Newer or less-tested levels appear more transparent (up to 80% transparency)
Each additional touch reduces transparency by 15%
Heavily tested levels become more prominent and opaque (minimum 20% transparency)
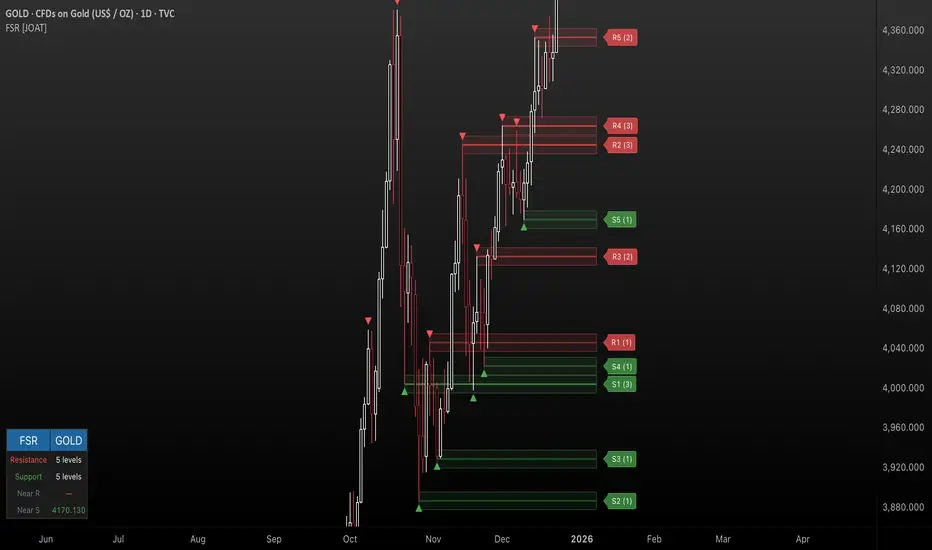
Labels display level number and touch count (e.g., "R1 (3)" = Resistance 1 with 3 touches)
Zone boxes provide visual areas around each level
Color Scheme
Resistance Color — Default: #FF5252 (red) — Used for resistance levels and zones
Support Color — Default: #4CAF50 (green) — Used for support levels and zones
Zone Fill — 90% transparent version of level color
Zone Border — 70% transparent version of level color
Labels — 30% transparent background with white text
Dashboard Information
The on-chart table (bottom-left corner) displays:
Number of active resistance levels meeting minimum touch requirement
Number of active support levels meeting minimum touch requirement
Nearest resistance level above current price
Nearest support level below current price
Inputs Overview
Fractal Settings:
Fractal Period — Bars on each side for fractal confirmation (default: 2, range: 1-10)
Max Levels Per Side — Maximum resistance and support levels to track (default: 5, range: 1-20)
Zone Padding (%) — Level zone width as percentage of price (default: 0.2%, range: 0-2%)
Filtering:
Volume Weight Levels — Toggle volume-weighted level importance (default: on)
Min Touches to Show — Filter out levels with fewer touches (default: 1, range: 1-10)
Lookback Period — Historical bars to analyze for level detection (default: 200, range: 50-500)
Visual Settings:
Resistance/Support Colors — Customizable color scheme
Show Zone Boxes — Toggle filled zone areas around levels
Show Level Labels — Toggle level labels with touch counts
Show Fractal Markers — Toggle small triangles at fractal points
Show Dashboard — Toggle the information table
Line Width — Thickness of level lines (default: 2, range: 1-5)
How to Use It
For Support/Resistance Trading:
Use levels with higher touch counts as stronger support/resistance references
More opaque levels have been tested more times and are more significant
Watch for price reactions at zone boundaries, not just exact level prices
Combine with candlestick patterns at levels for entry signals
For Breakout Trading:
Watch for breakouts when price closes beyond a level
Levels with many touches that finally break often produce strong moves
Use the zone box—a close beyond the zone is more significant than just touching the level
Set alerts for resistance/support breaks
For Target Setting:
Use the nearest resistance as a profit target for long positions
Use the nearest support as a profit target for short positions
Dashboard shows these levels for quick reference
Alerts Available
FSR Resistance Break — Price closes above a resistance level
FSR Support Break — Price closes below a support level
FSR New Fractal High — Fresh fractal high detected
FSR New Fractal Low — Fresh fractal low detected
Best Practices
Increase Fractal Period for fewer but more significant levels
Use Min Touches filter to show only well-tested levels
Volume weighting helps identify institutionally significant levels
Combine with trend indicators—trade with the trend at levels
This indicator is provided for educational purposes. It does not constitute financial advice. Past performance does not guarantee future results. Always conduct your own analysis and use proper risk management before making trading decisions.
— Made with passion by officialjackofalltrades
Neural Trend Engine [JOAT]Neural Trend Engine - Multi-Layer Adaptive Trend Detection
Neural Trend Engine uses a multi-layer filtering approach inspired by neural network concepts. It combines multiple adaptive moving averages with proprietary momentum and volatility weighting to generate trend signals with reduced lag and improved confidence scoring.
Why This Script is Protected
This script is published as closed-source to protect the proprietary signal composition algorithm and the specific weighting methodology from unauthorized republishing. The unique combination of adaptive layer calculations, momentum normalization, and volatility integration represents original work that goes beyond standard indicator implementations.
What Makes This Indicator Unique
Unlike simple moving average crossover systems, Neural Trend Engine:
Uses three Kaufman Adaptive Moving Averages (KAMA) that automatically adjust their smoothing based on market efficiency
Combines layer alignment, momentum, and volatility into a single "neural signal"
Provides signal strength percentages so you know the conviction level of each signal
Creates a visual trend cloud that makes direction immediately obvious
What This Indicator Does
Plots three adaptive moving average "layers" that respond dynamically to market efficiency
Creates a trend cloud between fast and slow layers for visual trend identification
Generates weighted composite signals from layer alignment, momentum, and volatility
Displays buy/sell labels with signal strength percentages
Provides a comprehensive dashboard with multi-component breakdown
Colors the neural line and cloud based on current trend direction
Core Methodology
The indicator employs a three-layer adaptive system where each layer responds to market conditions at different speeds:
Fast Layer (default: 8) — Quick response for short-term direction changes
Medium Layer (default: 21) — Intermediate trend reference
Slow Layer (default: 55) — Long-term trend anchor
Each layer uses efficiency-based adaptation, meaning they become more responsive during trending conditions and smoother during choppy markets.
The neural signal is a proprietary composite that weighs three distinct market components:
Momentum Component (default: 40%) — Measures directional price velocity, normalized to its recent range
Trend Component (default: 35%) — Evaluates alignment between the three adaptive layers
Volatility Component (default: 25%) — Incorporates market volatility state into signal generation
These components are combined using a weighted formula that has been calibrated to balance responsiveness with noise reduction.
Signal Generation
Direction changes occur when the smoothed neural signal crosses a configurable strength threshold:
Bullish — Signal exceeds positive threshold with layer alignment confirmation
Bearish — Signal drops below negative threshold with layer alignment confirmation
Neutral — Signal remains within threshold range, indicating consolidation
Signal strength percentages indicate the conviction level of each signal, helping traders assess trade quality. Higher percentages suggest stronger trend conviction.
Visual Features
Trend Cloud — Filled area between fast and slow layers, colored by trend direction
Neural Line with Glow — Weighted average of all three layers with glow effect
Medium Layer — Subtle white line showing intermediate trend
Signal Labels — BUY/SELL labels with strength percentages at signal points
Small Markers — Alternative triangle markers when labels are disabled
Color Scheme
Bullish Color — Default: #26A69A (teal green) — Used for bullish trends and signals
Bearish Color — Default: #EF5350 (red) — Used for bearish trends and signals
Cloud Fill — 85% transparent version of trend color
Neural Line Glow — 60% transparent version for glow effect
Dashboard Information
The on-chart table (top-right corner) displays:
Current direction (BULLISH, BEARISH, or NEUTRAL)
Neural signal percentage
Layer alignment status (ALIGNED UP, ALIGNED DOWN, or MIXED)
Momentum direction and percentage
Trend strength percentage
Inputs Overview
Neural Layers:
Fast Layer — Period for fast adaptive MA (default: 8, range: 2-50)
Medium Layer — Period for medium adaptive MA (default: 21, range: 5-100)
Slow Layer — Period for slow adaptive MA (default: 55, range: 10-200)
Source — Price source for calculations (default: close)
Sensitivity:
Momentum Weight — Weight for momentum component (default: 0.4)
Trend Weight — Weight for trend/layer alignment (default: 0.35)
Volatility Weight — Weight for volatility component (default: 0.25)
ATR Period — Period for volatility calculations (default: 14)
Visual Settings:
Bullish/Bearish Colors — Customizable color scheme
Show Trend Cloud — Toggle the filled cloud area
Show Signal Labels — Toggle BUY/SELL labels with percentages
Show Neural Line — Toggle the main trend line
Show Dashboard — Toggle the information table
Alerts:
Await Bar Confirmation — Wait for bar close before triggering (recommended)
Min Signal Strength — Threshold for direction changes (default: 0.3 = 30%)
How to Use It
For Trend Following:
Follow the trend cloud color for overall market direction
Enter long when cloud turns bullish (teal) and signal strength is high
Enter short when cloud turns bearish (red) and signal strength is high
Use the neural line as a trailing stop reference
For Signal Trading:
Wait for BUY/SELL labels to appear
Check the signal strength percentage—higher is better
Confirm with dashboard showing aligned layers
Avoid signals during MIXED layer alignment
For Confirmation:
Use Neural Trend Engine to confirm signals from other systems
Strong confirmation when all three layers are aligned
Dashboard shows momentum and trend strength for additional context
Alerts Available
NTE Buy Signal — Bullish direction change detected
NTE Sell Signal — Bearish direction change detected
NTE Direction Change — Any trend direction change
Best Practices
Higher signal strength percentages indicate more reliable signals
Wait for layer alignment (shown in dashboard) before entering trades
Use on higher timeframes for more reliable trend identification
Combine with support/resistance levels for entry timing
This indicator is provided for educational purposes. It does not constitute financial advice. Past performance does not guarantee future results. Always conduct your own analysis and use proper risk management before making trading decisions.
— Made with passion by officialjackofalltrades

Liquidity Maxing [JOAT]Liquidity Maxing - Institutional Liquidity Matrix
Introduction
Liquidity Maxing is an open-source strategy for TradingView built around institutional market structure concepts. It identifies structural shifts, evaluates trades through multi-factor confluence, and implements layered risk controls.
The strategy is designed for swing trading on 4-hour timeframes, focusing on how institutional order flow manifests in price action through structure breaks, inducements, and liquidity sweeps.
Core Functionality
Liquidity Maxing performs three primary functions:
Tracks market structure to identify when control shifts between buyers and sellers
Scores potential trades using an eight-factor confluence system
Manages position sizing and risk exposure dynamically based on volatility and user-defined limits
The goal is selective trading when multiple conditions align, rather than frequent entries.
Market Structure Engine
The structure engine tracks three key events:
Break of Structure (BOS): Price pushes beyond a prior pivot in the direction of trend
Change of Character (CHoCH): Control flips from bullish to bearish or vice versa
Inducement Sweeps (IDM): Market briefly runs stops against trend before moving in the real direction
The structure module continuously updates strong highs and lows, labeling structural shifts visually. IDM markers are optional and disabled by default to maintain chart clarity.
The trade engine requires valid structure alignment before considering entries. No structure, no trade.
Eight-Factor Confluence System
Instead of relying on a single indicator, Liquidity Maxing uses an eight-factor scoring system:
Structure alignment with current trend
RSI within healthy bands (different ranges for up and down trends)
MACD momentum agreement with direction
Volume above adaptive baseline
Price relative to main trend EMA
Session and weekend filter (configurable)
Volatility expansion/contraction via ATR shifts
Higher-timeframe EMA confirmation
Each factor contributes one point to the confluence score. The default minimum confluence threshold is 6 out of 8, but you can adjust this from 1-8 based on your preference for trade frequency versus selectivity.
Only when structure and confluence agree does the strategy proceed to risk evaluation.
Dynamic Risk Management
Risk controls are implemented in multiple layers:
ATR-based stops and targets with configurable risk-to-reward ratio (default 2:1)
Volatility-adjusted position sizing to maintain consistent risk per trade as ranges expand or compress
Daily and weekly risk budgets that halt new entries once thresholds are reached
Correlation cooldown to prevent clustered trades in the same direction
Global circuit breaker with maximum drawdown limit and emergency kill switch
If any guardrail is breached, the strategy will not open new positions. The dashboard clearly displays risk state for transparency.
Market Presets
The strategy includes configuration presets optimized for different market types:
Crypto (BTC/ETH): RSI bands 70/30, volume multiplier 1.2, enhanced ATR scaling
Forex Majors: RSI bands 75/25, volume multiplier 1.5
Indices (SPY/QQQ): RSI bands 70/30, volume multiplier 1.3
Custom: Default values for user customization
For crypto assets, the strategy automatically applies ATR volatility scaling to account for higher volatility characteristics.
Monitoring and Dashboards
The strategy includes optional monitoring layers:
Risk Operations Dashboard (top-right):
Trend state
Confluence score
ATR value
Current position size percentage
Global drawdown
Daily and weekly risk consumption
Correlation guard state
Alert mode status
Performance Console (top-left):
Net profit
Current equity
Win rate percentage
Average trade value
Sharpe-style ratio (rolling 50-bar window)
Profit factor
Open trade count
Optional risk tint on chart background provides visual indication of "safe to trade" versus "halted" state.
All visualization elements can be toggled on/off from the inputs for clean chart viewing or full telemetry during parameter tuning.
Alerts and Automation
The strategy supports alert integration with two formats:
Standard alerts: Human-readable messages for long, short, and risk-halt conditions
Webhook format: JSON-formatted payloads ready for external execution systems (optional)
Alert messages are predictable and unambiguous, suitable for manual review or automated forwarding to execution engines.
Built-in Validation Suite
The strategy includes an optional validation layer that can be enabled from inputs. It checks:
Internal consistency of structure and confluence metrics
Sanity and ordering of risk parameters
Position sizing compliance with user-defined floors and caps
This validation is optional and not required for trading, but provides transparency into system operation during development or troubleshooting.
Strategy Parameters
Market Presets:
Configuration Preset: Choose between Crypto (BTC/ETH), Forex Majors, Indices (SPY/QQQ), or Custom
Market Structure Architecture:
Pivot Length: Default 5 bars
Filter by Inducement (IDM): Default enabled
Visualize Structure: Default enabled
Structure Lookback: Default 50 bars
Risk & Capital Preservation:
Risk:Reward Ratio: Default 2.0
ATR Period: Default 14
ATR Multiplier (Stop): Default 2.0
Max Drawdown Circuit Breaker: Default 10%
Risk per Trade (% Equity): Default 1.5%
Daily Risk Limit: Default 6%
Weekly Risk Limit: Default 12%
Min Position Size (% Equity): Default 0.25%
Max Position Size (% Equity): Default 5%
Correlation Cooldown (bars): Default 3
Emergency Kill Switch: Default disabled
Signal Confluence:
RSI Length: Default 14
Trend EMA: Default 200
HTF Confirmation TF: Default Daily
Allow Weekend Trading: Default enabled
Minimum Confluence Score (0-8): Default 6
Backtesting Considerations
When backtesting this strategy, consider the following:
Commission: Default 0.05% (adjustable in strategy settings)
Initial Capital: Default $100,000 (adjustable)
Position Sizing: Uses percentage of equity (default 2% per trade)
Timeframe: Optimized for 4-hour charts, though can be tested on other timeframes
Results will vary significantly based on:
Market conditions and volatility regimes
Parameter settings, especially confluence threshold
Risk limit configuration
Symbol characteristics (crypto vs forex vs equities)
Past performance does not guarantee future results. Win rate, profit factor, and other metrics should be evaluated in context of drawdown periods, trade frequency, and market conditions.
How to Use This Strategy
This is a framework that requires understanding and parameter tuning, not a one-size-fits-all solution.
Recommended workflow:
Start on 4-hour timeframe with default parameters and appropriate market preset
Run backtests and study performance console metrics: focus on drawdown behavior, win rate, profit factor, and trade frequency
Adjust confluence threshold to match your risk appetite—higher thresholds mean fewer but more selective trades
Set realistic daily and weekly risk budgets appropriate for your account size and risk tolerance
Consider ATR multiplier adjustments based on market volatility characteristics
Only connect alerts or automation after thorough testing and parameter validation
Treat this as a risk framework with an integrated entry engine, not merely an entry signal generator. The risk controls are as important as the trade signals.
Strategy Limitations
Designed for swing trading timeframes; may not perform optimally on very short timeframes
Requires sufficient market structure to identify pivots; may struggle in choppy or low-volatility environments
Crypto markets require different parameter tuning than traditional markets
Risk limits may prevent entries during favorable setups if daily/weekly budgets are exhausted
Correlation cooldown may delay entries that would otherwise be valid
Backtesting results depend on data quality and may not reflect live trading with slippage
Design Philosophy
Many indicators tell you when price crossed a moving average or RSI left oversold. This strategy addresses questions institutional traders ask:
Who is in control of the market right now?
Is this move structurally significant or just noise?
Do I want to add more risk given what I've already done today/week?
If I'm wrong, exactly how painful can this be?
The strategy provides disciplined, repeatable answers to these questions through systematic structure analysis, confluence filtering, and multi-layer risk management.
Technical Implementation
The strategy uses Pine Script v6 with:
Custom types for structure, confluence, and risk state management
Functional programming approach for reusable calculations
State management through persistent variables
Optional visual elements that can be toggled independently
The code is open-source and can be modified to suit individual needs. All important logic is visible in the source code.
Disclaimer
This script is provided for educational and informational purposes only. It is not intended as financial, investment, trading, or any other type of advice or recommendation. Trading involves substantial risk of loss and is not suitable for all investors. Past performance, whether real or indicated by historical tests of strategies, is not indicative of future results.
No representation is being made that any account will or is likely to achieve profits or losses similar to those shown. In fact, there are frequently sharp differences between backtested results and actual results subsequently achieved by any particular trading strategy.
The user should be aware of the risks involved in trading and should trade only with risk capital. The authors and publishers of this script are not responsible for any losses or damages, including without limitation, any loss of profit, which may arise directly or indirectly from use of or reliance on this script.
This strategy uses technical analysis methods and indicators that are not guaranteed to be accurate or profitable. Market conditions change, and strategies that worked in the past may not work in the future. Users should thoroughly test any strategy in a paper trading environment before risking real capital.
Commission and slippage settings in backtests may not accurately reflect live trading conditions. Real trading results will vary based on execution quality, market liquidity, and other factors not captured in backtesting.
The user assumes full responsibility for all trading decisions made using this script. Always consult with a qualified financial advisor before making investment decisions.
Enjoy - officialjackofalltrades

Session Relative VolumeSession Relative Volume is an advanced intraday futures volume indicator that analyzes volume separately for Asia, London, and New York sessions - something standard relative volume tools can’t do.
Instead of aggregating the entire day’s volume, the indicator compares current volume to historical averages for the same session and time of day, allowing you to spot true volume strength and meaningful spikes, especially around session opens.
Background
Relative volume helps traders spot unusual activity: high volume often signals institutional participation and trending days, while low volume suggests weak commitment and possible mean reversion. In futures markets, sessions ( Asia, London, New York ) must be analyzed separately, but TradingView’s Relative Volume in Time aggregates the entire day, masking session-specific behavior - especially during the New York open. Since volume can vary by more than 20× between sessions, standard averages struggle to identify meaningful volume spikes when trader conviction matters most.
Indicator Description
The “Session Relative Volume” indicator solves these problems by calculating historical average volume specific to each session and time of day, and comparing current volume against those benchmarks. It offers four display modes and fully customizable session times
Altogether, it provides traders with a powerful tool for analyzing intraday futures volume, helping to better assess market participation, trader conviction, and overall market conditions - ultimately supporting improved trading decisions.
Parameters
Mode – display mode:
R-VOL: Relative cumulative session-specific volume at time
VOL CUM: Cumulative session volume at time compared to historical average cumulative session-specific volume
VOL AVG: Average session intrabar volume at time compared to historical average session-specific intrabar volume
VOL: Individual bars volume, highlighting (solid color) unusual spikes
Lookback period – number of days used for calculating historical average session volume at time
MA Len – length of the moving average, representing average bar volume within a session based on previous periods (different from historical cumulative volume!). Used only in VOL and VOL AVG modes
MA Thresh – deviation from moving average, used to detect bar volume spikes (bar volume > K × moving average)
Start Time – End Time and Time Zone parameters for each session. The time zone must be set using TradingView’s format (e.g., GMT+1).

Liquidity Levels Pro Tool - thewallranka
Liquidity Levels Pro Tool is a market-structure and liquidity-mapping indicator designed to help discretionary futures and index traders identify statistically relevant price levels where reactions, continuations, or liquidity sweeps are more likely to occur.
This script is a decision-support tool, not a signal generator. It does not issue buy/sell alerts or predict future price movement. Instead, it organizes and scores liquidity information so traders can make their own contextual decisions.
What this indicator does
The script continuously detects and maintains liquidity zones derived from price pivots, then evaluates those zones using multiple structural and contextual factors:
Repeated price interaction (touches)
Freshness (time since last interaction)
Confluence with key reference levels
Reaction behavior after contact
Session relevance (RTH vs overnight)
Market regime (trend vs mean reversion)
Time-of-day effects (open, midday, power hour)
Only the most relevant zones—based on a dynamic scoring system—are displayed to reduce chart clutter and focus attention on levels that have historically mattered.
Core components
1. Liquidity Zones
Zones are built from pivot highs and lows and expanded into areas using a configurable tick-based padding. Nearby zones are merged to avoid redundancy.
Each zone is continuously evaluated and assigned a score (0–100) reflecting its relative importance.
2. Zone Scoring (No Lookahead)
Zone scores are based on:
Number of confirmed interactions
Recency of the last touch
Confluence with prior day/week levels, VWAP, and Opening Range
Reaction quality after touches (speed and follow-through)
Session alignment (zones that “work” in the current session are favored)
Penalties after liquidity sweeps
Zones are not forward-looking and do not rely on future data.
3. Context Engine
The script classifies the current environment using VWAP slope and distance:
Trend (up or down)
Mean reversion
Mixed/transition
Time-of-day context (Open, Midday, Power Hour) is also tracked internally and influences zone scoring.
This context is displayed in the HUD to support situational awareness, not automated decisions.
4. Liquidity Sweeps
Optional sweep detection highlights situations where price trades beyond a zone and closes back inside, indicating potential stop runs or failed breakouts.
Sweeps are rate-limited and applied conservatively to avoid visual noise.
5. Trade Planning Levels (Optional)
When enabled, the script highlights the nearest high-quality liquidity level above and below price based on score thresholds.
These are intended as reference targets, not trade entries or exits.
HUD (Heads-Up Display)
The on-chart HUD summarizes:
Key reference levels (prior day/week, Opening Range)
Nearest strong liquidity above/below price
Market regime and time-of-day context
Distance to levels (ticks or points)
The HUD is fully optional, positionable, and includes resizable modes (Small / Medium / Large) to fit different chart layouts.
How to use this tool
This indicator is best used as part of a discretionary trading process, for example:
Identifying areas where price is more likely to react or pause
Framing trades around higher-quality structure instead of arbitrary levels
Filtering setups based on session and regime context
Managing expectations near known liquidity rather than chasing price
It is intentionally designed not to provide trade signals.
Limitations and important notes
This script does not predict outcomes or guarantee reactions
High-scoring zones can still fail
Liquidity behavior is context-dependent and probabilistic
No performance claims or backtested results are provided
The indicator should not be used in isolation
Past behavior does not imply future results.
Chart and usage notes
The script is intended for standard time-based charts
Recommended for liquid futures and index products
Use a clean chart for clarity when publishing or sharing
No external indicators are required
Final note
Liquidity Levels Pro (Tool) — v6 is designed to organize complex market structure into a clear, readable framework, allowing traders to focus on execution and risk management rather than raw level detection.
This script reflects an analytical approach to intraday liquidity and structure, not an automated trading system.

Context Bundle | VWAP / EMA / Session HighLow (v6)
📌 0DTE Context Bundle (v6)
**VWAP • EMA Cloud • Session High/Low (NY / London / Asia)
The **0DTE Context Bundle** is a *decision-making overlay*, not a signal spam indicator.
It’s designed to help traders clearly see **value, trend, and liquidity levels** across **New York, London, and Asia sessions** — all in one clean, customizable tool.
Built for **NQ, ES, Gold, and FX pairs**, with a focus on **5–15-minute execution charts**.
---
## 🔹 What This Indicator Shows
### ✅ VWAP + ATR Bands
* Session VWAP (fair value)
* ATR-based extension bands (1x / 2x)
* Helps identify **overextension, mean reversion zones, and trend pullbacks**
### ✅ EMA 9 / 21 Cloud
* Visual trend and momentum filter
* Custom colors + opacity
* Identifies **trend continuation vs chop**
### ✅ Session High / Low Levels
* **New York RTH**
* **London**
* **Asia (midnight-safe)**
* Optional previous session highs/lows
* Adjustable line styles, widths, colors, and extensions
### ✅ Anchored VWAP (Optional)
* Reset by:
* Daily
* NY session start
* London session start
* Asia session start
* Useful for tracking **session-specific value shifts**
---
## 🔹 How Traders Use It
This indicator is meant to answer:
* *Are we trading at value or extension?*
* *Is the market trending or rotating?*
* *Where is liquidity likely sitting right now?*
Common use cases:
* Trend pullbacks into VWAP or EMA cloud
* Reversal setups at session highs/lows
* Session breakout + retest confirmation
* Overnight context for London and Asia sessions
---
## 🔹 Customization & Flexibility
Every component can be toggled and styled:
* Colors, widths, line styles
* Cloud up/down colors + opacity
* Session visibility and extensions
* VWAP band multipliers and ATR length
Members can adapt it to **their own style**, market, and timeframe.
---
## ⚠️ Disclaimer
This indicator is provided for **educational and informational purposes only**.
It does **not** provide financial advice or trade signals.
Always manage risk and confirm entries with your own strategy.

AlgoIndex NQ/MNQ FuturesAlgoIndex Futures v3.15 - NQ/MNQ (10-Minute RTH)
This strategy is specifically tailored for trading CME Nasdaq futures - NQ and MNQ, including continuous symbols such as NQ1!/MNQ1!. It is optimized for a 10-minute chart during U.S. Regular Trading Hours (RTH), utilizing session settings defined in the Inputs. This strategy is not intended for other futures contracts or markets.
Core Concept
The strategy employs an ATR-based trend-band model similar to Supertrend for identifying directional mechanism changes in NQ/MNQ. Trade signals are evaluated at the bar close, incorporating session and time-based safety techniques to mitigate lower-quality trading opportunities near session boundaries.
Recommended Use (Optimized Defaults)
The default input parameters are fine-tuned for NQ/MNQ on the 10-minute chart. Users are encouraged to utilize these defaults initially and to make incremental adjustments to one variable at a time to understand the impact on the strategy's performance, trading frequency, and risk profile.
Configurable Inputs
- Take Profit / Stop Loss Settings:
- Enable Stop Loss and define Stop Loss (Points)
- Enable Take Profit and define Take Profit (Points)
- Enable Trailing Stop and set both Trailing Stop (Points) and Trailing Offset (Points)
- Time Avoidance Filter:
- Enable Time Avoidance
- Avoid First X Minutes
- Avoid Last X Minutes
- Display Avoidance Zones (visual overlay)
- Session Filter and End-of-Day Management:
- Enable Session Filter
- Define Trading Session (default: 09:30-16:00)
- Select Session Timezone
- Option to Close Positions at Session End
- Specify EOD Close Minutes Before (default: 20)
- Safety Controls:
- Option to Close Before Holidays (when enabled, this feature allows the strategy to flatten positions prior to holiday or early close conditions)
- Automation Settings (Optional):
- Ticker Override (optional)
- Define Contracts (position size)
- Strategy Configuration:
- Trade Direction: Both / Long Only / Short Only
- Visual Configuration:
- Option to Show Buy/Sell Signals
- Highlight Trend Zones
- Display Info Table
- Customizable Bull/Bear Colors
Alerts and Automation (Optional)
This strategy can generate order-fill alert payloads for hooking into webhook-based automation solutions. Keep in mind to validate your alert type and your bridge/broker configuration during Replay and paper trading. Note that reversals may trigger two sequential actions (e.g., exit followed by new entry).
Backtest Notes (Optional)
For more precise historical fill data, consider enabling TradingView’s Bar Magnifier in Strategy Properties. Always apply consistent assumptions for commission and slippage when comparing backtest results.
Disclaimer
This script is intended for informational and educational purposes only and does not constitute investment advice. Trading futures carries significant risk and may result in losses that exceed the initial deposit. Backtested results are hypothetical and do not guarantee future performance.

Forexsebi - DAX Future Psychological Levels - TrendflowTrendflow is an advanced TradingView indicator combining psychological price levels with trend and multi-timeframe analysis.
The indicator automatically plots psychological levels in around the current price. Each level is visualized using horizontal lines and price zones (boxes) to clearly highlight potential support and resistance areas.
Psychological Levels – Trendflow ist ein fortschrittlicher TradingView-Indikator , der wichtige psychologische Preislevel mit einer klaren Trend- und Multi-Timeframe-Analyse kombiniert.
Trend Analysis with SMAs
SMA 50 & SMA 200 plotted directly on the chart
Individually toggleable
Clear color separation for fast trend recognition
Multi-Timeframe SMA Trend Table
Trend status (BULLISH / BEARISH / NEUTRAL) across:
5M, 15M, 1H, 4H, 1D
Logic: Price relative to SMA 50 & SMA 200
Color-coded, easy-to-read table
Info Box
Current Gold price
Nearest psychological level above and below price
Alert System
Alerts when price approaches a psychological level
User-defined alert distance

MorphWave Bands [JOAT]MorphWave Bands - Adaptive Volatility Envelope System
MorphWave Bands create a dynamic price envelope that automatically adjusts its width based on current market conditions. Unlike static Bollinger Bands, this indicator blends ATR and standard deviation with an efficiency ratio to expand during trending conditions and contract during consolidation.
What This Indicator Does
Plots adaptive upper and lower bands around a customizable moving average basis
Automatically adjusts band width using a blend of ATR and standard deviation
Detects volatility squeezes when bands contract to historical lows
Highlights breakouts when price moves beyond the bands
Provides squeeze alerts for anticipating volatility expansion
Adaptive Mechanism
The bands adapt through a multi-step process:
// Blend ATR and Standard Deviation
blendedVol = useAtrBlend ? (atrVal * 0.6 + stdVal * 0.4) : stdVal
// Normalize volatility to its historical range
volNorm = (blendedVol - volLow) / (volHigh - volLow)
// Create adaptive multiplier
adaptMult = baseMult * (0.5 + volNorm * adaptSens)
This creates bands that respond to market regime changes while maintaining stability.
Squeeze Detection
A squeeze is identified when band width drops below a specified percentile of its historical range:
Background highlighting indicates active squeeze conditions
Low percentile readings suggest compressed volatility
Squeeze exits often precede directional moves
Inputs Overview
Band Length — Period for basis calculation (default: 20)
Base Multiplier — Starting band width multiplier (default: 2.0)
MA Type — Choose from SMA, EMA, WMA, VWMA, or HMA
Adaptation Lookback — Historical period for normalization (default: 50)
Adaptation Sensitivity — How much bands respond to volatility changes
Squeeze Threshold — Percentile below which squeeze is detected
Dashboard Information
Current trend direction relative to basis and bands
Band width percentage
Squeeze status (Active or None)
Efficiency ratio
Current adaptive multiplier value
How to Use It
Look for squeeze conditions as potential precursors to breakouts
Use band touches as dynamic support/resistance references
Monitor breakout signals when price closes beyond bands
Combine with momentum indicators for directional confirmation
Alerts
Upper/Lower Breakout — Price exceeds band boundaries
Squeeze Entry/Exit — Volatility compression begins or ends
Basis Crosses — Price crosses the center line
This indicator is provided for educational purposes. It does not constitute financial advice.
— Made with passion by officialjackofalltrades

Vib ORB Range (Free)Vib ORB Range (Free) plots the Opening Range High and Low for the session based on a user-defined start time and duration.
This tool is designed for traders who want a clean, no-noise display of the ORB zone without extra indicators or automation.
Features:
Customizable Opening Range start time
Customizable Opening Range duration
Automatically resets daily
Plots ORB High, ORB Low, and optional ORB Midline
Shaded range zone for improved clarity
Works on all timeframes and markets
How to Use:
Set the ORB start time (default 9:30 New York)
Set the ORB duration (default 15 minutes)
The indicator will draw the ORB zone once the range completes
Use the outlines or shaded zone to visually identify potential breakout areas
This free tool is intended as a simple, reliable ORB visualizer without alerts, filters, or strategy logic.

Bayesian Order Flow Predictor📌 Bayesian Order Flow Predictor — Advanced Probability Engine for Nasdaq and Futures
This indicator is a next-generation probabilistic forecasting system designed for Nasdaq traders who rely on Order Flow, Auction Market Theory, Value Area dynamics, market structure, DOM imbalance, and Bayesian probability models.
It combines 7 professional-grade factors (DOM, CVD, RSI, EMA trend, ATR volatility, Market Structure, Value Area positioning) into a unified Bayesian probability panel that outputs a clean bullish/bearish probability curve with high-confidence reversal and trend-continuation signals.
Engineered for scalpers, day traders, futures traders, and ICT-style order flow technicians, it delivers real-time directional probability, session-aware signals, and optional news-filter exclusion.
⭐ Features
Bayesian Probability Model (0–100%)
DOM imbalance scoring across dynamic depth levels
Cumulative Volume Delta (CVD) scoring
Market structure detection (HH/LL micro-trend shifts)
RSI momentum and overbought/oversold scoring
EMA directional bias + ATR-normalized deviation
Value Area positioning (VAH / VAL / POC) with optional previous-session mode
Session filtering (only signals during active hours)
Automated news filter (exclude signals around scheduled macro events)
Bull/Bear probability zones with background coloring
Anti-repetition system (no double signals in same direction)
Designed for future scalping, futures order flow, and high-precision timing
🧠 Bayesian Probability Engine — How It Works
The model evaluates 7 independent market factors simultaneously:
DOM imbalance
CVD pressure
Market structure
RSI deviation
EMA trend
Value Area position
ATR volatility shift
Each factor is transformed into a normalized score, multiplied by its weighting parameter, and aggregated into a global score.
This score is then passed through a Bayesian logistic function to convert uncertainty into a smooth probability curve, giving traders a clean, mathematically stable, and noise-resistant forecast.
📈 Buy & Sell Signal Logic
Signals trigger when:
Bullish Probability crosses above the user threshold
Bearish Probability crosses below the opposite threshold
Session is active
No protected news event is occurring
This avoids noise, prevents over-signaling, and focuses only on high-confidence inflection points.
🎯Fully compatible with the indicator: ➡️ AI Probabilistic Orderflow scalper
Both indicators synchronize perfectly when used together:
Bayesian panel → trend probability
Scalper v1 → timing + TP/SL engine
Together they create a complete probability-driven revenue management system for scalping Future.
📘 How to Use
Add the indicator to your chart
Set your trading session (e.g., 09:30–16:00 EST)
Adjust weights depending on your style (Order Flow / Momentum / Value Area)
Watch the probability curve:
Above threshold → bullish bias
Below threshold → bearish bias
Take signals when the curve crosses thresholds, not when flat
Combine with "AI Probabilistic Orderflow scalper" indicator for execution timing
Avoid high-impact news using the News Filter
💎 Advantages
Professional-grade Bayesian model
Works in all volatility regimes
Noise-resistant and smoother than traditional oscillators
Integrates Order Flow + Auction Theory + Momentum + Volatility
Perfect for NQ scalpers seeking an AI-style probability dashboard
Reduces emotional decision-making
Compatible with any execution strategy
Optimized for high winrate scalping and sniper entries

Robrechtian Long-Medium Breakout Trend SystemRobrechtian Long–Medium-Term Breakout Trend System
A professional, rule-based trend-following strategy designed to capture large, sustained price movements using pure price action and breakouts.
This system follows long-established trend-following philosophy: no prediction, no volatility targeting, and no profit targets. Only disciplined entries, position additions, and exits driven entirely by trend structure.
Core Principles
Breakout-driven entries: Initial positions are taken only when price breaks above/below the 80-day Donchian channel, confirming a long–medium-term trend shift.
Short-term confirmation: Breakouts must also exceed the 20-day channel, reducing false positives.
Trend-direction filter: A 50-day moving average slope filter ensures alignment with the broader trend.
Explosive bar filter: Entries avoid excessively large, single-candle expansions (>2.5× ATR(20)) to prevent chasing exhaustion spikes.
Pyramiding into strength: Additional units are added only when price makes fresh 20-day breakouts in the direction of the trend. No scaling out. No adding on dips.
Exit only on trend violation: Positions are closed exclusively when price breaks the opposite 80-day channel. This preserves unlimited upside while enforcing disciplined exits.
Pure trend philosophy: No volatility targeting, no smoothing, no discretionary overrides, no optimization for short-term performance.
Intended Use
This system is designed primarily for diversified futures portfolios, where diversification across dozens of globally liquid markets creates robustness and stability. However, it may also be used on individual assets for educational and analytical purposes.
The system embraces the core trend-following logic:
Small losses, big winners, and unlimited upside when trends persist.
⚠️ WARNINGS / DISCLAIMERS
⚠️ Warning 1 — This strategy is not optimized for single stocks
The Robrechtian Trend System is designed for multi-asset futures portfolios, not single equities.
Performance on individual tickers may vary greatly due to lack of diversification.
⚠️ Warning 2 — Trend following includes substantial drawdowns
Deep drawdowns are a normal and expected feature of all long-term trend-following systems.
The strategy does not attempt to smooth returns or manage volatility.
If you seek steady, low-volatility equity curves, this system is not suitable.
⚠️ Warning 3 — No volatility targeting or risk smoothing
This system intentionally avoids volatility-based position sizing.
Trades may experience larger fluctuations than systems using risk parity or vol targeting.
⚠️ Warning 4 — Not financial advice
This script is for educational and research purposes only.
Past performance does not guarantee future results.
Use at your own risk.
⚠️ Warning 5 — TradingView backtests have known limitations
TradingView does not simulate:
futures contract roll logic
slippage
real bid/ask spreads
liquidity conditions
limit-up/limit-down behavior
Results may vary from live market execution.

FX COT (TT314)Part of FX Dashboard, based on @lord_fed document:
www.lordfed.co.uk
CFTC Commitment of Traders - large speculators view by default.

Futures Position Size Calculator (NQ/ES)DISCLAIMER:
This indicator is provided solely for informational and educational purposes. It calculates position sizing based on user-defined inputs such as entry and stop-loss levels, but it does not provide trading signals, recommendations, or financial advice . All trading decisions are made at the sole discretion of the user.
By using this indicator, you acknowledge that you are fully responsible for your own trades and risk management . The developer/publisher of this indicator assumes no liability for any losses, damages, or financial consequences that may arise from its use.
Features:
• Position size calculator (based on Entry & Stop Loss)
• Reward ratio calculator (1R, 2R, 3R, etc.)
• Supports: NQ / MNQ / ES / MES
Usage:
When you first add the script to your chart (on any supported futures symbol), you will be prompted to set the Entry Price and Stop Loss Price on the chart using draggable lines .
After setup, you can freely move the price lines, and the indicator will automatically update:
• Position size
• Reward targets
• Direction (long/short is auto-detected)
RISK Settings:
You can calculate position size using either:
1. Account Percent
Select "Percent" in the Risk Method dropdown and enter the percent of your account you want to risk per trade.
2. Fixed Dollar Amount
Select "Fixed Dollar" in the Risk Method dropdown and enter the dollar amount you want to risk.
You may set separate values for: NQ, MNQ, ES, and MES.
Reward Calculator:
Enable the checkbox "Show Reward Targets" in the Reward Ratio section to display projected targets (1R, 2R, etc.).
You can also choose how many R-levels are displayed on the chart.

Position Sizing Calculator (Real-Time) - Futures Edition█ SUMMARY
The following indicator is a Position Sizing Calculator based on Average True Range (ATR), originally developed by market technician J. Welles Wilder Jr., intended for real-time trading.
This script utilizes the user's account size, acceptable risk percentage, and a stop-loss distance based on ATR to dynamically calculate the appropriate position size for each trade in real time.
█ BACKGROUND
Developed for use on the Micro E-mini Nasdaq-100 futures (MNQ), this script provides traders with continuously updated dynamic position sizes. It enables traders to instantly determine the exact number of contracts to use when entering a trade while staying within their acceptable risk tolerance.
This real-time position sizing tool helps traders make well-informed decisions when planning trade entries and calculating maximum stop-loss levels, ultimately enhancing risk management.
█ USER INPUTS
Trading Account Size: Total dollar value of the user's trading account.
Acceptable Risk (%): Maximum percentage of the trading account that the user is willing to risk per trade.
ATR Multiplier for Stop-Loss: Multiplier used to determine the distance of the stop-loss from the current price, based on the ATR value.
ATR Length: The length of the lookback period used to calculate the ATR value.
Show Target Risk Row: Toggle to hide/show the Target Risk Row
SL Levels Display: Option to see Both, Long Only, Short Only, or None of the Stop Loss Level Values.
Contract Point Value ($): Point value per contract. Tooltip highlights common values.
Tick Size: Minimum Price Movement (Default set to 0.25)
Minimum Contracts: Override the Minimum Contracts per trade to a user selected value.
(May Exceed User's Target Risk)

Auto Position CalculatorA position sizing tool that automatically detects the instrument you're trading and calculates the correct position size based on your risk parameters.
What It Does
This indicator calculates how many contracts, lots, or shares to trade based on your account size, risk percentage, and stop loss distance. It auto-detects the instrument type and adjusts the point/pip value accordingly.
Supported Instruments
Futures: NQ, MNQ, ES, MES, YM, MYM, RTY, M2K, CL, MCL, GC, MGC
Forex: All major pairs (USD, EUR, GBP, JPY, etc.)
Index CFDs: NAS100, US500, US30, GER40, UK100
Metals: XAU, XAG
Crypto and Stocks: Automatic detection
How to Use
Set your account size and risk % in settings
Click the settings icon and place Entry, Stop Loss, and Take Profit on the chart
The position size and risk calculations appear automatically
Levels auto-reset at your chosen session (Asia, London, or New York open)
Limitations
CFD and forex pip values assume standard lot sizing - your broker may differ
Auto-detection relies on ticker naming conventions, which vary by broker/data feed
Session reset times are based on ET (Eastern Time)
