Forex Currency Strength What this indicator does
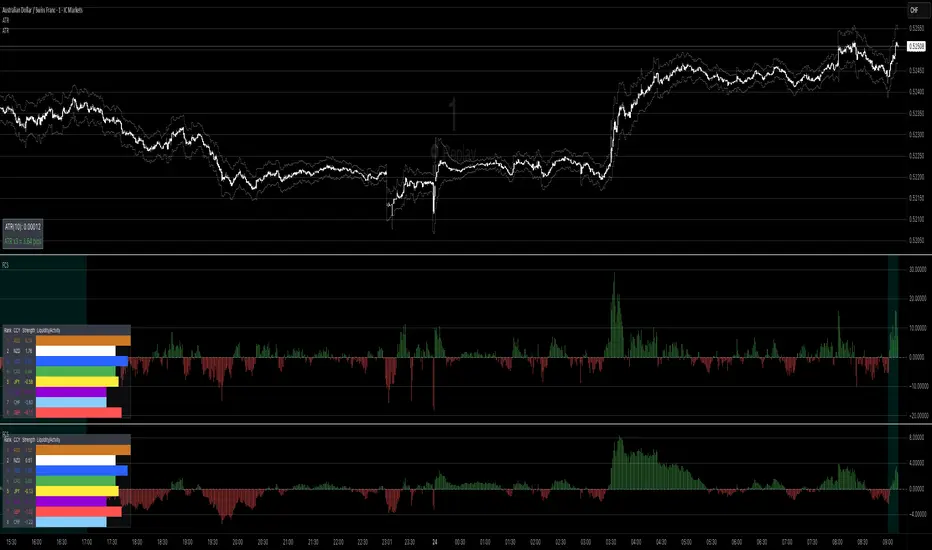
It compares the relative strength of the 8 major currencies (USD, EUR, GBP, JPY, AUD, CAD, NZD, CHF) by looking at all 28 currency pairs. Each currency is smoothed (averaged) with a moving average to reduce noise.
From this it shows:
• Currency strength lines → how each major currency is performing over time (optional view).
• Pair divergence histogram → the difference in strength between the two currencies of the chart pair (e.g. EUR vs USD on an EURUSD chart). Green means the base currency is stronger, red means the quote currency is stronger.
• Ranking table → shows the strongest to weakest currency at the current moment. The strongest is highlighted green, the weakest red.
• Session highlighting → shows your chosen trading session on the chart (background shading, optional vertical line at the session start).
• Alerts → you can set TradingView alerts when:
• the pair divergence crosses above or below zero
• the divergence strength gets big enough (above your threshold)
• the difference between the strongest and weakest currency becomes large
⸻
👉 In plain words:
This indicator helps you quickly see which currencies are strong, which are weak, and whether the pair you are trading has a clear directional bias. It also highlights trading sessions and can notify you when strong moves or imbalances appear.
// ─────────────────────────────────────────────────────────────
// Forex Currency Strength (8 Majors, %R) + Divergence + Ranking
// ─────────────────────────────────────────────────────────────
//
// === Inputs ===
//
// exchPrefix → Broker/feed prefix (e.g. "OANDA:", "FX:", or "" for ICMarkets)
// tf → Data timeframe (empty = chart timeframe)
// smoothLen → Smoothing length (MA) for currency strength (default = 14)
// smoothMethod → MA method (SMA, EMA, WMA, DEMA)
// viewMode → Display mode: "Strength Lines", "Pair Divergence", "Both"
// (Tip: set to "Pair Divergence" to hide lines by default)
// barsLimit → Number of bars to display
//
// sessionStr → Trading session time (e.g. "0800-1700"); session is highlighted on chart
//
// alertDivAbs → Threshold for alerts on |divergence|
// alertGapTF → Threshold for alerts on Top–Flop ranking gap
//
// scaleK → Scaling factor (here ×1000)
//
// rankPos → Position of the ranking table (top/bottom left/right)
// rankTextSize → Font size for the ranking table (tiny, small, normal, large, huge)
//
// === Outputs ===
//
// • 8 currency strength lines (optionally visible)
// • Divergence (current pair) as histogram
// • Ranking table (top & flop highlighted)
// • Session highlighting (background color + optional vertical line)
// • Alerts on divergence crosses, |divergence| thresholds & top–flop gaps
//
// === Alert Conditions ===
//
// longDivCross → Divergence (current pair) crosses above 0
// shortDivCross → Divergence (current pair) crosses below 0
// divAbsUp → |Divergence| exceeds alertDivAbs threshold
// gapUp → Top–Flop ranking gap exceeds alertGapTF threshold
//
// ─────────────────────────────────────────────────────────────
Fxsignals
DT_Sessions TOPDT_Sessions TOP - Powerful Trading Sessions and Key Levels Indicator
Description
DT_Sessions is a versatile TradingView indicator that displays major trading sessions and important price levels on your chart. It's ideal for traders working in forex, cryptocurrency, and stock markets, helping to visualize critical market information directly on the chart.
Key Features:
Visualization of major trading sessions: Asian, Frankfurt, London, New York (AM and PM)
Previous day high and low (PDH/PDL) tracking
Display of key psychological levels for major trading instruments
Customizable colors and styles for all indicator elements
Flexible timezone management for accurate session synchronization
Benefits of Use
Enhanced market analysis: Understanding the activity of different trading sessions helps better interpret price movements
Trading time optimization: Visual display of the most volatile market periods
Key resistance and support levels: Automatic display of psychologically significant price levels
Daily extreme monitoring: PDH/PDL help in determining the trading range
Supported Instruments
The indicator automatically recognizes popular instruments, including:
Forex pairs (EUR/USD, GBP/USD, USD/JPY)
Cryptocurrencies (Bitcoin, Ethereum)
Stock indices (DAX, NASDAQ, S&P 500, EuroStoxx50)
Precious metals (XAU/USD)
How to Use
Add the indicator to your favorite asset's chart
Observe the trading session ranges highlighted in different colors
Use PDH/PDL lines to identify significant daily levels
Pay attention to key psychological levels for your instrument
Advanced Settings
The indicator offers numerous settings for each session:
Enable/disable individual sessions
Adjust start and end times for each session
Change colors and transparency
Configure PDH/PDL display
Manage timezones and UTC offset
Effective For
Scalpers and day traders
Long-term investors tracking key levels
Algorithmic traders needing session data visualization
Beginners studying the impact of trading sessions on market activity
DT_Sessions is an essential tool for traders of all levels, providing valuable information about market dynamics and key levels directly on your TradingView chart.

Zaree - FX Index RSI IndicatorDescription:
The "Zaree - FX Index RSI Indicator" (FIRI) is a technical analysis tool designed to provide insights into the relative strength of two selected currency indices using the Relative Strength Index (RSI). It allows traders to compare the RSI values of a primary currency index and a secondary currency index, helping them identify potential overbought and oversold conditions in the currency market.
Details of the Indicator:
The indicator calculates the RSI for both the primary and secondary currency indices based on the user's selections.
Traders can choose from a variety of currency indices to use as the primary and secondary indices for comparison.
The indicator offers settings for customizing the calculation of the RSI, including selecting the type of moving average (SMA, EMA, WMA, SMMA) and adjusting the length of the RSI and moving average.
Upper and lower RSI bands are displayed on the chart to highlight potential overbought and oversold conditions.
The RSI values and their corresponding moving average values are plotted on the chart, allowing traders to visually analyze the relative strength of the indices.
How to Use the Indicator:
Select the primary and secondary currency indices you want to compare from the provided dropdown menus. These indices will serve as the basis for RSI calculation.
Choose the type of moving average (SMA, EMA, WMA, SMMA) to use for RSI calculation and set the desired length for the moving average.
Decide whether you want to visualize the RSI and moving average values for the primary and secondary indices on the chart.
Observe the RSI values and moving averages plotted on the chart. The indicator's upper and lower bands can help you identify potential overbought (above the upper band) and oversold (below the lower band) conditions.
Pay attention to the intersections between the RSI values and the moving average lines. These intersections can provide insights into potential trend changes or reversals in the currency market.
Example of Usage:
Let's say you're a swing trader focusing on currency pairs involving the US Dollar (USD) and Euro (EUR). You want to compare the relative strength of the USD Index (USDINX) and the EUR Index (EURINX) to identify potential trading opportunities. Here's how you can use the FIRI indicator:
Select "USDINX" as the primary index and "EURINX" as the secondary index.
Choose "SMA" as the moving average type and set the RSI length to 14.
Enable the visualization of RSI values for both the primary and secondary indices.
Observe the chart to identify instances where the RSI values of the indices cross above the upper band (potential overbought) or below the lower band (potential oversold).
Look for intersections between the RSI values and the moving average lines. A bullish signal may occur when the RSI crosses above the moving average, indicating potential upward momentum, while a bearish signal may occur when the RSI crosses below the moving average, indicating potential downward momentum.
Remember that the FIRI indicator is a tool to assist you in your analysis. It's important to consider other technical and fundamental factors before making trading decisions.
Feel free to adjust the settings of the indicator based on your trading preferences and strategy. Keep in mind that no indicator is foolproof, and it's recommended to use the FIRI indicator in conjunction with other analysis techniques for a comprehensive trading approach.

Zaree - FX Index Spread IndicatorDescription:
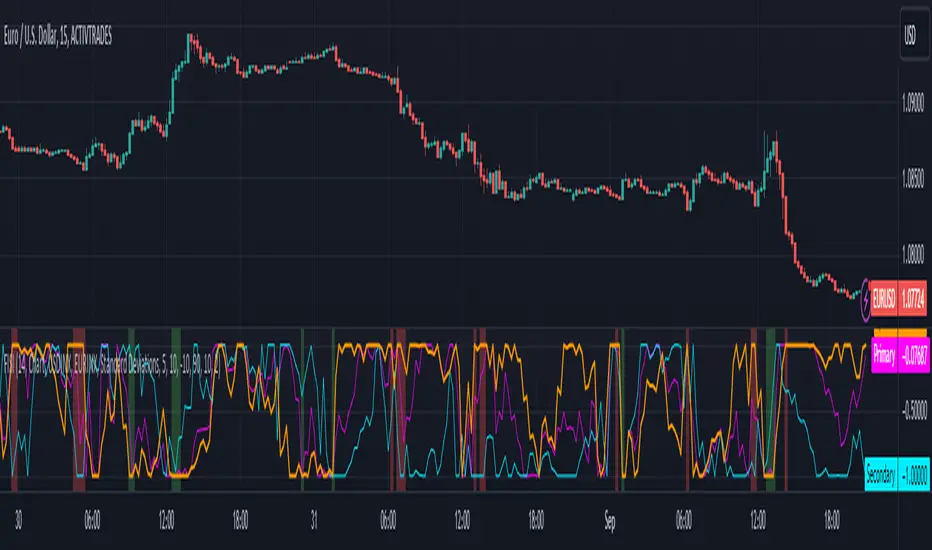
The "Zaree - FX Index Spread Indicator" (FISI) is a powerful technical analysis tool designed to provide insights into the spread between two selected currency indices. By calculating and visualizing the percentage difference between the values of a primary and a secondary currency index, traders can gain valuable information about potential market dynamics and trends.
Details of the Indicator:
The indicator calculates the spread percentage between a primary and a secondary currency index, allowing traders to understand the relative strength of the two indices.
Traders can choose from a list of currency indices to use as the primary and secondary indices for comparison.
The indicator offers multiple methods for setting thresholds to identify potential trading opportunities, including standard deviations, percentile ranks, historical highs and lows, and fixed thresholds.
Users can customize the length of the calculation period and choose whether to display the primary index, secondary index, and the spread percentage on the chart.
Shaded areas on the chart indicate regions where the spread percentage is above or below predefined thresholds, helping traders identify potential trading signals.
How to Use the Indicator:
Select the primary and secondary currency indices you want to compare from the provided dropdown menus. These indices will be used to calculate the spread percentage.
Choose the method for setting thresholds by selecting one of the options: "Standard Deviations," "Percentile Ranks," "Historical Highs and Lows," or "Fixed Thresholds."
Depending on the selected method, configure the relevant threshold parameters, such as historical threshold percentage, upper and lower fixed thresholds, upper and lower percentile thresholds, or the standard deviation multiplier.
Choose whether to visualize the primary index, secondary index, and spread percentage on the chart by enabling the respective options.
Observe the chart to identify potential trading signals based on the interactions between the spread percentage and the predefined thresholds.
Example of Usage:
Suppose you're interested in trading currency pairs involving the US Dollar (USD) and Euro (EUR), and you want to monitor the spread between the USD Index (USDINX) and the EUR Index (EURINX). Here's how you can use the FISI indicator:
Select "USDINX" as the primary index and "EURINX" as the secondary index.
Choose the method for setting thresholds based on your strategy. For instance, you can select "Standard Deviations" and adjust the standard deviation multiplier.
Enable the visualization of the primary index, secondary index, and spread percentage on the chart.
Observe the shaded areas on the chart. If the spread percentage crosses above the upper threshold, it may indicate a potential market overextension. Conversely, if the spread percentage crosses below the lower threshold, it could suggest an oversold market condition.
Look for instances where the spread percentage approaches or crosses the predefined thresholds. Consider these instances as potential entry or exit points for your trades.
Remember that the FISI indicator is a tool to assist you in your analysis. It's recommended to combine its insights with other technical and fundamental factors before making trading decisions. Adjust the indicator settings and thresholds based on your trading strategy and preferences.
As with any trading tool, practice and observation are key. Over time, you can refine your trading strategy by analyzing historical data and observing how the indicator performs in different market conditions.
Feel free to experiment with different settings and methods to find the configuration that aligns best with your trading style and goals.
BEST Algorithm Builder FOREXHello traders 👋
I. 💎 SCRIPTS ACCESS AND TRIALS 💎
1. Every trial request access has to be done through my website.
2. My website URL is in this script signature at the very bottom (you'll have to scroll down a bit and going past the long description) and in my profile status available here: Daveatt
3. Many video tutorials explaining clearly how all our indicators work are available on our website > guides section and also on Discord + Youtube
4. You may also contact me directly for more information regarding the trading method included in the indicator or how to access it
II. Forewords
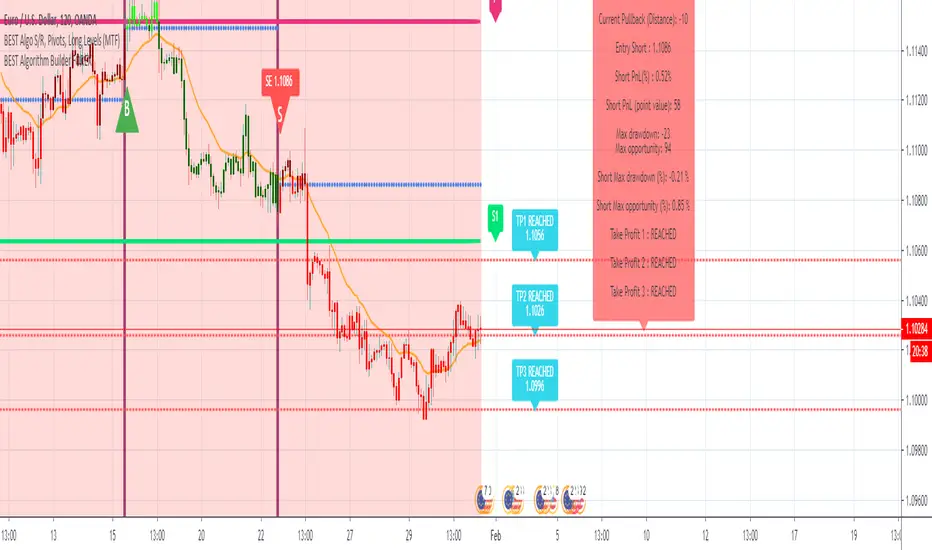
This indicator is for the Intraday FOREX traders looking for fixed entries based on our proprietary trading method.
We've been working on it for months and releasing now for our subscribers.
We designed this framework for FOREX major/minor/exotic pairs.
III. Optimized system for lowering risk/capturing most of the opportunities
We worked hard on reducing the risk as much as we could.
The built-in hard-exit (also called invalidation) system does a huge job in exiting a position way before a Stop Loss will get hit
EUR/USD
USD/CAD
IV. Trade Manager and compatible with dynamic alerts
It includes :
- our proprietary method with fixed entries
- a hard exit system (built-in stop-loss)
- multiple options for user-defined stop-loss/take-profit settings (price value, distance in pips, percentage, trailing, ...)
- 🔔 Compatible with dynamic alerts 🔔
Dynamic alerts are bringing automated trading to a whole new level. The third-party solutions capturing TradingView alerts are able to use them.
- Algorithmic Supports and Resistances used as safeguards and take profit zones
Final words
We made it as simple as we could (to be honest it's a very simple system for the end-user) - even with several hundreds of calculations in the indicator.
Please hit me up for any questions/feedbacks/comments
Become the BEST trader you deserve to be
Dave