IFVGs [NINE]Overview
The IFVG Indicator is a precision-engineered tool designed to identify and display Inversion Fair Value Gaps (IFVGs), a powerful price action concept rooted in ICT (Inner Circle Trader) methodology. This indicator automatically detects when price closes through an existing Fair Value Gap, causing the zone to "invert" and flip its directional bias, signaling potential areas of institutional interest for future price reactions.
What is an Inversion Fair Value Gap?
A Fair Value Gap (FVG) is a three-candle pattern where a gap exists between the wicks of the first and third candles, representing an imbalance in price delivery. These zones often act as magnets for price to return and "fill" the inefficiency.
An Inversion Fair Value Gap (IFVG) occurs when price doesn't just tap into an FVG, it closes through it with a candle body. This "inversion" transforms the zone:
A Bullish FVG that gets closed through becomes a Bearish IFVG (potential resistance/supply zone)
A Bearish FVG that gets closed through becomes a Bullish IFVG (potential support/demand zone)
IFVGs represent areas where the market has shown its hand — institutional order flow has aggressively moved through a prior inefficiency, and the inverted zone now becomes a point of interest for potential reversals or continuations.
Key Features
Automatic IFVG Detection
The indicator continuously monitors for Fair Value Gaps and automatically converts them to IFVGs when price body closes through the zone. No manual identification required.
Multiple Display Styles
Choose from four distinct visualization modes to match your chart aesthetic:
Level — Clean, minimal single line at the IFVG extreme (top for bullish, bottom for bearish)
Normal — Filled zone with dashed borders and dot label
Minimalist — High/low boundary lines with connecting link
Classic — Filled box with 50% midline only
Full Customization
Independent colors for bullish and bearish IFVGs
Adjustable transparency for zone fills
Optional 50% midline (Consequent Encroachment level)
Flexible label styles: "IFVG" or "+/−" notation
Multiple label sizes: Tiny, Small, Normal, Large
Smart Extension Options
Extend to Current Bar — Zones dynamically extend as price progresses
Extend to Confirmation — Zones end at the bar where inversion occurred
Manual Offset — Fine-tune extension length in bars
Clustered IFVG Filter
Prevents chart clutter by ensuring only one IFVG per direction forms within a 5-bar cooldown period. When a single candle closes through multiple FVGs, only the first IFVG of that directional series is displayed — eliminating redundant signals and keeping your chart clean.
FVG Lookback Control
Limit which FVGs can become IFVGs based on their age. Options include 10, 50, 100, 200, or 300 bars. This filters out old, stale FVGs that may create less relevant inversions.
Session Time Filters
Optional time-based filtering allows you to focus on specific trading sessions:
Configurable session windows (e.g., 9:30 AM - 12:00 PM)
Support for two independent session filters
Multiple timezone options including New York, London, Tokyo, and more
Volume Imbalance Detection
Optionally include Volume Imbalances (VIs) — gaps between candle bodies rather than wicks — expanding the scope of detectable inefficiencies.
Invalidation Tracking
IFVGs are automatically invalidated when price closes back through the zone in the opposite direction, with optional display of invalidated zones.
How to Use
Entry Confirmation
IFVGs serve as areas for trade entries. When price returns to a confirmed IFVG:
Bullish IFVG — Look for long entries as price taps the zone from above
Bearish IFVG — Look for short entries as price taps the zone from below
Settings Reference
Inversion Fair Value Gaps
Show IFVGs? — Master toggle for IFVG display
Style — Level, Normal, Minimalist, or Classic
Transparency % — Zone fill opacity (0-100)
Historical Display — Maximum IFVGs to show per direction
Bullish/Bearish Colors — Independent color selection
Show Invalidated? — Display IFVGs that have been invalidated
Extend IFVGs? — Enable dynamic zone extension
Extension Mode — Current Bar or Confirmation
Manual Offset — Additional bars to extend
High/Low Lines — Show boundary lines (Minimalist style)
50% Midline — Show Consequent Encroachment level
Show Labels? — Display zone labels
Label Style — IFVG or +/− notation
FVG Lookback — Maximum age of FVGs that can invert
Clustered Filter — Prevent multiple same-direction IFVGs in quick succession
Volume Imbalances — Include body gaps in detection
Session Filters
Enable 1st/2nd Time Filter — Activate session filtering
Session Times — Define active trading windows
Timezone — Reference timezone for session calculations
Disclaimer
This indicator is provided for educational and informational purposes only. It is not financial advice, and nothing contained herein constitutes a recommendation, solicitation, or offer to buy or sell any securities, options, or other financial instruments.
Trading involves substantial risk of loss and is not suitable for all investors. Past performance is not indicative of future results. You should carefully consider your investment objectives, level of experience, and risk appetite before making any trading decisions.
The developer of this indicator makes no representations or warranties regarding the accuracy, completeness, or reliability of the information provided. You are solely responsible for your own trading decisions and any profits or losses that may result.
Always conduct your own research and consider seeking advice from a licensed financial professional before trading.
Ictconcepts

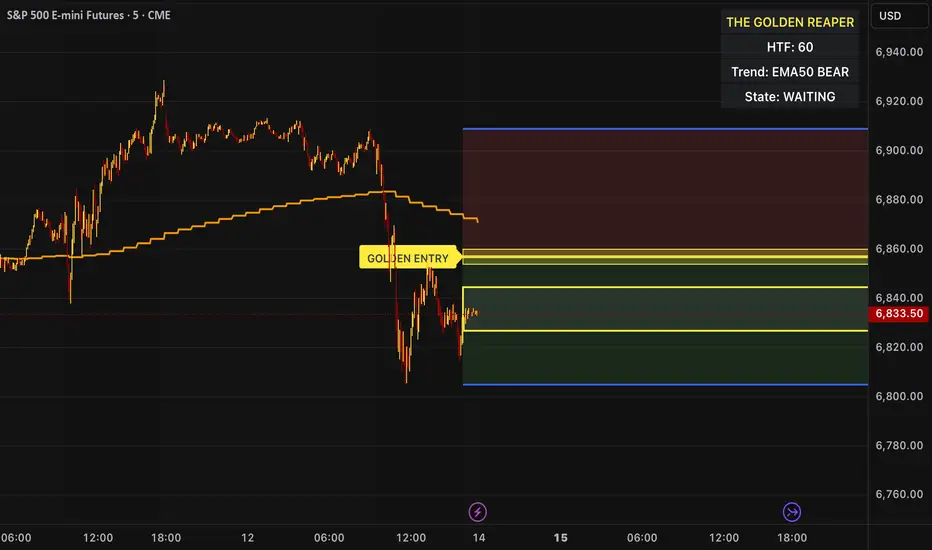
The Golden Reaper 🟡 THE GOLDEN REAPER
HTF OTE + EMA50 — Futures Scalping Framework
The Golden Reaper is a high-timeframe execution framework designed specifically for futures scalpers who trade with precision, patience, and structure.
This indicator focuses on HTF market structure, Optimal Trade Entry (OTE) zones, and equilibrium (50%) reclaim confirmation to identify high-probability execution areas for fast, controlled scalps.
It is not a signal spam tool.
It is a framework built for disciplined traders who wait for price to come to them.
⸻
🔑 Designed For
✔ Futures markets (ES, NQ, MNQ, MES, GC, MGC, CL, etc.)
✔ Scalpers & intraday traders
✔ 1H structure → 5m / 1m execution
✔ Traders who prefer few high-quality setups
⸻
🧠 Core Logic (How It Works)
1️⃣ High-Timeframe Structure (HTF)
The indicator identifies the most recent HTF swing high and low to define the active trading leg.
2️⃣ OTE Zone (Premium / Discount)
Price is expected to react within the OTE zone where liquidity is commonly targeted.
3️⃣ Golden Entry (EQ 50%)
The 50% equilibrium level is marked as the Golden Entry.
Price must reclaim this level for a setup to become valid.
4️⃣ Golden Execution Zone
After reclaim, a golden execution zone appears to define where entries are allowed.
5️⃣ EMA 50 Trend Filter
Trades are taken only in the direction of the HTF EMA 50 to avoid counter-trend scalps.
⸻
⚡ How Futures Scalpers Use It
Recommended Timeframes
• HTF Structure: 1 Hour
• Execution: 5 Minute / 1 Minute
Process
• Wait for price to reach the OTE zone
• Allow the setup to arm
• Enter only after price reclaims the Golden Entry
• Execute within the Golden Execution Zone
• Manage stops and targets manually
This approach helps scalpers:
✔ Avoid chasing price
✔ Reduce over-trading
✔ Improve entry precision
✔ Maintain consistency
⸻
🔔 Alerts Included
• OTE Touched – Setup is armed
• C-Reclaim Confirmed – Entry condition met
(Alerts are designed to assist — not replace — trader judgment.)
⸻
⚠️ Important Notes
• Designed for futures markets only
• Best used with price action confirmation
• No built-in stop loss or take profit (manual risk management required)
• Not financial advice
⸻
🧬 Who This Indicator Is For
✔ Futures scalpers
✔ ICT / Smart Money traders
✔ Structure-based traders
✔ Traders who value patience over frequency
❌ Not for:
• Signal chasers
• Indicator stacking
• Automated trading
• Beginners who want instant entries
⸻
🟡 Created By
ChartReaper / Tactiko
Instagram:
@officialchartreaper
@tactiko
SMT (ICT Concepts)Overview
Smart Money Technique (SMT) Divergence is a price action analysis method derived from Inner Circle Trader (ICT) methodology. This indicator automatically detects SMT divergences by comparing price movements across correlated financial instruments, identifying moments when assets that typically move together begin to diverge - a phenomenon often associated with potential price reversals.
An SMT divergence occurs when one instrument makes a new swing high or low while a correlated instrument fails to confirm that move. This failure to confirm suggests that the instrument may be positioning for a reversal, as the divergence indicates a lack of conviction in the current price direction across related markets.
Theoretical Foundation
What is SMT Divergence?
In correlated markets, instruments tend to move in tandem. For example, the E-mini S&P 500 (ES) and E-mini Nasdaq 100 (NQ) futures typically make swing highs and lows together due to their shared exposure to U.S. equity markets. When this correlation breaks down at key swing points, it creates an SMT divergence.
Bullish SMT Divergence:
The chart instrument creates a lower low compared to a previous swing low, while the correlated comparison instrument creates a higher low (or fails to make a lower low). This divergence at the lows suggests potential buying pressure and a possible bullish reversal.
Bearish SMT Divergence:
The chart instrument creates a higher high compared to a previous swing high, while the correlated comparison instrument creates a lower high (or fails to make a higher high). This divergence at the highs suggests potential selling pressure and a possible bearish reversal.
Why SMT Divergences Matter
SMT divergences are considered significant because they may indicate:
Accumulation or distribution occurring in one instrument but not the other
Relative strength or weakness between correlated assets
Potential exhaustion of the current trend
Early warning signs before major reversals
Indicator Features
Multi-Timeframe SMT Detection
This indicator provides simultaneous SMT detection on two timeframes:
Current Timeframe (CTF) Detection:
The indicator scans for SMT divergences on the chart's active timeframe using multiple pivot lookback periods (3, 5, 8, 13, 21, and 34 bars). This multi-period approach ensures detection of both short-term and intermediate swing points, reducing the likelihood of missing valid divergences while filtering out noise.
Higher Timeframe (HTF) Detection:
Simultaneously, the indicator monitors a higher timeframe for SMT divergences using pivot periods of 3, 5, 8, 13, and 21 HTF candles. Higher timeframe signals generally carry more significance as they represent larger market structure.
Automatic Timeframe Pairing:
When enabled, the indicator automatically selects an appropriate higher timeframe based on your chart's current timeframe:
Sub-1 minute charts pair with 5-minute
1-2 minute charts pair with 15-minute
3-4 minute charts pair with 30-minute
5 minute charts pair with 1-hour
6-9 minute charts pair with 1-hour
15 minute charts pair with 4-hour
16-59 minute charts pair with Daily
1-4 hour charts pair with Weekly
Daily charts pair with Monthly
Combined Signal Detection:
When an SMT divergence is detected on both the current timeframe and higher timeframe at the same price pivots, the indicator combines these into a single enhanced signal. Combined signals display both timeframes in the label and use the higher timeframe styling to emphasize their increased significance.
Automatic Symbol Correlation
The indicator includes comprehensive automatic symbol selection based on the instrument you are viewing. When Auto SMT is enabled, the indicator intelligently selects correlated comparison symbols.
Index Futures Correlations:
E-mini Contracts:
NQ (Nasdaq 100) compares with ES (S&P 500) and YM (Dow Jones)
ES (S&P 500) compares with NQ (Nasdaq 100) and YM (Dow Jones)
YM (Dow Jones) compares with NQ (Nasdaq 100) and ES (S&P 500)
RTY (Russell 2000) compares with ES (S&P 500) and NQ (Nasdaq 100)
Micro Contracts:
MNQ (Micro Nasdaq) compares with MES (Micro S&P) and MYM (Micro Dow)
MES (Micro S&P) compares with MNQ (Micro Nasdaq) and MYM (Micro Dow)
MYM (Micro Dow) compares with MNQ (Micro Nasdaq) and MES (Micro S&P)
M2K (Micro Russell) compares with MES (Micro S&P) and MNQ (Micro Nasdaq)
Metals Futures Correlations:
Standard Contracts:
GC (Gold) compares with SI (Silver) and PL (Platinum)
SI (Silver) compares with GC (Gold) and PL (Platinum)
PL (Platinum) compares with GC (Gold) and SI (Silver)
Micro Contracts:
MGC (Micro Gold) compares with SIL (Micro Silver) and PL (Platinum)
SIL (Micro Silver) compares with MGC (Micro Gold) and PL (Platinum)
Energy Futures Correlations:
CL (Crude Oil) compares with RB (RBOB Gasoline) and NG (Natural Gas)
RB (RBOB Gasoline) compares with CL (Crude Oil) and NG (Natural Gas)
NG (Natural Gas) compares with CL (Crude Oil) and RB (RBOB Gasoline)
MCL (Micro Crude) compares with RB (RBOB Gasoline) and NG (Natural Gas)
Major ETF Correlations:
SPY (S&P 500 ETF) compares with QQQ, DIA, and IWM
QQQ (Nasdaq 100 ETF) compares with SPY, DIA, and IWM
DIA (Dow Jones ETF) compares with SPY, QQQ, and IWM
IWM (Russell 2000 ETF) compares with SPY, QQQ, and DIA
Stock Sector Mapping:
When viewing individual stocks, the indicator automatically identifies the stock's sector and selects appropriate sector ETFs for comparison:
Technology Sector (AAPL, MSFT, GOOGL, NVDA, AMD, INTC, etc.):
Primary: QQQ (Nasdaq 100 ETF)
Secondary: XLK (Technology Select Sector SPDR)
Tertiary: SPY (S&P 500 ETF)
Financial Sector (JPM, BAC, GS, MS, WFC, etc.):
Primary: XLF (Financial Select Sector SPDR)
Secondary: KBE (SPDR S&P Bank ETF)
Tertiary: SPY (S&P 500 ETF)
Energy Sector (XOM, CVX, COP, SLB, etc.):
Primary: XLE (Energy Select Sector SPDR)
Secondary: USO (United States Oil Fund)
Tertiary: SPY (S&P 500 ETF)
Healthcare Sector (JNJ, UNH, PFE, MRK, LLY, etc.):
Primary: XLV (Health Care Select Sector SPDR)
Secondary: IBB (iShares Biotechnology ETF)
Tertiary: SPY (S&P 500 ETF)
Consumer Discretionary Sector (TSLA, HD, NKE, MCD, etc.):
Primary: XLY (Consumer Discretionary Select Sector SPDR)
Secondary: SPY (S&P 500 ETF)
Tertiary: QQQ (Nasdaq 100 ETF)
Consumer Staples Sector (PG, KO, PEP, WMT, COST, etc.):
Primary: XLP (Consumer Staples Select Sector SPDR)
Secondary: SPY (S&P 500 ETF)
Tertiary: QQQ (Nasdaq 100 ETF)
Industrial Sector (CAT, BA, HON, UPS, etc.):
Primary: XLI (Industrial Select Sector SPDR)
Secondary: SPY (S&P 500 ETF)
Tertiary: QQQ (Nasdaq 100 ETF)
Materials Sector (LIN, APD, SHW, FCX, NEM, etc.):
Primary: XLB (Materials Select Sector SPDR)
Secondary: GLD (SPDR Gold Shares)
Tertiary: SPY (S&P 500 ETF)
Utilities Sector (NEE, DUK, SO, etc.):
Primary: XLU (Utilities Select Sector SPDR)
Secondary: SPY (S&P 500 ETF)
Tertiary: QQQ (Nasdaq 100 ETF)
Real Estate Sector (AMT, PLD, CCI, etc.):
Primary: XLRE (Real Estate Select Sector SPDR)
Secondary: VNQ (Vanguard Real Estate ETF)
Tertiary: SPY (S&P 500 ETF)
Communication Services Sector (NFLX, DIS, CMCSA, VZ, T, etc.):
Primary: XLC (Communication Services Select Sector SPDR)
Secondary: SPY (S&P 500 ETF)
Tertiary: QQQ (Nasdaq 100 ETF)
Forex Correlations:
EURUSD compares with GBPUSD
GBPUSD compares with EURUSD
Cryptocurrency Correlations:
BTCUSD compares with ETHUSD
ETHUSD compares with BTCUSD
Three-Symbol Comparison
The indicator supports comparison against up to three symbols simultaneously. When multiple comparison symbols show divergence at the same pivot point, all diverging symbols are displayed in the label, providing stronger confluence. For example, if NQ shows divergence with both ES and YM at the same swing high, the label will display "ES1! + YM1!" indicating divergence confirmation from multiple correlated instruments.
Invalidation Logic
SMT divergences are not indefinitely valid. The indicator includes automatic invalidation logic based on price action following the divergence signal.
Invalidation Rules:
Bearish SMT: Invalidates when price trades above the high of the confirmation pivot (right side of the divergence)
Bullish SMT: Invalidates when price trades below the low of the confirmation pivot (right side of the divergence)
The invalidation level is set at the confirmation bar (the second pivot that completes the SMT pattern), not the extreme of both pivots. This approach aligns with the concept that once price exceeds the confirmation point, the divergence setup is no longer valid.
Invalidation Display Options:
Users can choose to show or hide invalidated SMT signals separately for current timeframe and higher timeframe divergences. When shown, invalidated signals can be displayed with different line styles and widths to visually distinguish them from active signals. Separate limits prevent excessive invalidated signals from cluttering the chart (maximum 15 invalidated signals per timeframe type).
Input Settings
General Settings
Enable SMT Detection:
Master toggle to enable or disable all SMT divergence detection. When disabled, no SMT signals will be calculated or displayed.
Direction:
Filter which divergence types to display:
Both: Display both bullish and bearish SMT divergences
Bullish: Display only bullish SMT divergences (divergence at lows)
Bearish: Display only bearish SMT divergences (divergence at highs)
Symbol Settings
Enable Auto SMT:
When enabled, the indicator automatically selects correlated comparison symbols based on the chart instrument using the correlation mappings described above. When disabled, manual symbol inputs are used.
Symbol 1 (with enable toggle):
First comparison symbol. Enabled by default. When Auto SMT is disabled, enter the desired symbol manually.
Symbol 2 (with enable toggle):
Second comparison symbol. Enabled by default. When Auto SMT is disabled, enter the desired symbol manually.
Symbol 3 (with enable toggle):
Third comparison symbol. Disabled by default. Enable for additional confirmation from a third correlated instrument.
Current Timeframe SMT Settings
Show Current TF SMTs:
Toggle visibility of SMT divergences detected on the chart's current timeframe.
Bullish Color:
Color for bullish SMT divergence lines and labels on the current timeframe.
Bearish Color:
Color for bearish SMT divergence lines and labels on the current timeframe.
Line Style:
Style for current timeframe SMT lines (solid, dashed, or dotted).
Line Width:
Width of current timeframe SMT lines (1-4 pixels).
Show Labels:
Toggle visibility of labels on current timeframe SMT divergences.
Label Style:
Normal: Displays full information including timeframe and diverging symbol names
+/-: Displays minimal "+" or "-" characters with full information available in hover tooltip
Label Size:
Size of current timeframe SMT labels (Tiny, Small, Normal, or Large).
Show Invalidated:
Toggle visibility of invalidated current timeframe SMT signals.
Invalidated Line Style:
Line style for invalidated current timeframe SMT signals.
Invalidated Line Width:
Line width for invalidated current timeframe SMT signals.
Higher Timeframe SMT Settings
Show Higher TF SMTs:
Toggle visibility of SMT divergences detected on the higher timeframe.
Auto Timeframe:
When enabled, automatically selects an appropriate higher timeframe based on the chart's current timeframe. When disabled, uses the manually specified timeframe.
Manual Timeframe:
When Auto Timeframe is disabled, specify the higher timeframe to scan for SMT divergences.
Bullish Color:
Color for bullish SMT divergence lines and labels on the higher timeframe.
Bearish Color:
Color for bearish SMT divergence lines and labels on the higher timeframe.
Line Style:
Style for higher timeframe SMT lines (solid, dashed, or dotted).
Line Width:
Width of higher timeframe SMT lines (1-4 pixels).
Show Labels:
Toggle visibility of labels on higher timeframe SMT divergences.
Label Style:
Normal: Displays full information including timeframe and diverging symbol names
+/-: Displays minimal "+" or "-" characters with full information available in hover tooltip
Label Size:
Size of higher timeframe SMT labels (Tiny, Small, Normal, or Large).
Show Invalidated:
Toggle visibility of invalidated higher timeframe SMT signals.
Invalidated Line Style:
Line style for invalidated higher timeframe SMT signals.
Invalidated Line Width:
Line width for invalidated higher timeframe SMT signals.
Visual Representation
Line Display
SMT divergences are displayed as lines connecting the two pivot points that form the divergence:
For bearish SMT: A line connects the previous swing high to the current (higher) swing high
For bullish SMT: A line connects the previous swing low to the current (lower) swing low
The line color indicates the divergence type (bullish or bearish) and whether it was detected on the current timeframe or higher timeframe.
Label Display
Labels are positioned at the midpoint of the SMT line and display:
The timeframe on which the divergence was detected
The symbol(s) that showed divergence with the chart instrument
When using the "+/-" label style, labels show only "+" for bullish or "-" for bearish divergences, with full information accessible via hover tooltip.
All labels use monospace font formatting for consistent visual appearance.
Combined Signals
When the same divergence is detected on both current and higher timeframes, the signals are combined into a single display using higher timeframe styling. The label shows both timeframes (e.g., "M2 + M15") and all diverging symbols, indicating strong multi-timeframe confluence.
Practical Application Guidelines
Signal Interpretation
SMT divergences should be interpreted within the broader market context. Consider the following when evaluating signals:
Market Structure: SMT divergences occurring at key structural levels (previous highs/lows, order blocks, fair value gaps) tend to be more significant.
Timeframe Confluence: Signals appearing on multiple timeframes simultaneously suggest stronger institutional involvement.
Symbol Confluence: Divergences confirmed by multiple comparison symbols indicate broader market disagreement with the current price direction.
Time of Day: SMT divergences during high-volume trading sessions may carry more weight than those during low-liquidity periods.
Limitations and Considerations
Correlation Variability: Correlations between instruments can strengthen or weaken over time. The automatic symbol selection is based on typical correlations but may not always reflect current market conditions.
Pivot Detection Lag: Pivots are only confirmed after subsequent price action, meaning SMT signals appear with some delay after the actual swing point forms.
False Signals: Not all SMT divergences result in reversals. Use additional confirmation methods and proper risk management.
Data Requirements: The indicator requires sufficient historical data and may not function properly on instruments with limited price history.
Technical Notes
The indicator uses multiple pivot detection periods to identify swing points across different scales
Higher timeframe candle tracking is performed on the lower timeframe chart for precise pivot bar indexing
A deduplication system prevents the same divergence from being detected multiple times across different pivot periods
Array-based storage manages active and invalidated SMT signals with automatic cleanup to prevent memory issues
Maximum label and line counts are set to 500 each to accommodate extended analysis periods
Disclaimer
This indicator is provided for educational and informational purposes only. It is designed to assist traders in identifying potential SMT divergences based on historical price data and should not be considered as financial advice or a recommendation to buy or sell any financial instrument.
Trading financial markets involves substantial risk of loss and is not suitable for all investors. Past performance of any trading methodology, including concepts discussed in this indicator, does not guarantee future results. Users should conduct their own research and analysis before making any trading decisions.
The automatic symbol correlations and sector mappings are based on general market relationships and may not accurately reflect current or future correlations. Users are encouraged to verify correlations independently and adjust comparison symbols as needed.
Always use appropriate risk management techniques, including but not limited to position sizing and stop-loss orders. Never risk more capital than you can afford to lose.

ADAPTIVE ICT MULTI-ZONEAdaptive ICT Multi-Zone
Why Another ICT Script?
Most public ICT zone scripts flood your chart with dozens of noisy, overlapping boxes that never get cleaned up, use fixed lookbacks that work on one asset and fail on another, and mark every tiny gap as “FVG” — turning the chart into a rainbow mess that’s impossible to trade.
ADAPTIVE ICT MULTI-ZONE is built differently:
Only the strongest, most recent zones pass the adaptive filter (default 3 bullish OB + 3 bearish OB + 3 FVG). No more chart clutter.
Fair Value Gaps are filtered by ATR (default ≥ 0.7 × ATR) and optional high-volume confirmation so you only see gaps that actually matter.
Order Blocks are true swing-based (pivot high/low).
Every zone automatically extends far to the right until price closes through it — you never miss a mitigation.
Zero repainting. Zero lag. Zero memory leaks. Runs perfectly on every time frame.
In short: while many ICT scripts are noisy toys, this one is a surgical tool that shows exactly what institutional desks are up to.
How to Trade It Best (Simple & Effective)
Wait for price to return to a freshly drawn zone (watch the newest ones — they have the highest probability).
Look for confluence:
Price inside a Bullish Order Block + bullish engulfing or strong volume → aggressive long.
Price inside a Bearish Order Block + bearish engulfing or strong volume → aggressive short.
Price sweeping into an FVG and instantly rejecting → high-probability reversal (especially if the FVG had high volume when created).
Use higher-timeframe bias: if the daily/4H zone aligns with your 15-min or 5-min zone → stack size.
Take partials at the opposite-side order block or next FVG. Let runners go to next liquidity zone.
That’s it.
This script doesn’t try to do everything. It does one thing — show you the exact institutional zones that actually get respected — and it does it cleaner and smarter.
Add it, delete every other OB/FVG script you own, and catch more accurate reversals.

KIMATIX Silver Bullet 2.0KIMATIX Silver Bullet 2.0 is a precision-based intraday trading tool built around the most reliable market behaviors during the ICT Silver Bullet windows.
The indicator automatically identifies high-probability price delivery zones by combining time-based session logic, displacement, fair value gaps, and liquidity dynamics — without clutter or subjective interpretation.
What the indicator does
Automatically marks the three core Silver Bullet windows (New York time)
Tracks session highs and lows to define contextual liquidity
Detects displacement moves using adaptive volatility logic
Highlights valid Silver Bullet Fair Value Gaps (FVGs) only when structural conditions are met
Filters weak setups by minimum size, age, and directional confirmation
Projects FVG zones forward to monitor clean retracements
Plots liquidity levels (highs & lows) with optional mitigation handling
All calculations are done fully automatically — no manual drawing, no guessing.
Designed for
Scalper and Intraday traders (especially 1–5 minute charts)
Futures, indices, forex, and crypto
Traders who want clear execution zones, not lagging signals
Anyone using liquidity-based or ICT-style frameworks
Key advantages
No signals, no repainting logic — context first
Strict filtering to reduce noise and over-marking
Clean visual layout focused on price delivery
Works seamlessly alongside higher-timeframe bias and volume tools
This indicator does not tell you when to trade —
it shows you where the market is most likely to react.
Important note
KIMATIX Silver Bullet 2.0 is a context and execution tool, not a standalone strategy.
Best results are achieved when combined with proper risk management and directional bias.
More Infos and Premium Indicators: kimatixtrading.com

KIMATIX FVG/IFVG/BPRProfessional Fair Value Gap & Imbalance Toolkit
The KIMATIX FVG/IFVG/BPR indicator is a precision tool designed to identify institutional inefficiencies in price:
Fair Value Gaps (FVG), Inverse Fair Value Gaps (IFVG) and Balanced Price Ranges (BPR) — clean, minimal and non-repainting.
This indicator is built for scalpers, intraday traders and smart-money traders who want to trade where price is most likely to react, not where indicators lag.
What this indicator shows
Fair Value Gaps (FVG)
Detects bullish and bearish FVGs using strict 3-candle imbalance logic
Highlights areas where price moved too fast, leaving inefficient structure
Ideal for:
Continuation trades
Pullback entries
Reaction zones after impulse moves
Color-coded
🟢 Bullish FVG
🔴 Bearish FVG
Inverse Fair Value Gaps (IFVG)
Automatically detects when an FVG is invalidated
Marks the same zone as an Inverse FVG
Extremely useful for:
Failed structure setups
Reversal trades
Stop-hunt & liquidity traps
Color-coded
🟡 IFVG (invalidation zone)
Balanced Price Range (BPR)
Detects overlapping bullish & bearish FVGs
Highlights price areas where buying and selling pressure are balanced
These zones often act as:
High-probability reaction areas
Compression zones before expansion
Premium intraday decision levels
Color-coded
🔵 BPR (balanced price range)
Smart, Clean & Non-Repainting
Non-repainting
Only the last 3 active zones are shown → no clutter
Boxes extend forward with a manual cap (user-controlled)
Designed for 1m – 15m execution, works on all markets
Futures, Crypto, FX, Indices, Stocks
How professionals use it
Combine FVGs with:
VWAP
Session highs/lows
Volume Profile (POC / VAH / VAL)
Market structure (BOS / displacement)
Use IFVGs to spot failed smart-money narratives
Use BPRs as decision zones, not blind entries
This indicator does not give buy/sell signals.
It shows you where trades make sense — execution is up to you.
Best use cases
Scalping (1m–3m)
Intraday trading (5m–15m)
Smart-money concepts
Liquidity-based trading
News reactions & stop runs
Learn how to trade it properly
This indicator is part of the KIMATIX Trading Framework.
More education, live examples & full system:
kimatixtrading.com

Po3 CandlesPo3 Candles is a clean visual tool that projects higher-timeframe candles (default: 4H) onto the right side of any chart, regardless of the chart’s current timeframe. This allows traders to see the structure of the higher timeframe ahead of price, without switching charts.
This is especially useful for:
ICT / SMC style traders
Traders who rely on HTF bias
Intraday traders who want to monitor HTF PO3 sequences
Futures, indices, crypto, and FX
What It Does
This indicator displays the last N higher-timeframe candles (1–4), drawn to the right side of your chart:
Always uses real HTF data, independent of the current chart timeframe
Candles appear oldest on the left → newest on the right
Can show only the current HTF candle or up to 4 candles total
Includes fully centered wicks for clean visual alignment
Candle body width + spacing are configurable
Candle colors can match your chart theme
The result is a floating, mini HTF “chart” that updates live as the current HTF candle forms.

TGIF Dynamic Tracker [NINE Θ]Overview
A professional-grade indicator for tracking weekly price ranges and identifying high-probability retracement zones based on the TGIF (Thank God It's Friday) concept from ICT (Inner Circle Trader) methodology.
What is the TGIF Concept?
The TGIF concept is based on the observation that price tends to retrace a significant portion of the weekly range toward the end of the trading week — typically on Thursday evening or Friday. This phenomenon occurs as institutional traders take profits and rebalance positions before the weekend, creating predictable retracement patterns.
By identifying the weekly high and low, traders can anticipate specific retracement levels where price is likely to find support or resistance. The most commonly referenced retracement zone is the 20-30% level, representing a shallow pullback from the week's extreme before potential continuation.
Features In Depth
Weekly High/Low Tracking
The foundation of the TGIF strategy is accurately tracking the current week's price extremes.
Automatic Detection: The indicator continuously monitors price action and updates the weekly high and low in real-time. As new extremes are made, all dependent calculations (retracement zones, percentage levels) update automatically.
Smart Session Timing: The indicator automatically detects your market type and adjusts accordingly:
Stocks/ETFs: Week begins Monday at 9:30 AM ET (market open)
Forex/Crypto/Futures: Week begins Sunday at 6:00 PM ET (18:00)
This ensures accurate weekly range calculations regardless of which market you're trading.
Visual Customization:
Enable/disable weekly high and low lines independently
Choose line color, style (solid, dashed, dotted), and thickness
Lines extend from week start to current bar
Percentage Level Lines
Individual horizontal lines mark key retracement percentages within the weekly range.
Available Levels:
20% — Shallow retracement, first potential support/resistance
30% — Edge of the primary TGIF zone
50% — Mid-range equilibrium point
60% — Beginning of deeper retracement territory
80% — Deep retracement zone
90% — Near-complete retracement
Independent Controls: Each level can be toggled on or off individually, allowing you to display only the levels relevant to your trading strategy. All levels share common styling settings for a clean, consistent appearance.
Dynamic Bias Adjustment: Levels automatically adjust based on the current weekly bias:
Bullish Bias (new weekly high made): Levels measure DOWN from the high
Bearish Bias (new weekly low made): Levels measure UP from the low
This ensures retracement zones always point toward the direction of potential pullback.
Retracement Zones
Highlighted zones visually emphasize the most significant retracement areas.
Three Configurable Zones:
20-30% Zone (Primary TGIF Zone)
This is the classic TGIF retracement area. When price makes a weekly high or low, traders anticipate a pullback to this zone before potential continuation. This shallow retracement often provides optimal risk/reward entries in the direction of the weekly trend.
50-60% Zone (Equilibrium Zone)
Represents a balanced pullback to the middle of the weekly range. Price reaching this zone suggests a more significant retracement is underway. This area often acts as a decision point — price either finds support/resistance here or continues toward deeper retracement levels.
80-90% Zone (Deep Retracement Zone)
Indicates a near-complete retracement of the weekly range. Price reaching this zone suggests the original weekly move may be fully reversing. Traders watch for reversal signals here or prepare for a potential range expansion in the opposite direction.
Zone Display Options:
Each zone can be enabled/disabled independently
Customizable background colors with transparency control
Zones only appear during the retracement period (starting Thursday/Friday)
Midlines: Optional center lines within each zone (25%, 55%, 85%) provide additional precision points. These midlines often act as the "sweet spot" within each retracement band.
Time-Based Markers
Vertical lines help you identify important session boundaries and timing.
Daily Session Lines:
Mark the start of each trading day with vertical lines extending through the weekly range.
Stocks: 9:30 AM ET (NYSE/NASDAQ open)
Forex/Crypto/Futures: 6:00 PM ET (18:00 — New York session close/new day start)
Control how many historical session lines remain visible (1-5) to avoid chart clutter while maintaining useful reference points.
Weekly Start Lines:
A distinct vertical line marks the beginning of each trading week, providing clear visual separation between weeks and helping you identify the starting point for weekly range calculations.
Retracement Start Lines:
Mark when the TGIF retracement period begins — this is when you should start watching for pullbacks to the retracement zones.
Stocks: Friday 9:30 AM ET (Friday market open)
Forex/Crypto/Futures: Thursday 6:00 PM ET (18:00)
Historical Weeks
View retracement data from previous weeks to identify recurring patterns and validate the TGIF concept on your chosen instrument.
Historical Tracking:
Display up to 20 previous weeks of data
Each historical week shows its own high/low lines, retracement zones, and time markers
Helps identify how consistently the instrument respects TGIF levels
What's Displayed:
Weekly high and low boundaries
All enabled retracement zones with midlines
Weekly start and retracement start lines
Optional labels for historical levels
Historical Labels: Toggle labels on historical weeks independently. Disable them to reduce clutter while keeping the visual reference lines.
Use Cases:
Backtest TGIF setups visually on your chart
Identify instruments that respect TGIF levels consistently
Study how deep retracements typically go on your chosen market
Labels & Display Modes
Comprehensive labeling options for quick reference.
Label Display Modes:
Levels: Shows only the level name (e.g., "HIGH", "20%", "50%")
Price: Shows only the price value
Both: Shows level name and price (e.g., "20% | 1.2345")
Label Positioning: Labels appear to the right of the current bar, staying visible as price action develops.
Tooltips: When using "Levels" display mode, hover over any label to see the exact price in the tooltip.
Label Customization:
Text size: Tiny, Small, Normal, Large, Huge
Text color selection
Labels use monospace font for clean alignment
Info Table
An optional real-time summary table showing all current levels and their distance from price.
Table Contents:
Current day indicator (MON, TUE, WED, THU, FRI)
All six percentage levels (20%, 30%, 50%, 60%, 80%, 90%)
Exact price for each level
Distance from current price to each level
Adaptive Theming: The table automatically detects your chart's background color (light or dark) and adjusts text and border colors for optimal readability.
Display Settings:
9 position options (corners, edges, and center)
Size options: Tiny, Small, Normal, Large
Practical Use: Quickly identify which level is nearest to current price without visually scanning the chart. The distance column helps assess how far price needs to travel to reach key zones.
Smart Market Detection
The indicator automatically identifies your market type and adjusts all timing calculations.
Detected Market Types:
Stocks & ETFs:
Week starts: Monday 9:30 AM ET
Daily sessions: 9:30 AM ET
Retracement period begins: Friday 9:30 AM ET
Standard equity market hours apply
Forex & Crypto:
Week starts: Sunday 6:00 PM ET (18:00)
Daily sessions: 6:00 PM ET (18:00)
Retracement period begins: Thursday 6:00 PM ET (18:00)
24-hour market timing with New York session rollover
Futures Contracts:
Automatically detected via common futures symbols (ES, NQ, YM, RTY, CL, GC, etc.)
Uses forex-style timing (18:00 ET rollover)
Handles continuous contracts and front-month symbols
This automatic detection ensures you get accurate weekly ranges without manual configuration.
Bias Tracking
The indicator dynamically tracks weekly directional bias to orient retracement calculations correctly.
How Bias is Determined:
When price makes a new weekly high, bias shifts to BULLISH
When price makes a new weekly low, bias shifts to BEARISH
Bias can change multiple times throughout the week as new extremes are made
Why Bias Matters:
Retracement levels are calculated from the appropriate extreme based on current bias:
Bullish bias: Levels measure DOWN from the weekly high (anticipating pullback from high)
Bearish bias: Levels measure UP from the weekly low (anticipating pullback from low)
This ensures the 20-30% zone always represents a shallow retracement in the context of the current weekly direction.
Tips
Best Results on Trending Weeks: TGIF works best when there's a clear weekly direction. Choppy, range-bound weeks may not produce clean retracements.
Combine with Other Confluence: TGIF levels are most powerful when they align with other technical factors — Fair Value Gaps, order blocks, previous week highs/lows, or key support/resistance levels.
Use Historical Data: Enable historical weeks to see how your instrument typically respects TGIF levels. Some instruments are more "TGIF-friendly" than others.
Midlines as Precision Points: The midlines (25%, 55%, 85%) often act as the exact reversal point within each zone. Watch for reactions specifically at these levels.
Friday Afternoon Caution: Late Friday sessions can be thin and choppy. Consider taking profits or reducing position sizes heading into the weekend.
Requirements
Intraday Timeframes Only: This indicator requires timeframes of 1 hour or less for accurate session and weekly boundary detection.
Sufficient Historical Data: When using the Historical Weeks feature, ensure your chart has enough bars loaded to display the requested number of weeks.
Session-Based Markets: Optimized for markets with distinct sessions. Continuous 24/7 markets may show different characteristics.
Disclaimer
For Educational and Informational Purposes Only
This indicator is provided as a technical analysis tool for educational and informational purposes only. It is not intended as, and should not be construed as, financial advice, investment advice, trading advice, or any other type of advice.
No Guarantees: Past performance of any trading strategy, indicator, or methodology is not indicative of future results. The TGIF concept and associated retracement levels do not guarantee that price will behave in any predicted manner. Markets are inherently
unpredictable, and no technical indicator can accurately predict future price movements.
Risk Warning: Trading financial instruments involves substantial risk of loss and is not suitable for all investors. You should carefully consider your investment objectives, level of experience, and risk appetite before trading. Never trade with money you cannot afford to lose.
Not Financial Advice: The creator of this indicator (NINE) is not a licensed financial advisor, broker, or dealer. Nothing in this indicator or its documentation should be interpreted as a recommendation to buy, sell, or hold any financial instrument.
Your Responsibility: You are solely responsible for your own trading decisions. Always conduct your own research and due diligence before making any trading or investment decisions. Consider consulting with a qualified financial professional before trading.
No Liability: The creator assumes no responsibility or liability for any errors, inaccuracies, or omissions in this indicator or its documentation. The creator shall not be held liable for any losses, damages, or costs arising from the use or inability to use this indicator.

NWOG/NDOG [NINE Θ]Overview
A professional-grade indicator for detecting and visualizing New Week Opening Gaps (NWOGs) and New Day Opening Gaps (NDOGs), essential concepts in ICT (Inner Circle Trader) methodology and analysis.
What Are Opening Gaps?
Opening gaps represent price inefficiencies created between trading sessions. When one session closes and the next session opens at a different price, the resulting "gap" creates a zone of unfilled orders and potential liquidity. These gaps often act as magnets for price, providing high-probability trading opportunities as the market seeks to rebalance these inefficiencies.
NWOG (New Week Opening Gap)
The gap between Friday's close and Sunday's open. These weekly imbalances are significant because they represent the collective repositioning of institutional traders over the weekend. NWOGs frequently serve as major support/resistance zones that can influence price action for days or even weeks. Due to their larger timeframe context, NWOGs typically carry more weight than daily gaps.
NDOG (New Day Opening Gap)
The gap between one session's close and the next session's open. Daily gaps occur more frequently than weekly gaps, offering more regular trading setups. While individually less significant than NWOGs, NDOGs provide valuable intraday reference points and often fill within the same trading session.
Features In Depth
Gap Detection & Visualization
The indicator automatically identifies and plots opening gaps as they form in real-time.
Automatic Detection: The indicator monitors session transitions and instantly identifies when a gap forms between the previous close and current open. NWOGs are detected on Sunday opens, while NDOGs are detected at each new daily session open (excluding Sundays, which are reserved for NWOG detection).
Bullish vs Bearish Classification: Each gap is automatically classified based on its direction:
Bullish Gap (Gap Up): Current open is higher than previous close, indicates overnight buying pressure
Bearish Gap (Gap Down): Current open is lower than previous close, indicates overnight selling pressure
The indicator uses distinct color schemes for bullish and bearish gaps, making it easy to identify gap direction at a glance. Current/most recent gaps use the "new" color settings, while historical gaps use the standard color settings.
Historical Tracking: Track up to 20 gaps of each type simultaneously. The "Historical Count" setting controls how many gaps remain visible on your chart. Older gaps are automatically removed as new ones form, keeping your chart clean while maintaining relevant historical context.
Visual Customization:
Toggle gap boundary lines (HIGH/LOW) on or off independently from the background fill
Choose line styles: solid (⎯⎯⎯), dashed (----), or dotted (····)
Adjust line thickness from 1-4 pixels
Enable/disable background fill with customizable transparency
Set colors independently for current vs historical gaps
Consequent Encroachment (C.E.)
The Consequent Encroachment represents the 50% midpoint of a gap — a critical level in ICT methodology.
Why C.E. Matters: In smart money concepts, the C.E. level represents the point of maximum efficiency within an imbalance. Price often gravitates toward this level as it seeks to rebalance the gap. Many traders use C.E. as their primary target when trading gap fills, or as a key level for entries and stop placement.
C.E. Display Options:
Independent color settings for current vs historical gaps
Separate line style and thickness controls
Can be shown/hidden independently from gap boundaries
Quarter Levels (25% and 75%): For traders who want additional precision, the indicator offers optional quarter levels at 25% and 75% of the gap range. These levels can serve as:
Partial profit targets
Scaling entry points
Additional support/resistance zones within the gap
Fill Tracking & Percentage
The indicator provides sophisticated fill tracking to monitor how much of each gap has been "filled" by subsequent price action.
How Fill Percentage Works:
For bullish gaps (gap up): Measures how far price has retraced DOWN from the gap's high toward its low
For bearish gaps (gap down): Measures how far price has retraced UP from the gap's low toward its high
The fill percentage updates in real-time as price moves through the gap zone, giving you instant feedback on gap fill progress.
Fill Detection Methods:
Wicks: Uses the full candle range (high/low) — more sensitive, detects fills earlier
Bodies: Uses only open/close prices — more conservative, requires stronger commitment
Visual Fill Indicators: The fill percentage is displayed with intuitive symbols:
〇 0-24% filled — Gap is largely untouched
◔ 25-49% filled — Minor fill in progress
◑ 50-74% filled — C.E. level has been reached
◕ 75-99% filled — Gap nearly complete
⬤ 100% filled — Gap fully filled
Hide Filled Gaps: Enable this option to automatically remove gaps from your chart once they reach 100% fill. This keeps your chart focused on active, unfilled gaps that still represent potential trading opportunities.
Projection Levels
When price breaks out of a gap zone, projection levels provide potential targets based on the gap's size.
How Projections Work: Once price closes above a gap's high (for upward projections) or below a gap's low (for downward projections), the indicator calculates extension levels using the gap's range as a measuring unit. These projections function similarly to Fibonacci extensions but are anchored to the gap's dimensions.
Projection Direction:
Upward Projections: Triggered when price closes above the gap's high — levels project above the gap
Downward Projections: Triggered when price closes below the gap's low — levels project below the gap
Customizable Multipliers: Define your own projection levels using the "Projection Levels" input. Enter comma-separated values representing multiples of the gap size:
Default: 0.5,1,2,2.5
Example custom: 0.618,1,1.618,2,2.618 (Fibonacci-based)
Each value creates a projection line at that multiple of the gap range
Projection Display Options:
Side: Display projections on the Left (extending back from gap formation) or Right (extending forward)
Color, Style, Thickness: Full visual customization
Labels: Show multiplier values at each projection level
"Extend Until Tapped" Feature: When enabled (Left side only), projection lines stop extending once price touches them. This creates a visual record of which levels have been reached and when, helping you track projection performance over time. Untapped projections continue extending until they're reached.
Labels & Formatting
Comprehensive labeling options help you quickly identify and reference gaps on your chart.
Label Format Options:
Gap Type: Simple label showing "NWOG" or "NDOG"
Gap Type + Date: Includes the full date with day of week (e.g., "NWOG Monday, November 3, 2025")
Gap Type + Date + Filled Percent: Adds the fill percentage and symbol (e.g., "NWOG Monday, November 3, 2025 ")
Label Positioning:
When Show Levels is ON: Separate labels appear at the HIGH and LOW boundaries
When Show Levels is OFF: A single label appears at the C.E. (midpoint) level
Label Customization:
Text size: Tiny, Small, Normal, or Large
Text color and background color (set background transparency to 100 for no background)
Tooltips provide detailed information including all price levels and fill percentage
Hide Historical Labels: Enable this option to hide labels and projection text on all gaps except the most recent. Lines remain visible, but text clutter is reduced — useful when tracking many historical gaps.
Status Table
An optional summary table provides at-a-glance information about all active gaps.
Table Contents: For each active gap, the table displays:
Gap Type: NWOG or NDOG with date
HIGH: Upper boundary of the gap
LOW: Lower boundary of the gap
C.E.: Consequent Encroachment (50% level)
% Filled: Current fill percentage with visual symbol
Display Settings:
Position: 9 positions available (Top/Middle/Bottom × Left/Center/Right)
Size: Tiny, Small, or Normal text
Gap Count: Control how many NWOGs and NDOGs appear in the table (1-3 each)
Adaptive Theming: The table automatically detects your chart's background color and adjusts text colors for optimal readability on both light and dark themes.
Smart Filtering: The table only shows unfilled gaps (or gaps not hidden by the "Hide Filled" setting), keeping the display focused on actionable information.
Alert System
Stay informed of key gap events without constantly monitoring your charts.
Gap Formation Alerts: Receive an alert the moment a new gap is detected. The alert includes:
Gap direction (Bullish/Bearish)
Gap type (NWOG/NDOG)
Symbol name
Example: "Bullish NWOG formed on AMEX:SPY "
Gap Filled Alerts: Get notified when a gap reaches 100% fill. This is valuable for:
Confirming trade targets have been reached
Identifying when gaps are no longer active reference points
Example: "NWOG filled on AMEX:SPY "
Projection Level Alerts: Receive alerts when price reaches your defined projection levels. Each level only alerts once, preventing spam. Useful for:
Taking profits at projection targets
Identifying extended moves beyond the gap
Example: "NWOG 2x projection reached on AMEX:SPY "
General Settings
Gap Offset: Controls how many bars the gap lines extend to the right of the current candle (0-15 bars). A higher offset keeps labels and lines visible further into the future, while a lower offset keeps the display tighter to current price action.
Tips
NWOG Priority: NWOGs typically hold more significance than NDOGs due to their weekly timeframe. When NWOG and NDOG levels conflict, consider giving more weight to the NWOG.
Unfilled Historical Gaps: Gaps from days or weeks ago can still influence current price action. Don't ignore older unfilled gaps — they often become relevant when price returns to those zones.
Session Context: Pay attention to which session created the gap. Gaps formed during high-volume sessions (like NYSE open) may carry more significance than gaps from lower-volume periods.
Gap Size Matters: Larger gaps represent more significant imbalances and often provide stronger support/resistance. Smaller gaps may fill quickly and offer less reliable levels.
Clean Chart Option: Use "Hide Historical Labels" combined with the status table to maintain a clean chart while still having access to all gap information.
Requirements
Intraday Timeframes Only: This indicator works exclusively on intraday timeframes (minutes, hours). Gap detection requires session open/close data that is only available on intraday charts.
Sufficient Historical Data: Ensure your chart has enough historical bars loaded for accurate gap tracking, especially if using higher historical count settings.
Session-Based Markets: The indicator is optimized for markets with distinct trading sessions (stocks, futures, forex). 24/7 markets like crypto may show fewer or different gap patterns.
Disclaimer
For Educational and Informational Purposes Only
This indicator is provided as a technical analysis tool for educational and informational purposes only. It is not intended as, and should not be construed as, financial advice, investment advice, trading advice, or any other type of advice.
No Guarantees: Past performance of any trading strategy, indicator, or methodology is not indicative of future results. The identification of gaps, projections, and fill levels does not guarantee that price will behave in any predicted manner. Markets are inherently unpredictable, and no technical indicator can accurately predict future price movements.
Risk Warning: Trading financial instruments involves substantial risk of loss and is not suitable for all investors. You should carefully consider your investment objectives, level of experience, and risk appetite before trading. Never trade with money you cannot afford to lose.
Not Financial Advice: The creator of this indicator (NINE) is not a licensed financial advisor, broker, or dealer. Nothing in this indicator or its documentation should be interpreted as a recommendation to buy, sell, or hold any financial instrument.
Your Responsibility: You are solely responsible for your own trading decisions. Always conduct your own research and due diligence before making any trading or investment decisions. Consider consulting with a qualified financial professional before trading.
No Liability: The creator assumes no responsibility or liability for any errors, inaccuracies, or omissions in this indicator or its documentation. The creator shall not be held liable for any losses, damages, or costs arising from the use or inability to use this indicator.

MBZ Model (Simplified Version) [NINE Θ]Overview
The MBZ Model Simplified is an advanced indicator designed to identify reversal zones through the detection of Median Body Zones (MBZs), Inversion Fair Value Gaps (IFVGs), and SMT Divergences. This indicator combines multiple trading concepts into a unified, streamlined tool for precision entries.
The core premise is simple: when price sweeps liquidity and immediately reverses with conviction, it creates a "Median Body Zone", an area where smart money has likely accumulated or distributed positions. These zones often act as powerful support/resistance levels for future price action.
Key Features
Liquidity Level MBZs — Detects reversal zones formed after liquidity sweeps at swing highs/lows
Type 4 (T4) MBZs — Identifies MBZs formed through Fair Value Gap inversions
Inversion Fair Value Gaps (IFVGs) — Tracks FVGs that flip polarity with directional alignment
Market Structure Levels — Displays minor and major buyside/sellside liquidity levels
SMT Divergences — Multi-symbol divergence detection tied to MBZ formations
HTF Open Levels — Power of Three (PO3) analysis with auto-timeframe pairing
Session Filters — Time-based filtering for precise setup validation
Smart Alerts — Forming and validated alerts for all MBZ types
Components Explained
1. Liquidity Level MBZs
Liquidity MBZs form when price:
Sweeps a swing high or swing low (taking liquidity)
Shows immediate rejection with a directional candle
Closes back through the body midpoint of the sweep candle
Bullish MBZ: Forms after a low sweep → Price reverses up aggressively
Bearish MBZ: Forms after a high sweep → Price reverses down aggressively
The zone is drawn from the sweep extreme to the close of the confirmation candle, creating a potential re-entry area if price returns.
Settings Include:
Direction filter (Both/Bullish/Bearish)
Display options (Box/Levels/Both/Close Level)
Zone transparency and colors
25/75% internal levels
Midline display
Historical display count (prioritizes zones closest to price)
PO3 Open alignment filter
2. Type 4 (T4) MBZs
T4 MBZs are a more refined entry model that combines Fair Value Gap analysis with reversal confirmation:
A Fair Value Gap forms in the market
Price returns to tap the FVG
A two-candle reversal pattern confirms the reaction
This creates a tighter, more precise zone compared to standard Liquidity MBZs.
Additional T4 Features:
Lookback period for FVG detection
Consolidation filter (prevents clustering of T4s within X bars)
Optional requirement for Liquidity MBZ directional alignment
Independent historical display settings
3. Inversion Fair Value Gaps (IFVGs)
IFVGs occur when a Fair Value Gap is violated (price closes through it), flipping its polarity:
A bullish FVG that gets closed below becomes a bearish IFVG
A bearish FVG that gets closed above becomes a bullish IFVG
Directional Alignment Feature:
When enabled (default), IFVGs only form when aligned with the current MBZ direction. This creates a cycle:
MBZ forms → Sets directional bias
IFVGs can now form in that direction
Reference MBZ invalidated - IFVG cycle stops
Waits for new MBZ to establish fresh direction
This prevents counter-trend IFVGs from cluttering your chart.
Settings Include:
Classic (box) or Line display style
Lookback filter for source FVGs
Cluster filter (cooldown between IFVGs)
Volume Imbalance inclusion option
Direction filter
MBZ directional alignment toggle
4. Market Structure Levels
Automatically detects and displays swing structure using a multi-timeframe swing detection algorithm:
Minor Levels: Intermediate-term swing highs and lows
Major Levels: Long-term swing highs and lows
Levels extend until filled (price trades through them) and can be customized with various label styles, colors, and display modes.
5. SMT Divergences
Smart Money Technique (SMT) Divergences detect when correlated instruments make divergent swing highs or lows — a potential sign of manipulation or reversal.
Auto-Detection Pairs:
Index Futures: NQ ↔ ES ↔ YM ↔ RTY
Metals: GC ↔ SI ↔ PL
Energy: CL ↔ RB ↔ NG
Key Feature: SMT lines only appear when there's a nearby MBZ in the corresponding direction, filtering out noise and highlighting only the most relevant divergences.
6. HTF Open Levels (PO3)
Displays higher timeframe open prices for Power of Three analysis:
Auto Timeframe Pairing: Automatically selects optimal HTF based on your chart
Vertical session markers: Shows HTF candle boundaries
Open level lines: Track where the HTF candle opened
Auto Pairing Logic:
Sub-1min → 5min
1-2min → 15min
3-4min → 1H
5-9min → 4H
10-59min → Daily
1-4H → Weekly
Daily → Monthly
7. Session Filters
Filter setups to only appear during specific trading sessions:
Two customizable session windows
Timezone selection (NY, Chicago, LA, London, Paris, Tokyo, Shanghai, Sydney)
Only applies on timeframes ≤ 1 hour
Perfect for traders who only trade specific killzones (London Open, NY AM, etc.)
8. PO3 Open Filters
Both Liquidity MBZs and T4 MBZs have optional PO3 alignment filters:
Aligned: Bullish MBZs below HTF open, Bearish above
Reversed: Bullish MBZs above HTF open, Bearish below
Both: No filtering
This helps align entries with the anticipated Power of Three expansion direction.
How to Use It
Basic Workflow:
Identify Bias: Look for a fresh MBZ (Liquidity or T4) to establish direction
Wait for Retest: Price often returns to test MBZ zones
Confirm with IFVGs: IFVGs forming in the same direction add confluence
Check SMT: SMT divergence near an MBZ increases probability
Enter at Zone: Look for lower timeframe confirmation at MBZ levels
Zone Levels:
Close Level: The confirmation candle's close — often the most reactive level
Midline (50%): Equilibrium of the zone
25%/75% Levels: Internal zone levels for precision entries
Invalidation:
Bullish MBZ invalidates on close below zone bottom
Bearish MBZ invalidates on close above zone top
Use "Delete Invalidated" setting to auto-remove or keep for reference
Alerts
The indicator includes comprehensive alerts:
MBZ Forming: Triggers when pattern is developing (before candle close)
MBZ Validated: Triggers when pattern confirms (after candle close)
Separate toggles for Liquidity MBZs and T4 MBZs
Alert messages include symbol and timeframe for easy identification.
Disclaimer
This indicator is a tool for analysis, not a trading system. Always:
Use proper risk management
Combine with your own analysis
Backtest before live trading
Understand that no indicator guarantees profits
Past performance does not indicate future results. Trade responsibly.

DuoBlocks — ICT Order Block DetectorDuoBlocks — ICT Order Block Detector
⚪ Overview
DuoBlocks detects bullish and bearish Order Blocks that form immediately under/over a valid Fair Value Gap. Each zone inherits its height from ATR, so the OB reflects realistic volatility instead of fixed candlestick based values. This makes the zones more adaptive, cleaner, and more faithful to ICT(Inner Circle Trader)-style OB identification.
The indicator displays only the most relevant live block — the one that price is most likely to interact with next.
⚪ Core Logic
DuoBlocks evaluates a two-bar displacement to confirm a real gap (FVG behavior). When a valid upward or downward gap forms, it captures the origin candle as the potential OB and builds the zone using:
• ATR-based height → natural volatility-scaled zone width
• Gap validation above/below price → ensures it’s a true imbalance
• ICT-style logic → the OB sits directly behind the displacement/FVG
• Adaptive time-frame filter → different gap thresholds for <1h and ≥1h charts
• Lookback limit → prevents ancient blocks from cluttering the chart
• Automatic invalidation → block dies if price breaks its boundary
Only surviving blocks remain active, giving a clean and trustworthy supply/demand map.
⚪ Block Selection Engine
When multiple OBs exist, DuoBlocks automatically picks the most relevant:
Bearish OB (supply)
• Must sit above current price
• Chooses the nearest one overhead
• If equal → prefers the newest
• Optional fallback to the closest OB if none sit above price
Bullish OB (demand)
• Must sit below current price
• Chooses the nearest underfoot OB
• If equal → prefers the newest
• Optional fallback enabled in no-OB conditions
⚪ Midline System
Each active OB can show a “midline” at its exact center:
⚪ Inputs & Controls
• ATR length
• Right-side zone extension
• Lookback depth
• Max stored OBs per side
• Optional nearest-fallback
• Toggleable midline + width control
• Custom bull/bear colors
Disclaimer
This script is for educational purposes only and is not financial advice. Trading involves risk, and you are fully responsible for your decisions and results.

PD Array Matrix [NINE Θ]PD Array Matrix
A comprehensive ICT-based indicator that combines multiple Premium/Discount Array concepts into a single, unified tool for Smart Money analysis.
Overview
PD Array Matrix provides traders with institutional-grade market structure analysis by integrating key ICT (Inner Circle Trader) concepts. This indicator automatically identifies and displays critical price levels, imbalances, and divergences that smart money uses to execute trades.
Key Features
Change in State of Delivery (CISD)
Automatically detects shifts in market delivery, signaling potential reversals or continuation setups.
Bullish and Bearish detection with directional filtering
Confirmation arrows for visual clarity
Wick-based invalidation for precise risk management
Customizable line styles, colors, and label formats
Order Blocks
Identifies institutional order flow zones where significant buying or selling occurred.
Box or Line display styles
Filter by direction: Both, Bullish, Bearish, or CISD Direction
CISD Direction mode only shows Order Blocks that align with the current market bias
Automatic invalidation when price mitigates the zone
Market Structure Levels
Tracks key liquidity levels that institutional traders target.
Minor Levels: Intermediate swing highs/lows (Buyside/Sellside)
Major Levels: Significant swing points with higher timeframe relevance
Automatic fill detection with optional historical display
Customizable display modes: Label Only, Price Only, Both, or Minimalistic
Fair Value Gaps (FVGs)
Detects price imbalances created by aggressive market moves.
Three display styles: Normal, Minimalist, and Classic
Optional Volume Imbalance detection (body-to-body gaps)
50% Consequent Encroachment line
Proximity-based display showing FVGs closest to current price
Inversion Fair Value Gaps (IFVGs)
Identifies when price inverts through an existing FVG, flipping its directional bias.
Automatic conversion from FVG to IFVG on body close
Configurable lookback period to filter old inversions
Independent display controls from regular FVGs
Invalidation tracking when price closes through the zone
Higher Timeframe FVGs
Displays Fair Value Gaps from higher timeframes on your current chart.
Auto Timeframe selection based on your chart
Manual timeframe override option
Seamless integration with lower timeframe analysis
SMT Divergences
Detects Smart Money Tool divergences between correlated instruments.
Auto SMT Mode: Automatically selects correlated pairs for:
Index Futures (NQ, ES, YM, RTY)
Metals (GC, SI, PL)
Energy (CL, RB, NG)
Forex Majors
Crypto (BTC, ETH)
Manual symbol selection for custom pairs
Dual symbol comparison for confluence
Automatic invalidation tracking
Session Filters
Limit all setups to specific trading sessions.
Two configurable session windows
Multiple timezone support
Applies to: FVGs, IFVGs, CISDs, Order Blocks, and SMTs
Active on timeframes ≤ 1 hour
Customization
Every component offers extensive customization:
Individual toggle controls for each feature
Color settings for bullish/bearish elements
Multiple line styles (Solid, Dashed, Dotted)
Label size and position options
Transparency controls
Historical display limits
This indicator is for educational and informational purposes only. It does not constitute financial advice. Past performance is not indicative of future results. Always conduct your own analysis and manage risk appropriately.

TCT OBIF Detector█ OVERVIEW
The OBIF (Order Block Imbalance Fill) indicator automatically detects and visualizes high-probability trading zones by combining two powerful Smart Money Concepts: Order Blocks and Fair Value Gaps (FVGs).
An OBIF occurs when an Order Block forms immediately before a Fair Value Gap, creating a zone of institutional interest that price often revisits before continuing its move.
█ CONCEPTS
Order Block (OB)
An Order Block is the last opposing candle before a strong directional move. It represents an area where institutional traders likely placed orders.
- Bullish OB: Last bearish candle before an up-move
- Bearish OB: Last bullish candle before a down-move
Fair Value Gap (FVG)
An FVG is a price imbalance created when a candle's body completely gaps past the previous candle's range, leaving an unfilled area.
- Bullish FVG: Gap up where candle .low > candle .high
- Bearish FVG: Gap down where candle .high < candle .low
OBIF Zone
When an Order Block directly precedes an FVG, it creates an OBIF - a confluence zone with higher probability of acting as support/resistance.
█ HOW TO USE
1. Identify the Trend
Use OBIFs in the direction of the higher timeframe trend for best results.
2. Wait for Price to Return
OBIFs act as magnets - price often returns to fill the imbalance and test the order block.
3. Look for Confirmation
When price enters an OBIF zone, look for:
- Rejection wicks
- Engulfing patterns
- Break of structure on lower timeframes
4. Mitigation
Once price fully trades through the OBIF (touches the opposite edge), the zone is considered mitigated and loses its significance.
█ FEATURES
- Automatic Detection — Identifies OBIFs in real-time as they form
- Visual Zones — Clean, non-intrusive boxes that don't obscure price action
- Mitigation Tracking — Zones automatically update when price mitigates them
- Multi-Timeframe Friendly — Works on any timeframe from 1m to Monthly
- Customizable — Adjust colors, opacity, and display preferences
█ SETTINGS
- Lookback Window — How many candles back to search for the Order Block (default: 3)
- Show Bullish/Bearish — Toggle visibility of each type
- Show Mitigated — Display zones that have been mitigated (shown in gray)
- Fill Opacity — Adjust zone transparency (higher = more see-through)
- Border Width — Thickness of zone borders
█ BEST PRACTICES
✓ Use on higher timeframes (1H+) for more reliable zones
✓ Combine with market structure analysis
✓ Look for OBIFs at key support/resistance levels
✓ Use lower timeframe confirmation for entries
✗ Don't trade every OBIF blindly
✗ Avoid OBIFs against the dominant trend
█ CREDITS
The Composite Trader (TCT) methodologies.

FX OSINT - Institutional Midnight Intelligence For ForexFX OSINT — Institutional Midnight Intelligence For Forex
See Your FX Charts Like an Intelligence Briefing, Not a Guess
If you’ve ever stared at EURUSD or GBPJPY and thought:
Where is the real liquidity?
Is this move sponsored by smart money or just noise?
Am I buying into premium or discount?
…then FX OSINT is designed for you.
FX OSINT (Forex Open Source Intelligence) treats the FX market the way an analyst treats an investigation:
Collect open‑source signals from price, time, and volatility.
Map out liquidity, structure, and sessions in a repeatable way.
Present them in a clean, non‑cluttered dashboard so you can read context quickly.
No rainbow spaghetti. No 12 indicators stacked on top of each other. Just structured information, midnight visuals, and a clear read on what the market is doing right now.
Why FX OSINT Exists
Many FX traders run into the same problems:
Overloaded charts – multiple indicators fighting for space, none talking to each other.
Signals with no context – arrows that ignore structure, sessions, and liquidity.
Tools not tuned for FX – generic indicators that don’t care what pair you are on.
FX OSINT brings this together into one FX‑focused framework that:
Understands structure : BOS/CHOCH, swings, and trend across multiple timeframes.
Respects liquidity : sweeps, order blocks, and FVGs with controlled visibility.
Reads volatility & ADR : how far today’s range has developed.
Knows the clock : London, New York, and key killzones.
Scores confluence : a 0–100 engine that summarizes how much is lining up.
FX OSINT is built for traders who want structured, institutional‑style logic with a disciplined, midnight‑themed UI —not flashing buy/sell buttons.
1. Midnight Dashboard — Top‑Right Intelligence Panel
This panel acts as your compact “situation room”:
CONFLUENCE — 0–100 score blending trend alignment, volatility regime, sessions, liquidity events, order blocks, FVGs, and ADR context.
REGIME — Low / Building / Normal / Expansion / Extreme, driven by ATR relationships, so you know if you’re in chop, trend, or expansion.
HTF / MTF / LTF TREND — Higher‑, medium‑, and current‑timeframe bias in one place, so you see if you are trading with or against the larger flow.
ADR USED — How much of today’s typical range has already been consumed in percentage terms.
PIP VALUE — Approximate pip size per pair, including JPY‑style pairs.
Everything is bold, legible, and color‑coded, but the layout stays minimal so you can:
Look once → understand the context.
2. Structure, BOS, CHOCH — Smart‑Money‑Style Skeleton
FX OSINT tracks swing highs and lows, then shows how structure evolves:
Trend logic based on evolving swings, not just a moving average cross.
BOS (Break of Structure) when price expands in the direction of trend.
CHOCH (Change of Character) when behavior flips and the market structure changes.
Labels are selective, not spammy . You don’t get a tag on every minor wiggle—only when structure meaningfully shifts, so it’s easier to answer:
"Are we continuing the current leg, or did something actually change here?"
3. Liquidity Sweeps, Order Blocks & FVGs — The OSINT Layer
FX OSINT treats liquidity as a key information layer:
Liquidity sweeps — Detects when price spikes through recent highs/lows and then snaps back, flagging potential stop runs.
Order blocks — The last opposite candle before a displacement move, drawn as controlled boxes with limited lifespan to avoid clutter.
Fair Value Gaps (FVGs) — Three‑candle imbalances rendered as precise zones with a cap on how many can exist at once.
Under the hood, boxes are managed so your chart does not become a wall of old zones:
// Draw Order Blocks with overlap prevention
if isBullishOB and showOrderBlocks
if array.size(obBoxes) >= maxBoxes
oldBox = array.shift(obBoxes)
box.delete(oldBox)
newBox = box.new(bar_index , low , bar_index + obvLength, high ,
border_color = bullColor, bgcolor = bullColorTransp,
border_width = 2, extend = extend.none)
array.push(obBoxes, newBox)
Box limits keep the number of zones under control.
Borders and transparency are tuned so you still see price clearly.
You end up with a curated liquidity map , rather than a chart buried under every level price has ever touched.
4. Volatility, ADR & Sessions — Time and Range Intelligence
FX OSINT runs a Volatility Regime Analyzer and an ADR engine in the background:
Volatility regime — Five states (Low → Extreme) derived from fast vs. slow ATR.
ADR bands — Daily high/mid/low projected from the current daily open.
ADR used % — How far today’s move has traveled relative to its typical range.
On the time side:
Asia, London, New York sessions are softly highlighted with a single active background to avoid overlapping colors.
Killzones (e.g., London and New York opens) can be emphasized when you want to focus on where significant moves often begin.
Together, this helps you answer:
"What time is it in the trading day?"
"How stretched are we?"
"Is expansion just starting, or are we late to the move?"
5. ICT‑Style Add‑Ons — BOS/CHOCH, Premium/Discount, and Confluence
For modern FX / ICT‑inspired workflows, FX OSINT includes:
BOS / CHOCH labels — Clear structural shifts based on swings.
Premium / Discount zones — 25%, 50%, 75% levels of the daily range, so you know if you are buying discount in an uptrend or selling premium in a downtrend.
Confluence score — A single number summarizing how many conditions line up in the current context.
Instead of replacing your plan, FX OSINT compresses your checklist into the chart:
Structure
Liquidity
Session / Time
Volatility / ADR
Higher‑timeframe alignment
When these agree, the dashboard reflects it. When they don’t, it stays neutral and lets you see the conflict.
How To Use FX OSINT
FX OSINT is not a signal bot. It is an information engine that organizes context so you can apply your own plan.
A typical workflow might look like:
Start on higher timeframes (e.g., H4/D1) to form directional bias from structure, volatility regime, and ADR context.
Move to intraday timeframes (e.g., M15/H1) around your chosen sessions (London and/or New York).
Look for confluence :
HTF / MTF / LTF trends aligned.
Price in discount for longs or premium for shorts.
Recent liquidity sweep into a meaningful OB or FVG.
Confluence score at or above a level you consider significant.
Then refine entries using BOS/CHOCH on lower timeframes according to your own risk and execution rules.
FX OSINT aims to make sure you do not enter a trade without seeing:
Where you are in the day (ADR and sessions).
Where you are in the volatility cycle (regime).
Who currently appears in control (structure and trend).
Which liquidity was just targeted (sweeps and zones).
Design Choices and Scope
FX OSINT was designed around a few clear constraints:
FX‑focused — Logic and filters tuned for FX majors, minors, exotics, and metals. It is intended for FX markets, not for every possible asset class.
Open‑source — The full Pine Script code is available so you can read it, learn from it, and adapt it to your own workflow if needed.
Clear themes — Two main visual styles (e.g., dark institutional “midnight” and a lighter accent variant) with a focus on readability, not visual noise.
Chart‑friendly — Panels use fixed areas, session highlights avoid overlapping, and boxes are capped/pruned so the chart remains usable.
FX OSINT is for only Forex pairs, not anything else!
Hope you enjoyed and remember your Open Source Intelligence Matters 😉!
-officialjackofalltrades

Dual SMT - Standard & Hidden [Pogiest]General
Smart Money Technique (SMT) involves identifying divergences in a correlated asset triad to predict new phases of price, a shift in market sentiment, and also potential trend reversals. An SMT divergence occurs when one or two assets makes a new high or low, but the other asset or assets does not, signaling a potential shift in market direction. A Hidden SMT Divergence occurs when one or two assets’ closing price closes higher or lower than the other one or two assets’ closing price. However, with potential gaps in price, an opening price can also be the extreme when comparing assets for divergences. Hidden SMT divergence compares the candle bodies while a Standard SMT divergence compares the highs and lows. Both types of SMTs are considered to be cracks in correlation and can be used to identify potential new phases of price whether it be a reversal, retracement, consolidation, and continuation.
Note: Credit of concepts/ideas goes to ICT and TraderDaye.
What Makes This Indicator Unique
The indicator has the ability to display Standard SMTs, Hidden SMTs, or both simultaneously in real-time, tick by tick in the time period selected in a correlated asset triad. Toggle modes for each type of SMT will run independently (runs when enabled) and therefore, optimizes performance. Option to select three different tickers in settings instead of limiting analysis to pairs makes this indicator more versatile. In addition, the indicator has “Invert” toggle options to track both Standard and Hidden SMTs for assets with negative correlations.
Instead of confirming SMT by selecting the number of pivots to look back for detection and confirmation, lines will be plotted on the chart on the first tick it detects a divergence. This can help traders anticipate SMTs in advance and give early warnings instead of waiting for a pivot confirmation. Active lines are displayed on the chart when the indicator identifies a divergence from the current time range to the previous time range in a correlated asset triad. These lines will move dynamically tick by tick on the chart and are anchored to the exact high/lows (Standard SMT) or bodies extremes (Hidden SMT). For inverted symbols, the lines will plot at the inverted anchor points. If new extremes are being made, the lines will move dynamically with the current forming candle for visual precision. During the current time period, the indicator continues to scan for new highs/lows as well as scanning the body high/lows while making line adjustments automatically. Lines will get deleted once the SMT becomes invalid.
The indicator is also designed for consecutive time ranges or cycles. Users are able to select the timeframe to monitor divergences which the indicator has multiple options to choose from including the most used timeframes (i.e. Monthly, Weekly, Daily, 6HR, 4HR, 90M, 1HR, 30M, 15M, etc). For example, if the 90m timeframe is selected, then the indicator will scan for divergences at the extremes in the current 90m cycle and compare the extremes to the previous 90m cycle. The indicator is designed to work when viewing lower timeframes while selecting higher timeframe cycles in settings.
There are four separate alert systems included in this indicator consisting of Standard bull/bear and Hidden bull/bear. Indicator is mode-aware and only triggers when alerts are enabled.
Dynamic Capabilities
Active (Real-Time):
For Standard SMT (High/Low), the indicator scans for divergences using the absolute highs and lows of each candle:
• Bull SMT: Compares the lowest points (wicks included).
• Bear SMT: Compares the highest points (wicks included).
In addition to SMT lines being plotted immediately after detection and lines moving dynamically at new high/low extremes, the indicator will remove the SMT automatically at the first tick it detects the divergence becoming invalid (i.e. all assets made a higher high or lower low in two consecutive time periods). Standard SMT labels are displayed as "SMT - TF" and are anchored to the center of the SMT line.
For Hidden SMT (Bodies), the indicator scans for divergences using only the candle body extremes (open/close, ignoring wicks):
• Bull SMT: Compares the lowest body prices (min of open/close) - divergence based on where bodies close, not wicks.
• Bear SMT: Compares the highest body prices (max of open/close) - divergence based on where bodies close, not wicks.
In addition to SMT lines being plotted immediately after detection and lines moving dynamically following the body high/low extremes, the indicator will remove the SMT automatically once the divergence becomes invalid (i.e. all assets made a higher high or lower low with the body extremes in two consecutive time periods). Hidden SMT labels are displayed as "SMT - TF" and are anchored to the center of the SMT line.
Historical (Fixed Plotting):
Once an SMT divergence (Standard or Hidden) was active and the current time range completes, the SMT line will be plotted and fixed on the chart as a historical line as the new time range starts. When the new time range starts, the cycle resets and the indicator scans for a new active SMT line in the current time range compared to the previous time range. Historical lines are stored for Standard SMT (up to 5) and Hidden SMT (up to 5) for the most recent lines.
Inverse SMT lines (Negative Correlation):
Assets with a negative correlation can be selected in settings with the Invert toggle option selected in settings. SMT divergences for both Standard and Hidden SMTs will be plotted on the chart at their respective anchor points from the previous time cycle to the current time cycle. Lines will behave normally as how it functions when the invert toggle is deselected. However, the lines are inverted on the chart with bullish SMT lines at the highs or bearish SMT lines at the lows.
Usage
Traders can use both types of SMT divergences to anticipate potential reversals in points of interest such as higher timeframe swing points, supply/demand zones, higher timeframe imbalances, key levels, etc. This indicator can also be beneficial in identifying cracks in correlation via Hidden SMT when there are no divergences off the highs and lows. SMT divergences (standard and hidden) can be used as a confirmation tool with other confluences to identify trend direction with respect to points of interest, higher timeframe order-flow, lower timeframe order-flow, etc. In addition, having both a Standard SMT and Hidden SMT divergence display could potentially signal a reversal. It is up to the trader to gauge the price action at the time.
Settings
1. Choose up to three different assets to monitor.
Note: If only two are selected, the indicator will only display the two selected and compare the two assets for divergences.
2. Choose up to one timeframe to monitor.
3. Enable/disable Invert mode.
4. For Standard and Hidden SMT: Enable/disable SMT-Active lines, option to change line style, line width, bull SMT line color, bear SMT line color, and bull/bear label text color.
5. For Standard and Hidden SMT: Enable/disable Historical SMT lines, adjust max historical SMT signals to be displayed (up to 5), option to change line style, line width, bull SMT line color, bear SMT line color, and bull/bear label text color.
6. For Standard and Hidden SMT: Show/hide SMT Labels and adjustable label offset.
7. Shared Label Settings: Adjust label size.
8. Enable/disable SMT Active alerts for Standard and Hidden SMT.
Risk Disclaimer
This indicator is for educational and informational purposes only and does not constitute financial advice. All trading and investment decisions remain solely the responsibility of the user.
Trading involves a high degree of risk, and past performance is not indicative of future results.
Always conduct your own research and consult with a qualified financial professional before making any trading decisions.
By using this indicator, users acknowledge they understand these risks and accept full responsibility for their trading decisions and outcomes.

One for AllOne for All (OFA) - Complete ICT Analysis Suite
Version 3.3.0 by theCodeman
📊 Overview
One for All (OFA) is a comprehensive TradingView indicator designed for traders who follow Inner Circle Trader (ICT) concepts. This all-in-one tool combines essential ICT analysis features—sessions, kill zones, previous period levels, and higher timeframe candles with Fair Value Gaps (FVGs) and Volume Imbalances (VIs)—into a single, highly customizable indicator. Whether you're a beginner learning ICT concepts or an experienced trader refining your edge, OFA provides the visual structure needed for precise market analysis and execution.
✨ Key Features
- 🏷️ Customizable Watermark**: Display your trading identity with customizable titles, subtitles, symbol info, and full style control
- 🌍 Trading Sessions**: Visualize Asian, London, and New York sessions with high/low lines, range boxes, and open/close markers
- 🎯 Kill Zones**: Highlight 5 critical ICT kill zones with precise timing and visual boxes
- 📈 Previous Period H/L**: Track Daily, Weekly, and Monthly highs/lows with customizable styles and lookback periods
- 🕐 Higher Timeframe Candles**: Display up to 5 HTF timeframes with OHLC trace lines, timers, and interval labels
- 🔍 FVG & VI Detection**: Automatically detect and visualize Fair Value Gaps and Volume Imbalances on HTF candles
- ⚙️ Universal Timezone Support**: Works globally with GMT-12 to GMT+14 timezone selection
- 🎨 Full Customization**: Control colors, styles, visibility, and layout for every feature
🚀 How to Use
Watermark Setup
The watermark overlay helps you identify your charts and maintain focus on your trading principles:
1. Enable/disable watermark via "Show Watermark" toggle
2. Customize the title (default: "Name") to display your trading name or account identifier
3. Set up to 3 subtitles (default: "Patience", "Confidence", "Execution") as trading reminders
4. Choose position (9 locations available), size, color, and transparency
5. Toggle symbol and timeframe display as needed
Use Case: Display your trading principles or account name for multi-monitor setups or content creation.
Trading Sessions Analysis
Sessions define market character and liquidity availability:
1. Enable "Show All Sessions" to visualize all three sessions
2. Adjust timezone to match your local market (default: UTC-5 for EST)
3. Customize session times if needed (defaults cover standard hours)
4. Enable session range boxes to see consolidation zones
5. Use session high/low lines to identify key levels for the current session
6. Enable open/close markers to track session transitions
Use Case: Identify which session you're trading in, track session highs/lows for liquidity, and anticipate session transition volatility.
Kill Zones Trading
Kill zones are ICT's high-probability trading windows:
1. Enable individual kill zones or use "Show All Kill Zones"
2. **Asian Kill Zone** (2000-0000 GMT): Early positioning and smart money accumulation
3. **London Kill Zone** (0300-0500 GMT): European market opening volatility
4. **NY AM Kill Zone** (0930-1100 EST): Post-NYSE open expansion
5. **NY Lunch Kill Zone** (1200-1300 EST): Midday consolidation or manipulation
6. **NY PM Kill Zone** (1330-1600 EST): Afternoon positioning and closes
7. Customize colors and times to match your trading style
8. Set max days display to control historical visibility (default: 30 days)
Use Case: Focus entries during high-probability windows. Watch for liquidity sweeps at kill zone openings and institutional positioning.
Previous Period High/Low Levels
Previous period levels act as magnetic price targets and support/resistance:
1. Enable Daily (PDH/PDL), Weekly (PWH/PWL), or Monthly (PMH/PML) levels individually
2. Set lookback period (how many previous periods to display)
3. Choose line style: Solid (current emphasis), Dashed (standard), or Dotted (subtle)
4. Customize colors per timeframe for visual hierarchy
5. Adjust line width (1-5) for visibility preference
6. Enable gradient effect to fade older periods
7. Position labels left or right based on chart layout
8. Customize label text for your preferred notation
Use Case: Identify key levels where price is likely to react. Daily levels work on intraday timeframes, Weekly on daily charts, Monthly for swing trading.
Higher Timeframe (HTF) Candles
HTF candles reveal the larger market context while trading lower timeframes:
1. Enable up to 5 HTF slots simultaneously (default: 5m, 15m, 1H, 4H, Daily)
2. Choose display mode: "Below Chart" (stacked rows) or "Right Side" (compact column)
3. Customize timeframe, colors (bull/bear), and titles for each slot
4. **OHLC Trace Lines**: Visual lines connecting HTF candle levels to chart bars
5. **HTF Timer**: Countdown showing time remaining until HTF candle close
6. **Interval Labels**: Display day of week (Daily+) or time (intraday) on each candle
7. For Daily candles: Choose open time (Midnight, 8:30, 9:30) to match your market structure preference
Use Case: Trade lower timeframes while respecting higher timeframe structure. Watch for HTF candle closes to confirm directional bias.
FVG & VI Detection
Fair Value Gaps and Volume Imbalances highlight inefficiencies that price often revisits:
1. **Fair Value Gaps (FVGs)**: Detected when HTF candle wicks don't overlap between 3 consecutive candles
- Bullish FVG: Gap between candle 1 high and candle 3 low (green box by default)
- Bearish FVG: Gap between candle 1 low and candle 3 high (red box by default)
2. **Volume Imbalances (VIs)**: Similar detection but focuses on body gaps
- Bullish VI: Gap between candle 1 close and candle 3 open
- Bearish VI: Gap between candle 1 open and candle 3 close
3. Enable FVG/VI detection per HTF slot individually
4. Customize colors and transparency for each imbalance type
5. Boxes appear on chart at formation and remain visible as retracement targets
**Use Case**: Identify high-probability retracement zones. Price often returns to fill FVGs and VIs before continuing the trend. Use as entry zones or profit targets.
🎨 Customization
OFA is built for flexibility. Every feature includes extensive customization options:
Visual Customization
- **Colors**: Independent color control for every element (sessions, kill zones, lines, labels, FVGs, VIs)
- **Transparency**: Adjust box and label transparency (0-100%) for clean charts
- **Line Styles**: Choose Solid, Dashed, or Dotted for previous period lines
- **Sizes**: Control text size, line width, and box borders
- **Positions**: Place watermark in 9 positions, labels left/right
Layout Control
- **HTF Display Mode**: "Below Chart" for detailed analysis, "Right Side" for space efficiency
- **Drawing Limits**: Set max days for sessions/kill zones to manage chart clutter
- **Lookback Periods**: Control how many previous periods to display (1-10)
- **Gradient Effects**: Enable fading for older previous period lines
Timing Adjustments
- **Timezone**: Universal GMT offset selector (-12 to +14) for global markets
- **Session Times**: Customize each session's start/end times
- **Kill Zone Times**: Adjust kill zone windows to match your market's characteristics
- **Daily Open**: Choose Midnight, 8:30, or 9:30 for Daily HTF candle open time
💡 Best Practices
1. Start Simple: Enable one feature at a time to learn how each element affects your analysis
2. Match Your Timeframe: Use Daily levels on intraday charts, Weekly on daily charts, HTF candles one or two levels above your trading timeframe
3. Kill Zone Focus: Concentrate your trading activity during kill zones for higher probability setups
4. HTF Confirmation: Wait for HTF candle closes before committing to directional bias
5. FVG/VI Entries: Look for price to return to unfilled FVGs/VIs for entry opportunities with favorable risk/reward
6. Customize Colors: Use a consistent color scheme that matches your chart theme and reduces visual fatigue
7. Reduce Clutter: Disable features you're not actively using in your current trading plan
8. Session Context: Understand which session controls the market—trade with session direction or anticipate reversals at session transitions
⚙️ Settings Guide
OFA organizes settings into logical groups for easy navigation:
- **═══ WATERMARK ═══**: Title, subtitles, position, style, symbol/timeframe display
- **═══ SESSIONS ═══**: Enable/disable sessions, times, colors, high/low lines, boxes, markers
- **═══ KILL ZONES ═══**: Individual kill zone toggles, times, colors, max days display
- **═══ PREVIOUS H/L - DAILY ═══**: Daily high/low lines, style, color, lookback, labels
- **═══ PREVIOUS H/L - WEEKLY ═══**: Weekly high/low lines, style, color, lookback, labels
- **═══ PREVIOUS H/L - MONTHLY ═══**: Monthly high/low lines, style, color, lookback, labels
- **═══ HTF CANDLES ═══**: Global display mode, layout settings
- **═══ HTF SLOT 1-5 ═══**: Individual HTF configuration (timeframe, colors, title, FVG/VI detection, trace lines, timer, interval labels)
Each setting includes tooltips explaining its function. Hover over any input for detailed guidance.
📝 Final Notes
One for All (OFA) represents a complete ICT analysis toolkit in a single indicator. By combining watermark customization, session visualization, kill zone highlighting, previous period levels, and higher timeframe candles with FVG/VI detection, OFA eliminates the need for multiple indicators cluttering your chart.
**Version**: 3.3.0
**Author**: theCodeman
**Pine Script**: v6
**License**: Mozilla Public License 2.0
Start with default settings to learn the indicator's structure, then customize extensively to match your personal trading style. Remember: tools provide information, but your edge comes from disciplined execution of a proven strategy.
Happy Trading! 📈

Smart Money Concepts [Modern Neon V2]This is a visually overhauled version of the popular Smart Money Concepts (SMC) indicator, designed specifically for traders who prefer Dark Mode, High Contrast, and Maximum Visibility.
While the underlying logic preserves the robust structure detection of the original LuxAlgo script, the visual presentation has been completely modernized. The default "dull" colors have been replaced with a vibrant Cyberpunk Neon palette, and text labels have been significantly upscaled to ensure market structure is readable at a glance, even on high-resolution monitors.
🎨 Visual & Style Enhancements:
Neon Palette:
Bullish: Electric Cyan (#00F5FF)
Bearish: Neon Hot Pink (#FF007F)
Neutral/Levels: Bright Gold (#FFD700)
High Visibility Text: Market Structure labels (BOS, CHoCH, HH/LL) have been upgraded from "Tiny" to Normal size. Key Swing Points (Strong High/Low) are set to Large.
Modern "Solid" Blocks: Order Blocks and FVGs feature reduced transparency (60%) for a bolder, solid look that doesn't get washed out on dark backgrounds.
Decluttered: Removed unnecessary "Small" elements and dotted lines to focus on price action.
🛠 Key Features:
Real-Time Structure: Automatic detection of Internal and Swing structure (BOS & CHoCH) with trend coloring.
Order Blocks: Highlights Bullish and Bearish Order Blocks with new mitigation logic.
Fair Value Gaps (FVG): Auto-threshold detection for high-probability gaps.
Premium & Discount Zones: Automatically plots equilibrium zones for better entry targeting.
Multi-Timeframe Levels: Display Daily, Weekly, and Monthly highs/lows.
Trend Dashboard: (If you added the dashboard code) A clean panel displaying the current Internal and Swing trend bias.
CREDITS & LICENSE: This script is a modification of the "Smart Money Concepts " indicator.
Original Author: © LuxAlgo
License: Attribution-NonCommercial-ShareAlike 4.0 International (CC BY-NC-SA 4.0)
creativecommons.org

BPR [Gold Group]✨ BPR Indicator – Gold Group
The BPR (Breakout–Pullback–Reversal) Indicator by Gold Group is a premium, research-based market tool designed to help traders identify high-probability trading opportunities with precision. Built on advanced price-action logic and institutional behavior analysis, this indicator highlights key market zones where smart-money activity is most likely to occur—allowing traders to enter the market with confidence and clarity.
🔍 What the BPR Indicator Does
Detects Breakout Zones where liquidity is taken and momentum shifts begin.
Marks Pullback Levels where the market retests institutional footprints.
Identifies Reversal Points with high accuracy for powerful entries.
Filters out market noise, showing only meaningful structure changes.
Works on all timeframes and all major assets such as Gold, Forex, NAS100, US30, Crypto.
🔥 Why This Indicator Is Important
Helps traders understand institutional price movement, not retail traps.
Reduces emotional decision-making by giving crystal-clear levels.
Increases trade accuracy by aligning entries with market structure shifts.
Saves time by automatically plotting areas where smart money reacts.
🎯 Why You Should Use It
Perfect for both beginners and professionals.
Suitable for scalping, intraday, and swing trading.
Developed and tested by Gold Group Research Team with proven performance.
Allows traders to stay ahead of manipulative moves and avoid fake breakouts

Trendshift [CHE]Trendshift — First-Shift Regime Turns with Premium/Discount Context
Summary
Trendshift highlights the first confirmed directional structure shift in price and overlays a premium or discount context based on the most recent structural range. It identifies the major swing levels, detects a regime transition when price closes beyond these levels with optional ATR-based conviction, and marks only the first shift per direction to reduce repetition and noise. The indicator then establishes a premium or discount band around the break and tints the background when price operates in either region. This produces a clean regime-aware view that emphasizes only the earliest actionable turn while maintaining contextual bias information.
Motivation: Why this design?
Conventional swing-based structure tools often fire repeated signals after each minor break, especially in volatile environments. This leads to cluttered charts and little informational value. Trendshift focuses on the core trading need: isolating the first confirmed change in directional structure and providing a premium or discount context after the break. By limiting signals to the initial flip and suppressing further markers until direction reverses again, the script reduces noise and highlights only the structural event that materially matters. The band logic further addresses the challenge of distinguishing contextual extremes and avoiding trades taken too late after a shift.
What’s different vs. standard approaches?
Baseline reference: Most structure indicators repeatedly plot every new break of a swing high or swing low.
Differences:
Only the first confirmed bullish or bearish shift is plotted until the opposite direction occurs.
ATR-filtered breakout validation to reduce false breaks during volatility spikes.
A reduced premium and discount band derived from the breakout candle and prior swing structure.
Tinted background for contextual positioning rather than explicit entry signals.
Practical effect:
Fewer but more meaningful shift markers.
Clear visual context of where price operates relative to the structural band.
Cleaner regime transitions and less chart clutter.
How it works (technical)
The indicator continuously evaluates major swing highs and lows using a symmetric window length. When a swing is confirmed, the script stores its price and bar index. A structure shift occurs when price closes beyond the most recent major swing in the opposite direction. Optional ATR filtering requires the breakout distance to exceed an ATR-scaled threshold.
Upon a confirmed shift, the script sets a regime state that remains active until a new shift or an optional timeout. It also establishes a structural band anchored between the breakout candle extremum and the prior opposite swing. The band informs the premium and discount boundaries, each representing a quarter subdivision.
Only the first shift event per direction generates a visual triangle marker. The band is validated by comparing its height to ATR to avoid extremely narrow structures. Background tinting activates whenever price resides within the premium or discount zones. Persistent variables maintain previous structural states and prevent re-triggering until direction reverses.
Parameter Guide
Swing length (default 5): Controls the number of bars used on each side of a swing. Smaller values are more reactive; larger values reduce noise.
Use ATR filter (default true): Requires breakout strength beyond the swing to exceed an ATR-scaled threshold. Disabling increases signal frequency.
ATR length (default 14): Controls volatility estimation for breakout filtering and band validation.
Break ATR multiplier (default 1.0): Higher values require stronger breakouts, reducing false shifts.
Enable framework (default true): Activates the premium and discount context logic.
Persist band on timeout (default true): Retains the current band after a regime timeout.
Min band size ATR mult (default 0.5): Rejects extremely small bands and prevents unrealistic tinting.
Regime timeout bars (default 500): Resets the regime after extended inactivity.
Invert colors (default false): Swaps premium and discount tint color assignments.
Show zone tint (default true): Toggles background shading.
Show shift markers (default true): Enables or disables the first-shift triangles.
Reading & Interpretation
A green or red tint signals that price is operating in the discount or premium region of the most recent structural band. These regions are derived from the breakout event and the prior swing. A green triangle below a bar indicates the first bullish structure shift after a bearish regime. A red triangle above a bar indicates the first bearish shift after a bullish regime. No further markers appear until direction reverses. When tint is active, price location within the band offers simple contextual bias without providing explicit entries.
Practical Workflows & Combinations
Trend following: Treat the first bullish marker as the earliest confirmation of a potential up-regime and the first bearish marker for a potential down-regime. Use price location relative to the premium and discount zones as context for continuation or mean-reversion setups.
Structure-based execution: Combine with simple swing highs and lows to refine entry points within discount after a bullish shift or within premium after a bearish shift.
Higher-timeframe overlays: Apply the indicator on higher timeframes to define macro structure, then trade on lower timeframes using the band as a contextual anchor.
Risk management: When price stays in premium during a bearish regime or in discount during a bullish regime, consider protective actions or position management adjustments.
Behavior, Constraints & Performance
The script uses only confirmed swing points and closed-bar conditions, so repainting from future bars does not occur except the inherent delay of pivot confirmation. No higher-timeframe security calls are used, avoiding HTF repaint paths.
Performance impact is minimal because the script uses no loops or arrays and relies on persistent variables. The maximum bars back setting is five-thousand, required for swing lookback. Known limitations include quiet behavior during long consolidations, occasional delayed recognition of shifts due to swing confirmation, and limited effectiveness during large market gaps where extremum logic may be distorted.
Sensible Defaults & Quick Tunin g
Increase the swing length for smoother trend shifts and fewer signals.
Decrease the swing length for more sensitivity.
Raise the ATR breakout multiplier to reduce noise in volatile markets.
Lower the band size requirement to make premium and discount zones more active on slower markets.
Extend the regime timeout for slow-moving assets.
What this indicator is—and isn’t
This tool is a structural regime-shift detector with contextual premium and discount shading. It is not a complete trading system and does not include entries, exits, or risk models. It does not predict future price movement. It should be combined with broader structure analysis, liquidity considerations, and risk management practices.
Disclaimer
The content provided, including all code and materials, is strictly for educational and informational purposes only. It is not intended as, and should not be interpreted as, financial advice, a recommendation to buy or sell any financial instrument, or an offer of any financial product or service. All strategies, tools, and examples discussed are provided for illustrative purposes to demonstrate coding techniques and the functionality of Pine Script within a trading context.
Any results from strategies or tools provided are hypothetical, and past performance is not indicative of future results. Trading and investing involve high risk, including the potential loss of principal, and may not be suitable for all individuals. Before making any trading decisions, please consult with a qualified financial professional to understand the risks involved.
By using this script, you acknowledge and agree that any trading decisions are made solely at your discretion and risk.
Do not use this indicator on Heikin-Ashi, Renko, Kagi, Point-and-Figure, or Range charts, as these chart types can produce unrealistic results for signal markers and alerts.
Best regards and happy trading
Chervolino

External Range Liquidity by fx4_livingExternal Range Liquidity Indicator
This indicator visualizes the evolving price range boundaries and subdivisions for a user-defined intraday session period on the chart.
It computes and displays the highest and lowest prices observed within the specified session (used as external range liquidity), updating dynamically with each bar, and includes optional midpoint and quartile levels represented by horizontal lines that adjust as the range develops.
Key Features:
Session Range Calculation: Tracks the maximum high and minimum low prices during the active session, refreshing in real-time.
Midpoint Display: Optionally plots a median level between the session high and low, with selectable styles (solid, dotted, or dashed).
Quadrant Display: Optionally segments the range into quarters by displaying levels at 25% and 75% from the low, with customizable line styles.
Color Customization: Allows selection of colors for the high boundary (default blue), low boundary (default red), midpoint (default gray), and quadrants (default gray).
Session Input: User-configurable session timeframe, defaulting to 18:00-16:14 across all weekdays and weekends, using America/New York time zone.
Timeframe Compatibility: Optimized for intraday use on charts of 30 minutes or lower; attempts to apply on higher timeframes will display an error.
Visualization Style: High and low ranges appear as stepped lines with diamond markers indicating external liquidity purges. Midpoint and quadrant lines are horizontal segments without extension for precise session representation.
Settings:
Range: Specifies the session window (e.g., "1800-1614").
High Color: Color for the upper range line.
Low Color: Color for the lower range line.
Show range mid point: Enable/disable the midpoint line.
(Midpoint color and style): Inline choices for color and line type (Solid, Dotted, Dashed).
Show range quadrants: Enable/disable both the 25% and 75% lines.
(Quadrants color and style): choices for color and line type (Solid, Dotted, Dashed).
This tool serves purely for visual analysis of session price dynamics on charts.
It offers no signals, predictions, or guidance for any market actions.
Users are encouraged to perform independent evaluations and align with their own strategies when incorporating charting elements.

Smart Money Concepts [Riz]Smart Money Concepts is a comprehensive technical analysis tool for identifying institutional trading patterns and market structure. This indicator combines Smart Money Concepts (SMC), ICT methodology, and Wyckoff principles into one professional tool.
✨ KEY FEATURES
📊 VOLUMETRIC ORDER BLOCKS
• Visual representation of supply/demand zones with volume distribution
• Horizontal volume bars showing buy/sell composition inside each Order Block
• Automatic mitigation tracking
• Breaker Block detection (invalidated OBs acting as reversal zones)
• Strength rating system: ★ Weak, ★★ Medium, ★★★ Strong
• ATR-based size filtering to show only significant zones
📈 MARKET STRUCTURE DETECTION
• Break of Structure (BOS) and Change of Character (CHoCH) identification
• Higher Highs (HH), Higher Lows (HL), Lower Highs (LH), Lower Lows (LL) labels
• Internal structure pivots (iH/iL) for intraday analysis
• Auto-adjusting swing length based on timeframe
• Configurable confirmation methods (Close vs Wick-based)
💎 FAIR VALUE GAPS (FVG)
• Automatic detection of bullish and bearish imbalances
• Configurable mitigation percentage (default 50%)
• Visual tracking until gaps are filled
• Separate color schemes for clarity
💧 LIQUIDITY ANALYSIS
• Buy Side Liquidity (BSL) identification at swing highs
• Sell Side Liquidity (SSL) identification at swing lows
• Automatic sweep detection with visual confirmation
• Real-time alerts when liquidity is taken
⚖️ PREMIUM & DISCOUNT ZONES
• Dynamic range calculation based on configurable lookback period
• Equilibrium (EQ) level identification
• Previous Day High (PDH) and Previous Day Low (PDL) levels
• Helps identify favorable entry zones
📊 REAL-TIME DASHBOARD
• Live statistics on all detected patterns
• Active Order Blocks and FVGs count
• BOS/CHoCH occurrence tracking
• Liquidity sweep counters
• Recent market activity indicators
• Current trend bias display
• Fully customizable position and size
⚙️ CUSTOMIZATION OPTIONS
All aspects are fully customizable:
• Swing Length (1-50 bars) with auto-adjust for timeframe
• Max Active Order Blocks (10-100)
• Volume bar position (Left/Right) with mirror option
• Volume bar width percentage (10-50%)
• ATR size filter for Order Blocks
• Strength rating method (Touches/Age/Distance/Volume/Combined)
• All colors and transparency levels
• Dashboard position (9 locations available)
• Comprehensive alert system for all events
🎓 HOW IT WORKS
ORDER BLOCKS: Identified at the last candle before a Break of Structure. These represent institutional supply and demand zones. Volume is estimated based on candle characteristics and displayed as horizontal bars.
MARKET STRUCTURE: Tracks pivot highs and lows to determine if price is making Higher Highs/Higher Lows (bullish structure) or Lower Highs/Lower Lows (bearish structure). BOS indicates trend continuation, while CHoCH signals potential trend reversal.
LIQUIDITY: Swing highs represent Buy Side Liquidity where short positions have their stop losses. Swing lows represent Sell Side Liquidity where long positions have stop losses. The indicator tracks when these levels are "swept" by price.
FAIR VALUE GAPS: Three-candle patterns where the current candle's range doesn't overlap with the candle two bars ago, creating price imbalances that often get filled later.
📚 BEST PRACTICES
• Use on all timeframes - Auto-adjust feature optimizes settings automatically
• Look for confluence - Best setups occur when multiple concepts align (e.g., Order Block + liquidity sweep + discount zone)
• Consider risk/reward - Use Premium/Discount zones to identify favorable entry areas
• Respect market context - Order Blocks in the direction of overall trend tend to be more reliable
• Volume matters - Higher volume percentages in the expected direction may indicate stronger zones
⚠️ IMPORTANT NOTES
EDUCATIONAL TOOL: This indicator is designed for analysis and education, not as trading signals or investment advice.
VOLUME ESTIMATION: Buy/sell volume distribution is estimated based on candle characteristics since true buy/sell volume data is not available in Pine Script.
NO GUARANTEES: Past performance is not indicative of future results. All trading involves substantial risk.
RISK MANAGEMENT: Always use proper risk management and seek additional confirmation before making trading decisions.
OBJECT LIMITS: On very fast timeframes (1m, 5m) in highly volatile markets, the indicator may approach Pine Script's 500-object limit. Reduce max OBs/FVGs in settings if needed.
🔧 TECHNICAL SPECIFICATIONS
• Pine Script Version: v6
• Indicator Type: Overlay (displays on price chart)
• Maximum Objects: Optimized to stay within Pine Script limits
• Performance: Efficient rendering with configurable history management
• Updates: Real-time on every bar close
📖 METHODOLOGY
This indicator combines concepts from:
• Inner Circle Trader (ICT) methodology
• Smart Money Concepts (SMC) framework
• Wyckoff market analysis principles
• Order flow and volume spread analysis
⚖️ DISCLAIMER
This indicator is for educational and informational purposes only. It is not financial advice. Trading financial instruments carries substantial risk and may not be suitable for all investors. Past performance is not indicative of future results. Always conduct your own research and consult with a licensed financial advisor before making any investment decisions. The author assumes no responsibility for any losses incurred from using this indicator.

Thiru-KillzonesThiru Killzones - Advanced Trading Session Indicator
Overview
Thiru Killzones is a comprehensive trading session indicator designed to help traders identify and analyze key market sessions throughout the trading day. It visualizes five major trading sessions (Asia, London, NY AM, Lunch, NY PM) with customizable opening range analysis, target levels, and statistical tracking.
Key Features
📊 Trading Sessions
5 Major Sessions: Asia, London, NY AM, Lunch, NY PM
Customizable Times: Configure each session's start and end time
Individual Colors: Each session can have its own color
Enable/Disable: Turn sessions on/off individually
Session Extension: Extend sessions beyond normal hours (especially useful for Asia session)
📈 Opening Range Analysis
Configurable Duration: Set opening range period (default: 60 minutes)
Breakout Flags: Visual indicators when price breaks target levels
Target Visualization: Optional boxes and lines at target levels
Performance Tracking: Statistics table showing hit rates for each target level
🎨 Visual Styles
Choose from 4 unique visual styles:
Frame: Full box with borders (default)
Shade: Background fill only (no borders)
Horizon: Horizontal lines marking session boundaries
Rails: Horizontal lines with vertical orientation option
🏷️ Labels & Display
Customizable Labels: Show session name, day, price range, or pips
Flexible Positioning: Top/Bottom/Center, Inside/Outside, Left/Center/Right
Auto-hide on Daily+: Automatically hides labels on daily timeframe and higher
Multiple Sizes: Auto/Tiny/Small/Normal/Large/Huge
📊 Statistics & Analysis
Session Statistics Table: Compare current session range vs average
Value Format: Display as Price or Pips
⚙️ Advanced Settings
Timezone Support: 27 timezone options (GMT-11 to GMT+12)
Timeframe Filtering: Hide indicator on higher timeframes
History Control: Control how many historical sessions to display
Unified Colors: Option to use same color for all sessions
Transparency Control: Separate transparency for boxes and borders
Border Customization: Solid/Dash/Dot styles with adjustable width
How to Use
Basic Setup
1. Add the indicator to your chart
2. Configure your timezone in Settings
3. Enable the sessions you want to track
4. Customize colors and visual style
Opening Range Analysis
1. Enable "Opening Range" for desired sessions
2. Set the duration (default: 60 minutes)
3. Enable target lines/boxes to see R1/R2/S1/S2 levels
4. Enable breakout flags to see when price breaks levels
5. Enable data table to track statistics
Session Extension
1. Enable "Extended Range" for sessions that cross midnight (like Asia)
2. The indicator automatically calculates the session end time
3. Opening range lines will stop exactly at session end time
Customization
- Use "Visual Style" section to change box appearance
- Use "Labels" section to customize label display
- Use "Unified Colors" to apply same color scheme to all sessions
- Adjust transparency for cleaner chart appearance
Default Session Times
- Asia: 18:00-00:00 (crosses midnight)
- London: 02:00-05:00
- NY AM: 08:30-10:00
- Lunch: 12:00-13:00
- NY PM: 13:30-16:00
*Note: Times are in your selected timezone*
Tips
- Use "History Periods" to control how many past sessions are displayed
- Enable "Hide on Daily+" for labels to keep daily charts clean
- Use "Current Only" in opening range to show only active session
- Enable statistics tables to track session performance over time
- Use session extension for Asia session to properly handle midnight crossover
Attribution
This indicator uses the following community libraries:
- boitoki/AwesomeColor/9 (color utilities)
- boitoki/Utilities/11 (utility functions)
All enhancements and features are original implementations.
Support
For questions or issues, please contact me @thirudinesh through TradingView.
---
© 2025 thirudinesh

QT Previous Micro Cycle Range + SSMT [bilal]Previous Micro Cycle Range + SMTs - Indicator Description
📊 Overview
This indicator tracks 22.5-minute micro cycles within ICT's Quarterly Theory framework and automatically detects Smart Money Technique (SMT) divergences across correlated indices (NQ, ES, YM). It visualizes previous cycle ranges and identifies high-probability manipulation completions for precise intraday entries.
🎯 What It Does
Micro Cycle Tracking:
Divides each 90-minute session into four 22.5-minute micro quarters
Plots the previous micro cycle's High, Low, Equilibrium (EQ), and Quarter levels
Updates automatically as new micro cycles form
Works on any timeframe (recommended: 1-5 minute charts)
SMT Detection:
Compares current micro cycle vs previous micro cycle across NQ, ES, and YM
Detects Bearish SMT: Divergence at highs (signals distribution down)
Detects Bullish SMT: Divergence at lows (signals distribution up)
Draws visual SMT lines with directional arrows showing correlation/divergence
Optional SMT table showing all three indices' movements
💡 How To Use It
For Scalpers & Day Traders:
Wait for a new micro cycle to begin (lines will refresh every 22.5 minutes)
Watch for SMT formation in the current cycle
Bullish SMT = Buy signal (previous low is confirmed, expect move to previous high)
Bearish SMT = Sell signal (previous high is confirmed, expect move to previous low)
Key Concepts:
Minimum Target: Opposite extreme of previous cycle
SMT Confirmation: One or two indices sweep a level while the other(s) fail to sweep
Best Results: Trade with higher timeframe bias aligned
⚙️ Features
Customizable Display:
Toggle High/Low lines with multiple label styles (Timeframe, Label, %, Fib)
Optional Equilibrium (50%) level
Optional Quarter levels (25% / 75%)
Optional extended range projections (±50% to ±400%)
Adjustable line colors, widths, and label sizes
SMT Options:
Enable/disable SMT detection
Show/hide SMT text labels
Custom colors for bullish/bearish SMTs
Option to delete previous cycle SMTs (keeps chart clean)
Real-time SMT table showing all three indices
Comparison Assets:
Default: ES1! and YM1! (customize to your preference)
Set correlation type for each asset (correlated vs inverse)
Disable individual assets if needed
🔍 Understanding The Visuals
Lines:
Solid lines = Previous cycle High/Low (where price came from)
Dotted lines = EQ and Quarter levels (internal cycle structure)
Green lines = SMT divergence detected (buy/sell signal)
Labels:
▲ = Asset made higher high/low vs previous cycle
▼ = Asset made lower high/low vs previous cycle
🔺 = Inverse correlation (up when others down)
🔻 = Inverse correlation (down when others up)
SMT Logic:
If indices diverge (move opposite directions), SMT is confirmed
Bearish SMT = Highs diverge → Sell
Bullish SMT = Lows diverge → Buy
📈 Best Practices
Use on 1-5 minute charts for optimal micro cycle visualization
Combine with higher timeframe bias (Daily Cycle SSMT, session bias, etc.)
Wait for SMT confirmation before entering trades
Target previous cycle's opposite extreme as minimum profit target
Exit when opposing SMT forms or price reaches target
🛠️ Settings Guide
Essential Settings:
Comparison Symbols: Set to the indices you trade (default: ES1!, YM1!)
Show Cycle SMT: Toggle SMT detection on/off
Delete Previous Cycles SMTs: Keep chart clean by removing old SMTs
Visual Preferences:
Line Color/Width: Customize previous cycle lines
Label Style: Choose between Timeframe (22.5m), Label (descriptive), % (percentage), or Fib (0-1)
Show High/Low: Toggle previous cycle extremes
Show EQ/Quarters/Extended Ranges: Add more reference levels as needed
⚠️ Important Notes
This indicator shows previous cycle ranges, not predictive future levels
SMTs are confirmation signals for manipulation completion
Always use proper risk management and combine with your trading plan
Best results when aligned with higher timeframe directional bias
🎓 Based On ICT Concepts
This indicator implements concepts from Inner Circle Trader (ICT):
Quarterly Theory (fractal time structure)
Micro cycles (22.5-minute quarters)
Sequential SMT (mechanical divergence confirmation)
Smart Money accumulation, manipulation, distribution (AMD)
Perfect for: Scalpers, day traders, and anyone using ICT's Quarterly Theory and SMT concepts for precise intraday entries.
Note: This is a study indicator (overlay=true). It does not generate buy/sell signals automatically - you must interpret SMT formations based on your trading strategy.RéessayerGu should know it only works on the 30s chart btwPrevious Micro Cycle Range + SMTs - Indicator Description
📊 Overview
This indicator tracks 22.5-minute micro cycles within ICT's Quarterly Theory framework and automatically detects Smart Money Technique (SMT) divergences across correlated indices (NQ, ES, YM). It visualizes previous cycle ranges and identifies high-probability manipulation completions for precise intraday entries.
⚠️ IMPORTANT: This indicator is designed to work on the 30-second chart only. The micro cycle calculations are optimized for 30s timeframe data.
🎯 What It Does
Micro Cycle Tracking:
Divides each 90-minute session into four 22.5-minute micro quarters
Plots the previous micro cycle's High, Low, Equilibrium (EQ), and Quarter levels
Updates automatically as new micro cycles form every 22.5 minutes
Precise timing based on New York timezone session structure
SMT Detection:
Compares current micro cycle vs previous micro cycle across NQ, ES, and YM
Detects Bearish SMT: Divergence at highs (signals distribution down)
Detects Bullish SMT: Divergence at lows (signals distribution up)
Draws visual SMT lines with directional arrows showing correlation/divergence
Optional SMT table showing all three indices' movements in real-time
💡 How To Use It
Setup:
Switch to 30-second chart (required for accurate cycle timing)
Add indicator to your chart
Ensure you're viewing NQ, ES, or YM (or correlated futures)
For Scalpers & Day Traders:
Wait for a new micro cycle to begin (lines will refresh every 22.5 minutes)
Watch for SMT formation in the current cycle
Bullish SMT = Buy signal (previous low is confirmed, expect move to previous high)
Bearish SMT = Sell signal (previous high is confirmed, expect move to previous low)
Key Concepts:
Minimum Target: Opposite extreme of previous cycle
SMT Confirmation: One or two indices sweep a level while the other(s) fail to sweep
Best Results: Trade with higher timeframe bias aligned (Daily Cycle SSMT, session bias)
⚙️ Features
Customizable Display:
Toggle High/Low lines with multiple label styles (Timeframe, Label, %, Fib)
Optional Equilibrium (50%) level
Optional Quarter levels (25% / 75%)
Optional extended range projections (±50% to ±400%)
Adjustable line colors, widths, and label sizes
Line extension length (default: 15 bars ahead)
SMT Options:
Enable/disable SMT detection
Show/hide SMT text labels with ticker symbols and directional arrows
Custom colors for bullish/bearish SMT lines
Option to delete previous cycle SMTs (keeps chart clean)
Real-time SMT table showing all three indices' current status
Comparison Assets:
Default: ES1! and YM1! (customize to your preference)
Set correlation type for each asset (correlated vs inverse)
Disable individual assets if needed
Works with any correlated futures contracts
Debug Mode:
Toggle debug info to see current NY time, session, and micro cycle timing
Helpful for understanding cycle structure and troubleshooting
🔍 Understanding The Visuals
Lines:
Solid lines = Previous cycle High/Low (where price came from)
Dotted lines = EQ and Quarter levels (internal cycle structure)
Green lines (default) = SMT divergence detected (buy/sell signal)
Gray dotted lines = Extended range projections (if enabled)
Labels:
▲ = Asset made higher high/low vs previous cycle (correlated)
▼ = Asset made lower high/low vs previous cycle (correlated)
🔺 = Inverse correlation (up when others down)
🔻 = Inverse correlation (down when others up)
SMT Logic:
If indices diverge (move opposite directions), SMT is confirmed
Bearish SMT = Highs diverge → High is set, expect distribution down
Bullish SMT = Lows diverge → Low is set, expect distribution up
📈 Best Practices
Must use 30-second chart - indicator timing is calibrated for this timeframe
Combine with higher timeframe bias (Daily Cycle SSMT, 90-min SSMT, session bias)
Wait for SMT confirmation before entering trades (don't front-run)
Target previous cycle's opposite extreme as minimum profit target
Exit when opposing SMT forms or price reaches target
Best windows: Q2→Q3 or Q3→Q4 transitions within 90-minute sessions
Volatility injection times: Watch 09:30, 10:00, and 14:00 ET for strongest moves
🛠️ Settings Guide
Essential Settings:
Comparison Symbols: Set to the indices you monitor (default: ES1!, YM1!)
Correlation Type: Toggle "Correlated" on/off for each asset based on expected relationship
Show Cycle SMT: Enable/disable SMT detection
Show SMT Text: Toggle labels showing ticker divergence details
Delete Previous Cycles SMTs: Keep chart clean by removing old SMTs
Visual Preferences:
Line Color/Width: Customize previous cycle lines (default: black, width 1)
Label Style: Choose between:
Timeframe (shows "22.5m")
Label (descriptive: "previous micro cycle high/low")
% (shows "100%/0%")
Fib (shows "1/0")
Show High/Low: Toggle previous cycle extremes (recommended: ON)
Show EQ/Quarters/Extended Ranges: Add more reference levels as needed
SMT Customization:
SMT Colors: Customize bearish/bullish SMT line colors (default: green for both)
SMT Label Colors: Background and text color for SMT labels
SMT Table: Toggle real-time comparison table (bottom right)
⚠️ Important Notes
30-second chart required - will not work accurately on other timeframes
This indicator shows previous cycle ranges, not predictive future levels
SMTs are confirmation signals for manipulation completion, not entry triggers alone
Always use proper risk management and position sizing
Best results when aligned with higher timeframe directional bias
Monitor all three indices (NQ, ES, YM) for complete SMT picture
Micro cycles are part of a fractal structure - align with 90-min and Daily Cycle SMTs
🎓 Based On ICT Concepts
This indicator implements concepts from Inner Circle Trader (ICT):
Quarterly Theory (fractal time structure - 22.5 min micro quarters)
Micro cycles (four quarters within each 90-minute session)
Sequential SMT (mechanical divergence confirmation across correlated indices)
Smart Money AMD (Accumulation, Manipulation, Distribution pattern)
New York session timing (based on ICT's 6-hour daily cycles)
🕐 Micro Cycle Structure
Each 90-minute session divides into four 22.5-minute micro quarters:
Micro Q1: 00:00 - 22:30
Micro Q2: 22:30 - 45:00
Micro Q3: 45:00 - 67:30
Micro Q4: 67:30 - 90:00
This pattern repeats across all 16 daily 90-minute sessions (Q1.1 through Q4.4).
Perfect for: Scalpers and day traders using ICT's Quarterly Theory and SMT concepts for precise micro-level entries on 30-second charts.
Chart Requirement: 30-second timeframe only.
Note: This is a study indicator. It does not generate automatic buy/sell signals - you must interpret SMT formations based on your trading strategy and higher timeframe bias.
