Implied Fair Value Gap (IFVG) ICT [TradingFinder] Hidden FVG OTE🔵 Introduction
The Implied Fair Value Gap (IFVG) is distinctive due to its unique three-candlestick formation, which differentiates it from conventional Fair Value Gaps.
Implied fair value represents an estimated worth of an asset—often a business or its goodwill—based on the price likely to be received in a structured transaction between market participants at a specific point in time.
In the ever-evolving world of technical analysis, pinpointing price reversal points and market anomalies can significantly enhance trading strategies and decision-making for traders and investors. Among the advanced concepts gaining traction in this field is the Implied Fair Value Gap (IFVG), introduced by the renowned analyst Inner Circle Trader (ICT).
This tool has proven to be an effective method for identifying hidden supply and demand zones in financial markets, offering a unique edge to traders looking for high-probability setups.
Unlike traditional gaps that are visible on price charts, IFVG is a hidden gap that doesn’t appear explicitly on the chart and thus requires specialized technical analysis tools for accurate identification.
This hidden gap can signal potential price reversals and offers traders insight into high-liquidity areas where price is likely to react. This article will guide you through using the ICT Implied Fair Value Gap Indicator effectively, covering its settings, usage strategies, and key features to help you make informed decisions in the market.
🟣 Bullish Implied FVG
🟣 Bearish Implied FVG
🔵 How to Use
The IFVG indicator is designed to assist traders in recognizing hidden support and resistance zones by identifying Bullish and Bearish IFVG patterns. With this tool, traders can make better-informed decisions about suitable entry and exit points for their trades based on these patterns.
🟣 Bullish Implied Fair Value Gap
This pattern occurs in an uptrend when a large bullish candlestick forms, with the wicks of the previous and following candles overlapping the body of the central candlestick.
This overlap creates a demand zone or a hidden support level, which can act as an ideal entry point for buy trades. Often, when the price returns to this area, it is likely to resume its upward trend, presenting a profitable buying opportunity.
🟣 Bearish Implied Fair Value Gap
This pattern is similar but forms in downtrends. Here, a large bearish candlestick appears on the chart, with the wicks of adjacent candles overlapping its body. This overlap defines a supply zone or a hidden resistance level and serves as a signal for potential sell trades.
When the price returns to this zone, it often continues its downward trend, providing an optimal point for entering sell trades.
The IFVG indicator also includes various filters that traders can use to refine their analysis based on market conditions. These filters, including Very Aggressive, Aggressive, Defensive, and Very Defensive, allow users to customize the IFVG zones' width, offering flexibility according to the trader’s risk tolerance and trading style.
🟣 Example Trading Scenarios
Suppose you’re in a strong uptrend and the IFVG indicator identifies a Bullish IFVG zone. In this scenario, you could consider entering a buy trade when the price retraces to this zone, expecting the uptrend to resume. Conversely, in a downtrend, a Bearish IFVG zone can signal a favorable entry point for short trades when the price revisits this area.
🔵 Settings
Implied Block Validity Period: This parameter specifies the validity period of each identified block, taking into account the number of bars that have passed since its formation. Proper adjustment of this period helps traders focus only on relevant zones, increasing the accuracy of the analysis.
Mitigation Level OB : This option defines the mitigation level for supply and demand blocks (Order Blocks), with settings including Proximal, 50% OB, and Distal.
Depending on the selected level, the indicator will focus on closer, mid-range, or farther points for block identification, allowing traders to adjust for the level of precision required.
Implied Filter : Activating this filter allows traders to apply conditions based on the width of the IFVG zones. With options like Very Aggressive and Very Defensive, traders can control the width of IFVG zones to suit their risk management strategy—whether they prefer high-risk setups or low-risk setups.
Display and Color Settings : This section enables users to customize the appearance of the IFVG zones on their charts. Traders can set different colors for Bullish and Bearish zones, allowing for easier distinction and improved visualization.
Alert Settings : One of the standout features of the IFVG indicator is the alert system. By setting up alerts, users can be notified whenever the price approaches a demand or supply zone.
Alerts can be customized to trigger Once Per Bar (one alert per bar) or Per Bar Close (alert at the close of each bar), ensuring that traders stay updated on critical price movements without needing to monitor the chart continuously.
🔵 Conclusion
The ICT Implied Fair Value Gap (IFVG) indicator is a powerful and sophisticated tool in technical analysis, allowing professional traders to identify hidden supply and demand zones and use them as entry and exit points for buy and sell trades.
This indicator’s automatic detection of IFVG zones helps traders uncover hidden trading opportunities that can enhance their analysis.
While the IFVG indicator offers numerous advantages, it is important to use it in conjunction with other technical analysis tools and sound risk management practices.
IFVG alone does not guarantee profitability in trading; it works best when combined with other indicators such as volume analysis and trend-following indicators for a comprehensive trading strategy.
Ictfvg

FVG (ICT) with Swing LevelsThis indicator, called "Fair Value Gaps (ICT) with Swing Levels", overlays on the main chart and does the following:
Initial Setup:
It defines user-adjustable parameters:
lookback: Lookback period to keep FVGs visible.
swingPeriod: Period for calculating swing highs and lows.
bullColor and bearColor: Colors for bullish and bearish FVGs.
Fair Value Gaps (FVGs) Detection:
Uses a function to identify FVGs by comparing candle high and low prices.
A bullish FVG forms when the low of two candles ago is higher than the high of the current candle.
A bearish FVG forms when the high of two candles ago is lower than the low of the current candle.
Swing Levels Calculation:
Calculates swing highs and lows over the specified period.
These swing levels define the current market range.
Current Range Verification:
Implements a function to check if an FVG is within the range defined by swing levels.
This ensures only the most relevant FVGs for the current market situation are displayed.
FVG Drawing:
When it detects an FVG (bullish or bearish) within the current range, it draws a box on the chart.
Boxes extend from the bar where the FVG formed to the current bar.
Bullish FVGs are drawn in green and bearish in red (colors are customizable).
Old FVGs Management:
On each new bar, the indicator checks all existing FVG boxes.
It removes boxes that are outside the specified lookback period.
It also removes boxes that are no longer within the current range of swing levels.
Swing Levels Visualization:
Draws lines on the chart to show swing highs (in blue) and swing lows (in purple).
These lines help visualize the current market range.
Continuous Update:
The indicator updates on each new candle, constantly refreshing FVGs and swing levels.
In summary, this indicator identifies and visualizes Fair Value Gaps according to the ICT methodology, filtering them based on higher timeframe swing levels. This helps traders focus on the most significant FVGs within the current market context, reducing visual noise and potentially improving trading decision-making.

ICT MTF FVG [MK]FVGs (Fair Value Gaps) are significant levels that may act as support or resistance to price. The script finds FVGs as per ICT trading system, then plots the full FVG to the right side of the chart. FVG boxes do not change size when they are semi-mitigated as its important to know where the original FVG midpoint lies. Plotting to the right side of price allows for a cleaner chart. The script is MTF and can display FVG boxes for the following timeframes. Chart, 5,10,15,30,1hr,4hr,8hr,12hr,D,W,M.
Below shows 1hr FVGs marked out. NOTE: this is not what the script does, this is for explanation only.
Below shows what the script will do. 1hr FVGs shown on 15min chart

ICT Implied Fair Value Gap (IFVG) [LuxAlgo]An Implied Fair Value Gap (IFVG) is a three candles imbalance formation conceptualized by ICT that is based on detecting a larger candle body & then measuring the average between the two adjacent candle shadows.
This indicator automatically detects this imbalance formation on your charts and can be extended by a user set number of bars.
The IFVG average can also be extended until a new respective IFVG is detected, serving as a support/resistance line.
Alerts for the detection of bullish/bearish IFVG's are also included in this script.
🔶 SETTINGS
Shadow Threshold %: Threshold percentage used to filter out IFVG's with low adjacent candles shadows.
IFVG Extension: Number of bars used to extend highlighted IFVG's areas.
Extend Averages: Extend IFVG's averages up to a new detected respective IFVG.
🔶 USAGE
Users of this indicator can primarily find it useful for trading imbalances just as they would for trading regular Fair Value Gaps or other imbalances, which aims to highlight a disparity between supply & demand.
For trading a bullish IFVG, users can find this imbalance as an area where price is likely to fill or act as an area of support.
In the same way, a user could trade bearish IFVGs by seeing it as a potential area to be filled or act as resistance within a downtrend.
Users can also extend the IFVG averages and use them as longer-term support/resistances levels. This can highlight the ability of detected IFVG to provide longer term significant support and resistance levels.
🔶 DETAILS
Various methods have been proposed for the detection of regular FVG's, and as such it would not be uncommon to see various methods for the implied version.
We propose the following identification rules for the algorithmic detection of IFVG's:
🔹 Bullish
Central candle body is larger than the body of the adjacent candles.
Current price low is higher than high price two bars ago.
Current candle lower shadow makes up more than p percent of its total candle range.
Candle upper shadow two bars ago makes up more than p percent of its total candle range.
The average of the current candle lower shadow is greater than the average of the candle upper shadow two bars ago.
where p is the user set threshold.
🔹 Bearish
Central candle body is larger than the body of the adjacent candles.
Current price high is higher than low price two bars ago.
Current candle upper shadow makes up more than p percent of its total candle range.
Candle lower shadow two bars ago makes up more than p percent of its total candle range.
The average of the candle lower shadow 2 bars ago is greater than the average of the current candle higher shadow.
where p is the user set threshold.
🔶 SUPPLEMENTARY MATERIAL
You can see our previously posted script that detects various imbalances as well as regular Fair Value Gaps which have very similar usability to Implied Fair Value Gaps here:

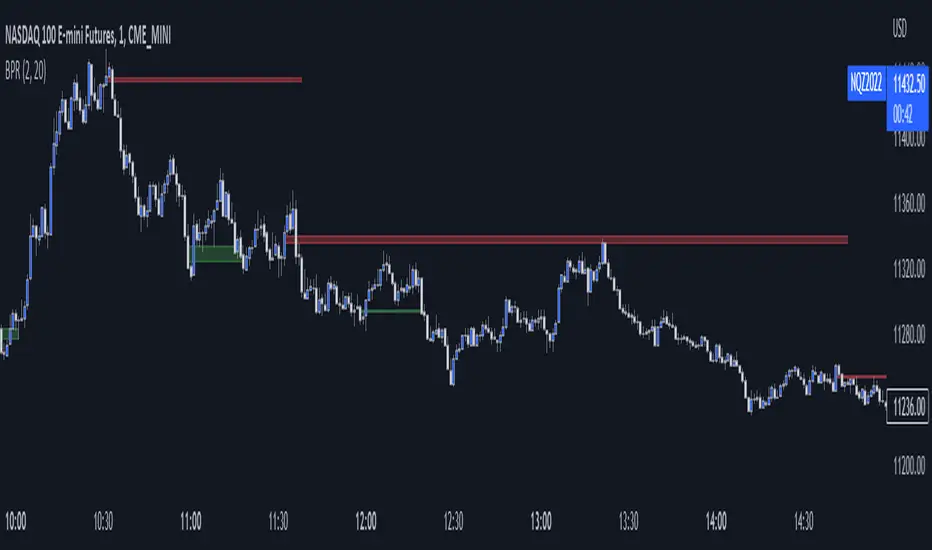
Balanced Price Range (BPR)This script finds BPR's, which some simply refer to as a "double Fair Value Gap" (FVG). In a BPR, there is an overlapping vertical area between a recent bullish and bearish FVG. You may tune the parameters to filter out smaller FVG's or BPR's, as well as how far back the indicator must look to find a matching pair.
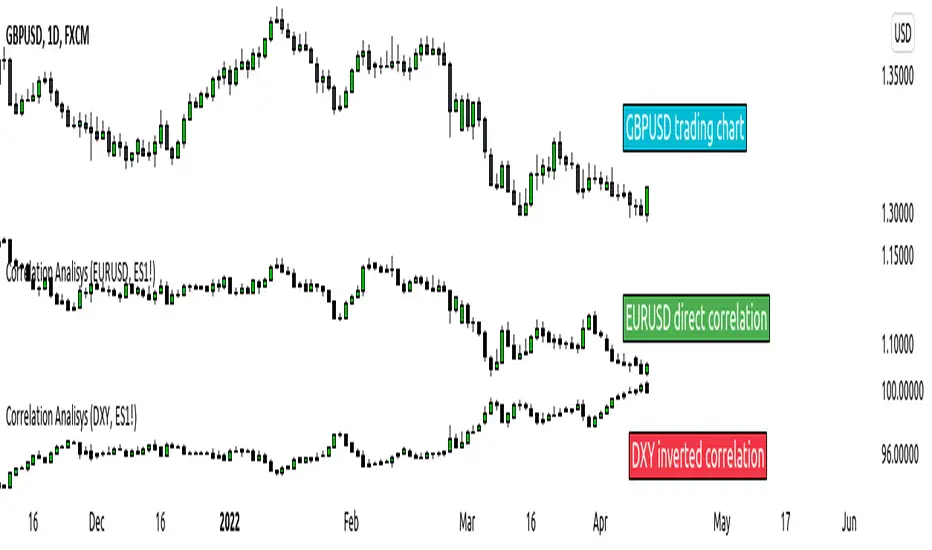
ICT index correlated market indicatorThis is not a real indicator, but is what ICT use as indicator for trading futures indexes.
it can only display SP500, Dow Jon Industrial Average and Nasdaq, if someone want other market can copy the code and change some parameters (is more easy than it can appear)
A good idea is using this other market on backtest to confirm the divergence idea of Linda Raske, than use it to spot quickly in real market.
Another idea published by ICT is the "hidden entry pattern", the entry signal appear in ES or YM but I trade NQ for volatility, so I use the trigger of SP500 or Dow to enter in Nasdaq.
Rember always don't trust anybody, do your own backtest and research!