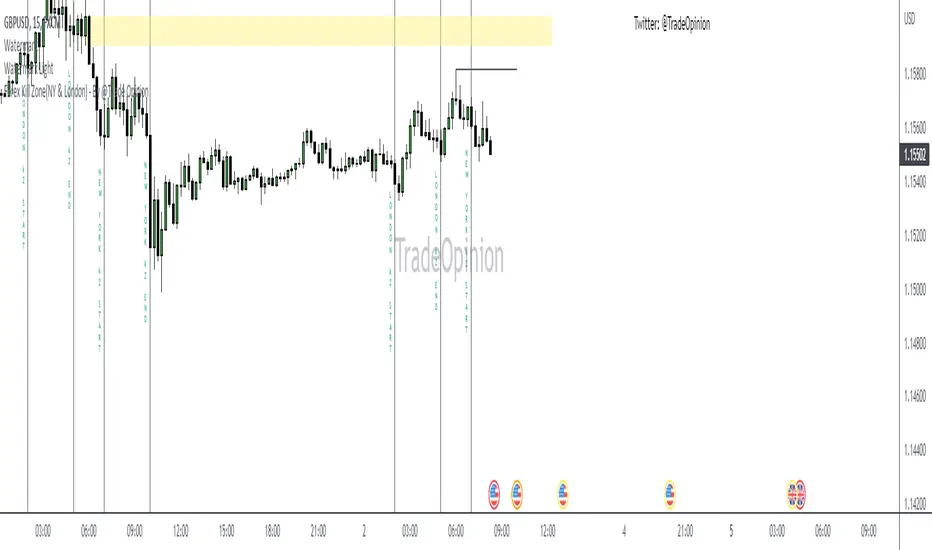
Forex Kill Zone(NY & London) - By @Trade OpinionThis indicator draws the New York & London kill zones for Forex Trading.
Killzone
ICT Killzone [Forex Edition]This indicator show in different way the bank session teached by ICT in his channel (Asian Range, London Open, New York Open, London Close).
The user have the opportunity to change the visualization from a beacon to a box, and is possible to show the amount of pips of box range with the "info" check.
If something isn't clear comment below and I will answer as soon as possible.

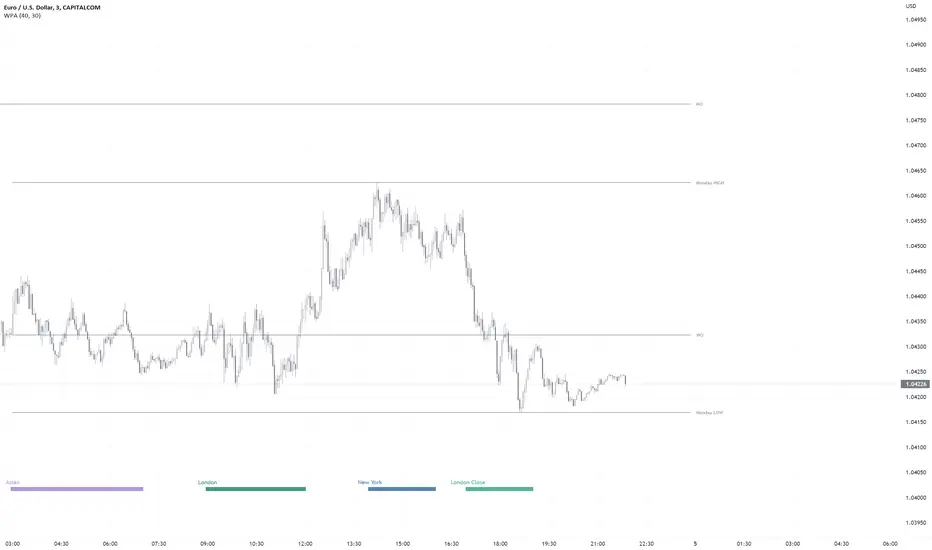
WPA OpeningsFeatures
- Displays the now and previous days, weeks, months, years (opens&highs&lows&eq)levels, Monday Range (high&low&eq), ATH Level.
PA Levels on every timeframe(It's like PYO in 1minutes chart)
Settings:
Hide and show separately.
Change color.
Line extension.
- Displays London/NY/Asian Killzones very simplified way ***w/Unique Concept.
Killzones only on timeframes lower than 30minutes (you can modify this in the settings as you wish).
It's not depended on your tradingview accounts time settings, so the killzones always stay at the right place in the chart.
The times of each killzone come from the education material of ICT.
Closed during weekends.
Settings:
Hide and show separately.
Change color separately.
- Only (All-In-One)Price Action indicator you need.
Sessions & ICT Killzones (0xCryptoVince)Sessions and ICT Killzones
All in one session and killzone script for FX or Crypto markets. It includes London, New York and Asia Sessions and Killzones.
Features
Uses UTC timezone so no timezone correction needed
Includes London, New York and Asia sessions
Includes ICT killzones
Optionally include weekends for session or killzone separately
Customize line style, width and color
Customize colors for sessions and killzones
Session highs/lows displayed on chart as a line or a box
Killzones displayed on top or bottom
Price Action All In One IndicatorIf you are the one who is "Price Action" style & does not want to use many indicators or complex indicators or you are an ICT (The Inner Circle Trader)
student or ICT charter, this simple beautiful All In One Indicator is right for you.
The indicator has the following functions.
TIME ZONE SETTING
The default timezone is New York Time GMT-4, if you leave the time zone setting blank, it will use the symbol timezone. Note that the trading time changes with one hour delay in winter. so if you just trade forex, and leave the time zone setting blank, TradingView will adjust the symbol timezone automatically for you or don't forget to change the timezone setting GMT-4 or GMT-5 depending on daylight saving time.
STATISTIC PANEL
You can choose which panel to show through settings.
Session Info Panel : pips info of ADR, Asian, London, and New York sessions.
Trend Panel : showing trend (up/down) of
5m/15m/1h/4h/D/W time frames (TF)
4MA (default values: SMA with lengths: 20–50–100–200)
Money Management Panel : in trading, money management is very important. Just put the % risk, & stop loss value below, the indicator will calculate a suitable size/amount for each trade.
Size by Lots: input stop loss in pips
Size by Units: input stop loss in % (of price)
(*)Units size is calculated by % stop loss & current bar close price. You have to determine a stop-loss price to convert to % stop loss by yourself.
TIME SEPARATORS
We can choose which time separators we want to display. The indicator has 5 options: Anchor Time/Day/Week/Month/Quarter. Of course, we can choose to show just one or all 5 of them.
With Anchor Time you can choose which time you want to draw a vertical line for better timing analysis. This can show up to 2 Anchor Time lines. The default values are 00:00 (New York Midnight Opening) and 08:30 (New York Session Opening). You also have an option to show the past lines or not.
About Day Separator, cause TradingView has supported Session Breaks in Setting but if you don't like to use it or when enabling, it distracts you, you can use mine. My favorite trading dates are Tuesday & Wednesday.
PRICE LEVELS
For intraday trading, the high/low/close of the previous day, the previous week, ADR (default period is 5) are very important key levels. You can choose which one you like to show for better analysis. Of course, you can change the color & style of the lines. This is also my favorite indicator.
This indicator also has an option to show up to 2 price lines at a specific time, you can choose the price type (high/low/close/open) that you want to display. The default time values are:
Specific Time 1: 0:00. (New York Midnight Opening Price)
Specific Time 2: 8:30 am. (New York Session Opening Price)
ACCUMULATION ZONE
The market tends to reprice the higher/lower to the old high/low or imbalance/fair value price to promote buy/sell stops or to provide smart money pricing for long/short entries. Typically, it redistributes quickly and you must learn to anticipate them at key levels intraday. Weak short/long holders will be squeezed in the retracement.
Except for the open price, the price changes continuously until the closing time, so the accumulation area can also be changed in real-time, but if you combine it with other information when analyzing, you can predict/determine whether the zone has been established or not with high probability. In short, price needs time to be accumulated, I usually don't pay attention to this daily zone till London open/close or New York sessions
Not only daily zone, but the indicator also supports higher timeframes accumulation zone from
SESSION & STD
There are 3 sessions: Asian, London, New York. The default values are below (New York Time).
Asian: 19:00 ~ 00:00
London Open (London KillZone): 01:00 ~ 05:00
New York Open (New York KillZone): 07:00 ~ 10:00
If you do not want to show the label, just leave the label values blank or change them to whatever you want.
This is one of my favorite functions. I use it on 15m, 30m, 1h TF for Forex intraday trading. My favorite trading sessions are London Open & New York Open.
You also can choose to show or not Standard Deviations (STD). The default values are set for Asian Range STD and max STD levels can be shown are 5. I use the following 3 types of STD (New York Time):
CBDR (Central Bank Deviations) STD: 14:00 ~ 20:00
Flout STD: 15:00 ~00:00
Asian Range STD: 19:00 ~ 00:00
LOOKBACK HIGH/LOW/MID
Can show high/low/mid of the data ranges on the daily/4h chart. The default values are:
- 20–40–60 days back from today for daily TF.
- 30–60–90 bars back from the latest bar for 4h TF.
The default anchor bar for calculating the lookback is the latest one but with:
- 4h TF: we can change the lookback from the 1st day of the week.
- Daily TF: we can change the lookback from the 1st day of the month.
The indicator also has options showing the high/low/mid (equilibrium level) lines for better analysis. Especially, on daily TF, we have the option that can show up to 4 lines (25% for each one) of the data range.
Of course, you can change the colors or the style of the high/low/mid lines.
The lookback can be shown on the lower TFs for better detection when the market structure is shifted.
MAGIC BARS
Fractal bar : The bar's color is changed when the divergence occurs between the price & RSI. You can change the RSI period (default value is 14) & RSI source. (open/high/low/close,…)
Imbalance bar or liquidity void or fair value gap - whatever you call it. This is my favorite indicator when trading on all TFs.You can choose to extend the last n imbalance bars if you like in the settings. I make sure I covered all cases of imbalance/fair value gap.
OLD HIGH/LOW
First, this function is not used as the common Support & Resistance that retail traders usually use, so I call it Old High/Low. I usually use it in 2 ways:
Detect the next buy/sell stops that Market Makers aim to manipulate.
Detect whether market structure shifted or not (Break of structure)
In settings you can:
Set the period to detect high/low levels, the default value is 10. My other favorite values are 6 & 2.
On a lower time frame, you might want to set it to a large number to remove noise.
On a higher time frame, a small number is enough, I think.
Choose the numbers of the last lines you want to show on your chart.
Of course, the style of lines can be changed easily.
TRENDLINES
A very simple trendline with default pivot left strength is 10.
By default, trendline uses high/low price but you have the "Using close price" option.
LINEAR REGRESSION CHANNEL
The Linear Regression Channel is a three-line technical indicator used to analyze the upper and lower limits of an existing trend. It is a statistical tool used to predict the future from past data and is used to determine trend direction or when prices may be overextended.
You can choose
To fill the background or not
To show inner/outer lines or not
To change the colors/line styles of upper zone, lower zone, upper lines, lower lines, midline
DIRECTION BOX
Working on all TFs, this looks like the same with lookback function but if you would like to display them in a box for easily focusing/comparing with other symbols or for detecting divergence in a specific period. The indicator also has a setting to show or hide lines connecting between lows or highs.
Another example of how I use High/Low connecting lines to detect divergence between S&P 500 and NASDAQ 100.
ZIG ZAG
Can show up to 2 ZigZag lines.
This is suitable for traders who have difficulty in detecting key levels (recent high/low) of the prices to confirm market structure or just for drawing Fibonacci easily at those levels.
MA (Moving Average)
I believe that this is one of the most used indicators for every trader. There are 5 types of MA to choose from: EMA, SMA, WMA, VWMA, SMMA(RMA).
This can show up to 4 MAs. You can choose the source (close/high/low,…) for each one. My favorite values are 34 & 89 EMA.
This indicator also supports MA Bands. You can select which MA you want to display the bands, and the "width" of the bands can be changed via the settings.
WATERMARK
It's just a simple function but I think it's very useful for those who want to add Copyright info to the chart, to prevent others from copying it.
Others/known issues/limitations
In forex or stock (things that are traded only on weekdays), TradingView's does not include the latest bars till Monday so the Day Separator cannot fill that space. Because TradingView deals with those bars as Sunday's ones so I set the color of Sunday the same as Friday for good UI/UX. On Crypto charts, the indicator shows without problems.
If you see "Internal server study error", please try closing the current TradingView tab in your browser and reopening it in a new tab. The error will disappear.
Because TradingView does not provide any detailed error information when such "general error" occurs. It's very difficult to detect which function is causing this error or is there something that caused TradingView "overloaded" through a long time running/loading on that tab? Honestly, I don't know exactly the cause, but in my experience, this error often occurs in the following cases:
When you have the TradingView Tab open for hours. In my case, I usually leave TradingView tab open overnight & when I come back the next day, this error might appear. (I'm a Mac user & I almost never shut down my Mac)
When you change settings too many times, especially settings of drawing objects like line width in a using session, it might cause this error.
So, after changing the setting or when you come back for the next trade, please save & close that TradingView tab, and then open a new one, everything will work fine.
You can see the images below that show I have tested my indicator from 1-minute time frame, enabled all functions, change every setting to max values & everything still works fine.

Deluxo Dow Kill ZonesCAPITALCOM:US30
Edit* under settings remove the plot line its not needed.
Deluxo Capital
Dow Kill Zone Indicator
PLEASE READ ALL
About: This will help you find large moves that happen often on US30. This will work for gj and probably other indices but I've designed this to work for US30 day trades.
If I see a trade I will scalp within the blue zone, besides that the best trades are anywhere outside the colored zones and you will generally find good entry's/exits just as those zones end.
So you're just scalping between these zones. Stay with me tho.
How to use: You can trade the blue session or wait it out because that's a high risk area but with time you will enjoy trading it as you get to know how price reacts or how the order blocks/order flow looks.
This works for: Day trades mainly but can be for swing trades.
Time fame USE: 1-15min I like 5-15m
Red Zone = This zone I like to enter shorts or longs all the way to the blue zone depending how price action reacted to the Asian high or low. Was the Asian high taken out?/was the Asian low taken out? Trades are taken around when this zone ends down to the blue zone.
Blue Zone = Modified New York Session hours High vol window good scalps or enter trades after the blue zone to the next zone the
Gray zone = 30 min Pre-Spread Warning. This zone is always the best time to exit your trades its just grays out 30 min before spreads open up. Some of the best trades are after the blue zone to this gray zone.
EXTRA* I also use this indicator and I recommend you to use this aswell these two together work great I use them daily.
AsiaSessionHighLowMidLines by marekmajer
This is my personal system for scalping dow. I hope this helps you as much as it helps me and I'm sure as you see how price reacts you too can see the value in this. Please enjoy!
You can adjust the colors and remove the plot line over the candles I don't code well this is my first time I just tossed this together and I can't remove the plot line so just uncheck it.
Thank you
Deluxo Capital

Market Sessions (including extended hours) by Anche█ MARKET SESSIONS BY ANCHE
this script allows you to define up to 4 different sessions and plot those on your chart. It makes it easy to see when these sessions started and ended and what the price level is when the session opened. It's for example beneficial to see when sessions overlap, because at those times there might be more volume , because more people are active within a market.
█ CONCEPTS
• plotting these sessions onto a chart can help you see overlap of 2 or more sessions. An overlap means more market participants, which can hint to an increase in volume .
• when the indicator shows all historic sessions, you can spot certain trends, for example that an asian market is generally more bearish and EU more bullish , or vice versa.
█ FEATURES
• up to 4 sessions
• customisable session labels
• customisable session times
• extended hours (on/off)
• timezone sync
• show past sessions
█ VISUAL FEATURES
• session plotted by top + bottom line or a box
• show session open
• customisable colors per session
• customisable lines (width/style/color)
• different visual settings for extended hours
• customisable label sizes
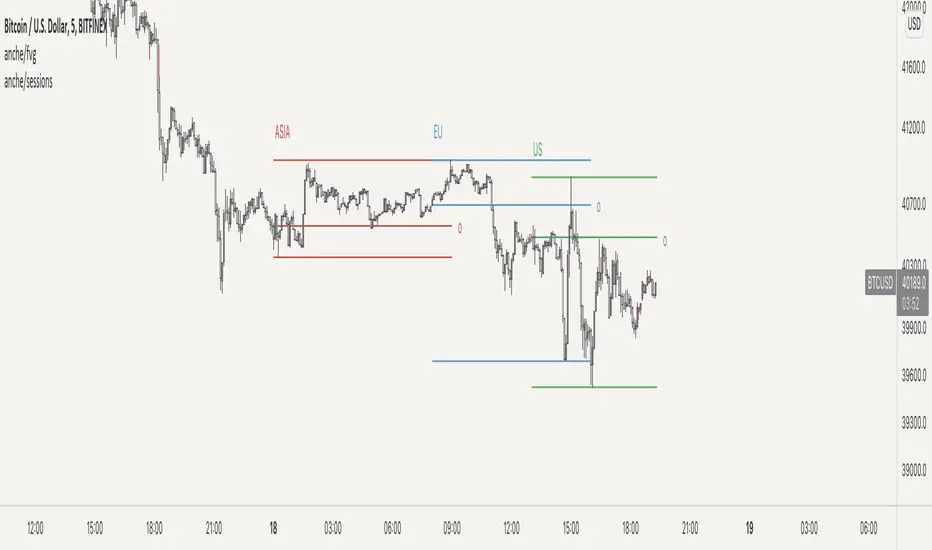
FX Sessions - All in OneFX Sessions - All In One
This Script offer a wide variety of goodies
SESSION OPEN
it will draw a line for the TOP, MID and LOW of the asian session (you can adjust the hours of the session)
It will draw a line for the TOP and LOW of the London Session (you can adjust the hours of the session)
It will draw a line for the TOP and LOW of the NY Session (you can adjust the hours of the session)
SEPARATORS
while on lower timeframe, you will have a separator for days that occurs at midnight NY time
While on Daily timeframe, you will have a separator that will separate every month, on the 1st trading day of that given month
IMBALANCE
The candle leaving imbalance (a candle where there is a portion that is not matched with a price action left or right)
NY Midnight opening price
a dotted line will be drawn (up to 500 bar limitation) from NY open until it reaches either the 500 bar or the end of the day.
on lower timeframe (below 3 minutes) the bar will not reach the end of the day

[astropark] Kill ZonesDear Followers,
today I'm glad to present you an indicator which highlights for you the most important market Kill Zones .
This indicator will color background of the time sessions when Asia, London and New York sessions are going to be most active .
This way you can understand easier what istitutions and big hedge funds made during the session.
You can change colors and transparency in the indicator options, default colors are yellow for Asia, blue for London and red for New York sessions.
You can enable the indicator to show background also during the weekend (disabled by default).
This indicator works on all markets, I suggest not to use it above 1h timeframe, 5m-15m is great.
This is a premium indicator , so send me a private message in order to get access to this script.

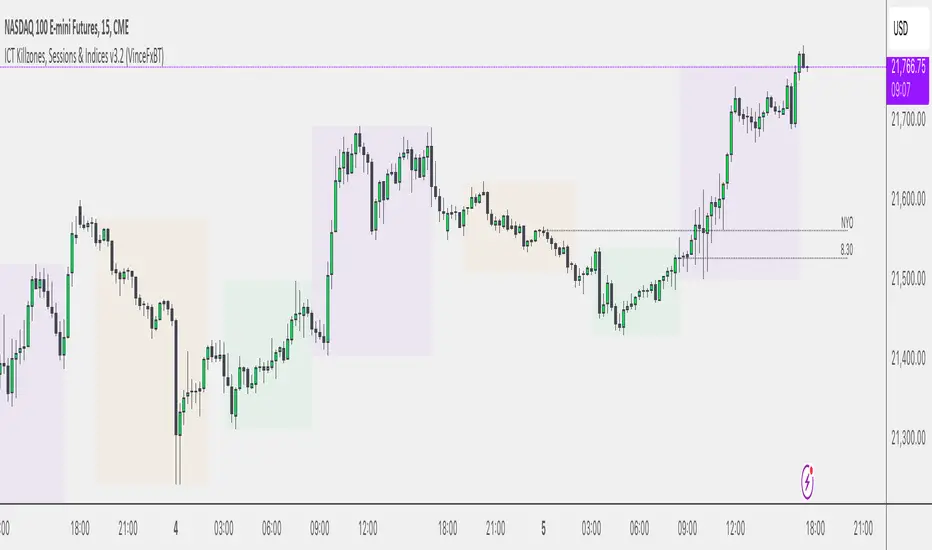
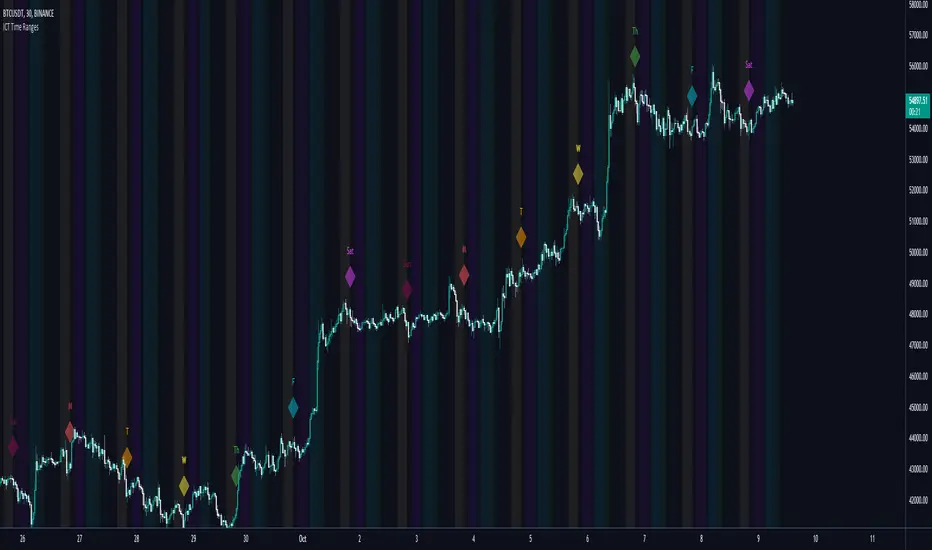
ICT Time RangesICT Time Ranges is a concept around the fact that price likes to show volatility spikes in certain times of the day.
Although there are many other scripts such as that revolve around this concept, the difference between this one and some of the others out there is the fact that this code specifically focuses on the ranges like New York, London, Asia, and ICTs concept behind having a "True Day Range". Also, prior scripts draw horizontal lines to delineate the High and Low of the Day. Although this is useful in some cases, I find it to clutter up the chart too much for my liking, so this script negates any of that and simply prints a box in the parameters given within the settings pop-up. This also allows you the fact of having a shape and letter(s) marker for when a new day starts at 0:00.
With this script, you can enable / disable times of the day for:
- London Session
- New York Session
- London Close Session
- Asia Session
- "IPDA" True Day
You can also change the times that these sessions will update to, along with the opacity and color that they print to mark out these times / ranges. The same can be said with the "Day of Week" markers, which can be color coded and show different shapes / formats to your liking.
I find that putting the Session boxes opacity to 7-8% and the day of week markers to 20% is best as this makes them visible enough to see while also keeping it easy on your eyes to analyze your charts.
Overall, this script was based around specific concepts I liked from other individuals' scripts such as @BryceWH and @AvniPiro , but that are tweaked to what I personally find as most beneficial. To see others scripts like this one, you can search for "ICT Killzones" in the public script library!
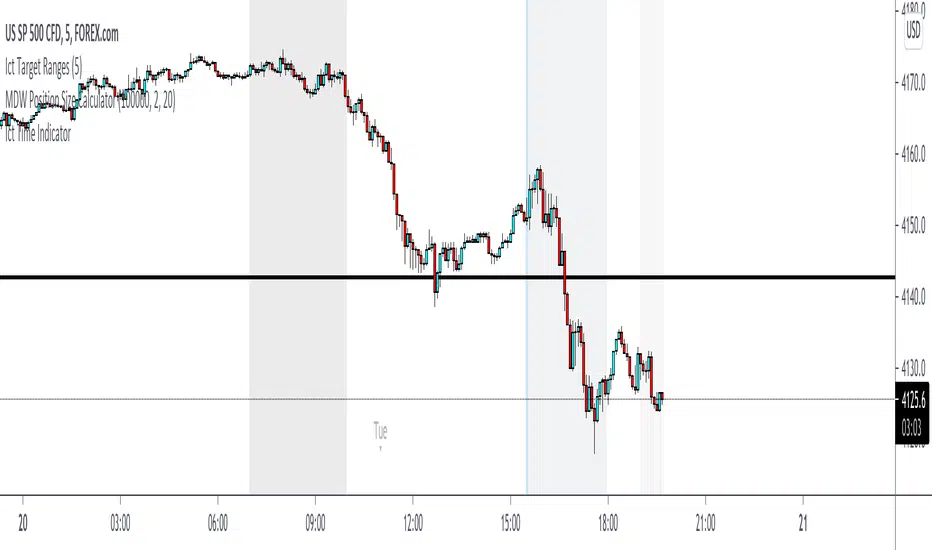
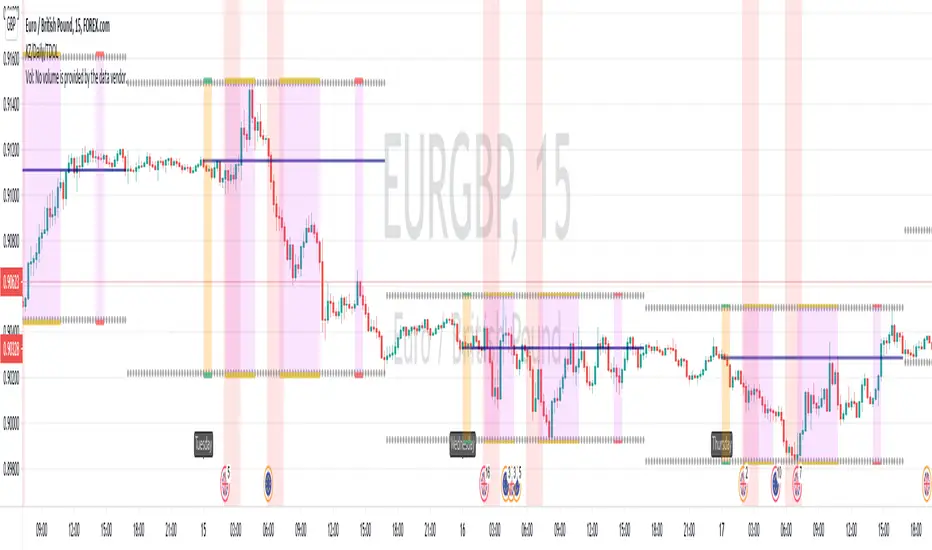
Ict Time IndicatorIct Time Indicator
Forex Market or DXY:
This indicator plots a blue zone every day at midnight NY time. Which is used as a start of a trading day.
This indicator shows the days of the week.
The dark blue background is the first day of the week.
The light blue background are the start of the days in the week except for Monday
The first gray zone from the start of the day highlights the London Session from 2am to 5am
The second gray zone from the start of the day highlights the NY Session from 7am to 9am
The third gray zone from the start of the day highlights the London Close from 11am to 12am
Bond Market (symbol: ZB, ZN, ZF)
Start of the day (blue zone): 8am EST
First zone: 1am to 4am (London Session)
Second zone: 7am to 11am (NY am session)
Third zone: 11am to 2pm (NY pm session)
Index Futures (symbol: ES, NQ, YM)
Start of the day (blue zone): 5am
First zone: 1am to 4am (London Session)
Second zone: 8:30am to 11am (NY am session)
Third zone: noon to 3pm (NY pm session)
Currency Futures (symbol: 6A, 6B, 6C, 6E, 6J, 6N, 6S)
Start of the day (blue zone): 5am
First zone: 1am to 4am (London Session)
Second zone: 6am to 9am (NY Session)
Third zone: 10am to 11am (London Close)
Time is dependent on the trade session of the IBM symbol.
Properties available:
- Show Killzones (Show the gray zones: London session - NY session - London Close as described above)
- Show Days Of Week (Show the blue zones + days of the week)
- All colors are available to change
The indicator checks the timeframe you are in to visualize the zones to keep everything clean.
The name ‘ict’ in the title of this indicator refers to ‘The Inner Circle Trader’. The Inner Circle Trader is my trading mentor and this indicator is based upon his ideas. I am proud to be one of his students. I hope this indicator can help more students!
Sessions (Nephew_Sam_)Indicator combines the 3;
1. 3 Sessions - with an option to set your own times
2. 4 Killzones- with an option to set your own times
3. Daily Dividers
If you dont want any of the the above or want to decrease your killzones, just uncheck the relevant checkbox under settings - inputs/colors.
Note: Most of this code it taken from other open source scripts, therefore I will leave this as an open source code too.

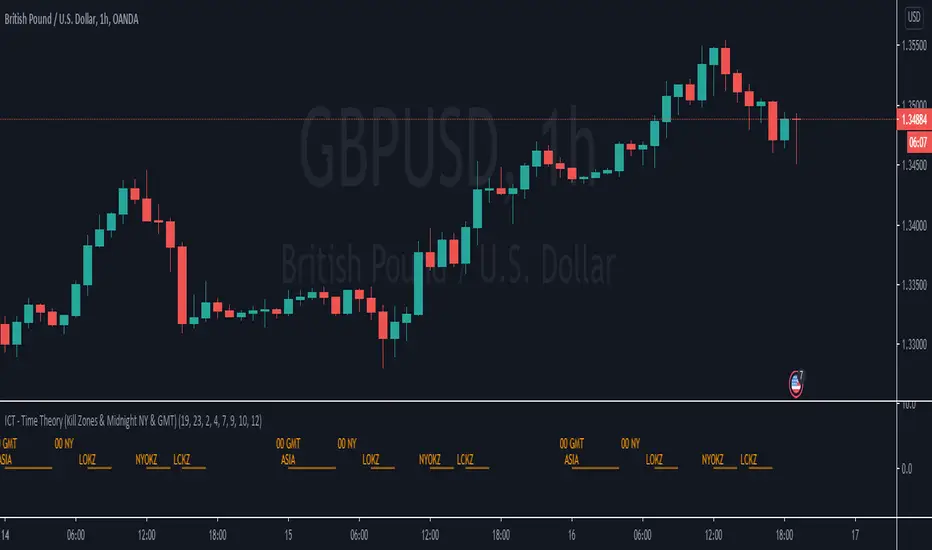
ICT - Time Theory (Kill Zones & Midnight NY & GMT)This script helps you to mark the following automatically instead of doing it every day:
Midnight GMT;
Midnight NY;
Asia Session;
London Open Kill Zone;
New York Open Kill Zone;
London Close Kill Zone;
This helps if you trade intra-day with this ICT concepts.
It draws a horizontal lines instead of painting the background. (There is a limitation of around 50 vertical lines per script)
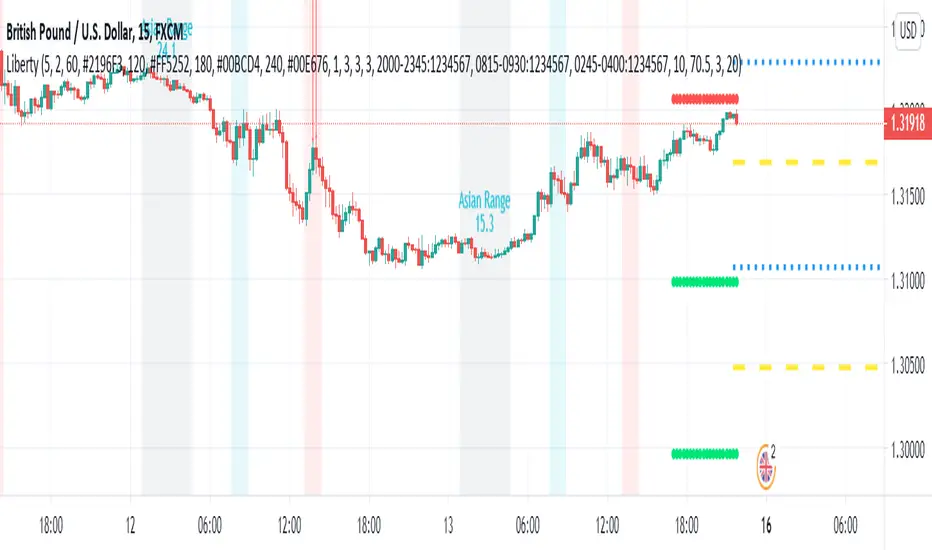
Liberty Scanner This indicator scans the market for New York session entries based on trend and fibs.
The indicator also detects killzones, which are basically supply and demand zones. We like to think of these as areas of which banks are placing their orders.
The indicator also gives you the Asian range and how many pips the market has moved for the Asian range, that is what determines whether we are in normal market conditions or not.
We also made it to where you can see yesterdays highs and lows, when you understand the market directions then you typically know which swing (high or low) will be broken.
The indicator also has an ADR (Average Day Range) feature where it calculates the "average" amount of pips the market moves per day based on the previous 3-10 days of the market volatility.
The main thing which gives us signal for entry is the New York session Fibonacci levels in which it automatically scans for the nearest 15 minute swing and it'll give you an entry based off of that.
*This indicator in no way is meant to be 100% accurate, please do your own analysis before placing any trades and trade with proper risk, as this market is extremely volatile and risky. Past profits don't guarantee future results*
FOR ACCESS: Please send us a private message to gain access to this indicator.
PT Crypto Kill ZonesVersion 1.0 of our PT Crypto Kill Zones indicator helps create a visual of specific times throughout the trading day, which we can expect volatility. The market moves within particular sessions. These sessions are broken up as such in three segments, NY, London & Asia.
Toggles -
Market Open highlights the opening of each market.
Daily Zone – highlights a period around the daily crypto candle close.
NY Open Zone – highlights a period around the NY market open.
NY Close Zone – highlights a period around the NY market close.
London Open Zone – highlights a period around the London market open.
London Open Zone – highlights a period around the London market close.
Asia Zone – highlights a period around the Asia market open.
Preferred zones are settings we came up with by running backtests to figure out which periods are close to the kill zones, which offer a better reaction.
Strategy: Use the sub 1h time-frame (30m is ideal) and scalp the London & NY zones with the PT Liquidity & PT Buy/Sell indicator.
This Oscillator was built around our buy sell & Liquidity indicator for scalping. It is included as part of the library. Just message us for access!

KILLZONE/DAILY BY jahjahblessedThis is the Killzone Zone market open London kill Zone, New York Kill Zone and Kill Zone Close, it also includes the Days of the, for the Snipers taking your shot with time and price.
KZ SessionsThis shows killzone sessions for London NY, Asia sessions.
In addition to the opening hours of session, the pre-market and closing time periods are also marked with a grey color
Generally these are consided period of high activity and can experience more volatility in these periods
I also have enabled it to display the session times even on weekends. There is no session open at such times but heightened activity is noticed in these periods even on weekends.
If want to disable showing it on weekends, then remove ":1234567" from all the lines in code

ICT Killzone For Crypto Markets.Adjusted for Crypto 24/7 markets
Adjusted for UTC
i have hidden the asian open range and daily bars on my charts , you can choose to have them on
Less screen clutter
London Open 8:00 - 4:30 - Killzone 7:00 - 9:00
NewYork Open 9:30 - 4:00 Killzone 8:00 - 10:00
Shanghai open 9:15 Killzone 8:00 - 10:00
NOT MY ORIGINAL SCRIPT. JUST MODIFIED VERSION

How To Show Vertical LinesExample of various methods to show dashed or solid vertical lines on chart based on using either session or time.
Credit for line method goes to midtownsk8rguy ->
Credit for plot method goes to PineCoders -> www.pinecoders.com
Special thanks to LucF, midtownsk8rguy, and PineCoders for permission to use their work.
NOTICE: This is an example script and not meant to be used as an actual strategy. By using this script or any portion thereof, you acknowledge that you have read and understood that this is for research purposes only and I am not responsible for any financial losses you may incur by using this script!

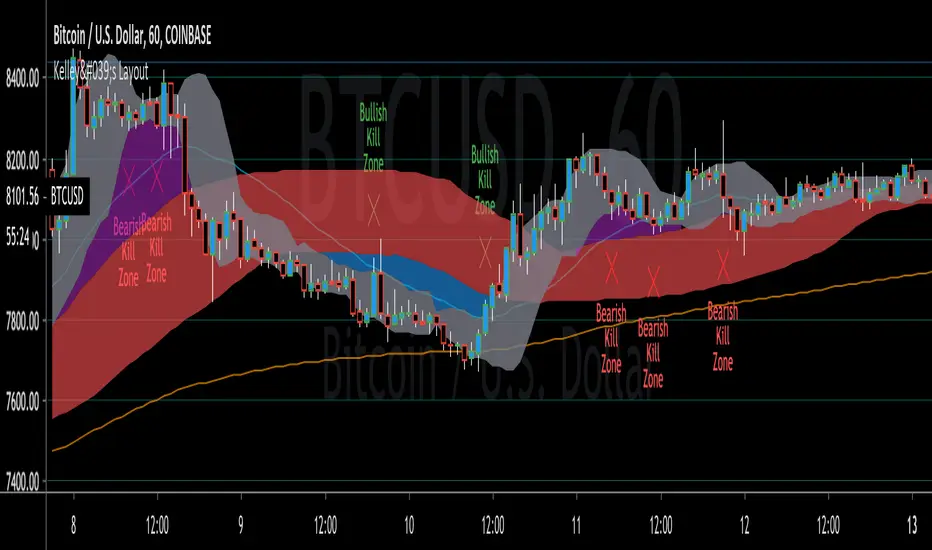
Kelley's LayoutWe use our own proprietary script with a collection of technical indicators that show support and resistance levels as well as momentum and trend direction. The Kelley’s Layout took over 2 years to prefect the formula that allows us to scalp the market in a safe conservative manner. However we do use Moving Averages, Moving Average Convergence Divergence ( MACD ), Simple Moving Average , Golden Ratio, Fibonacci Retracement , Relative Strength Index , and Gann Fan and Square as filters. Using these many filters is the reason why it took us over 2 years to prefect.
1 ~ Simple Moving Average
2 ~ Weighted Moving Average
3~ Convergent Divergent Alpha (Slow)
4~ Convergent Divergent Omega (Fast)
5 ~ Kelley’s Layout Proprietary Bearish Kill Zone
6 ~ Kelley’s Layout Proprietary Bullish Kill Zone
Crypto Daily-Weekly Range + KZsWeekly OHL + Daily OHL + Intraday Killzones
For markets that open the daily candle at 12AM UTC

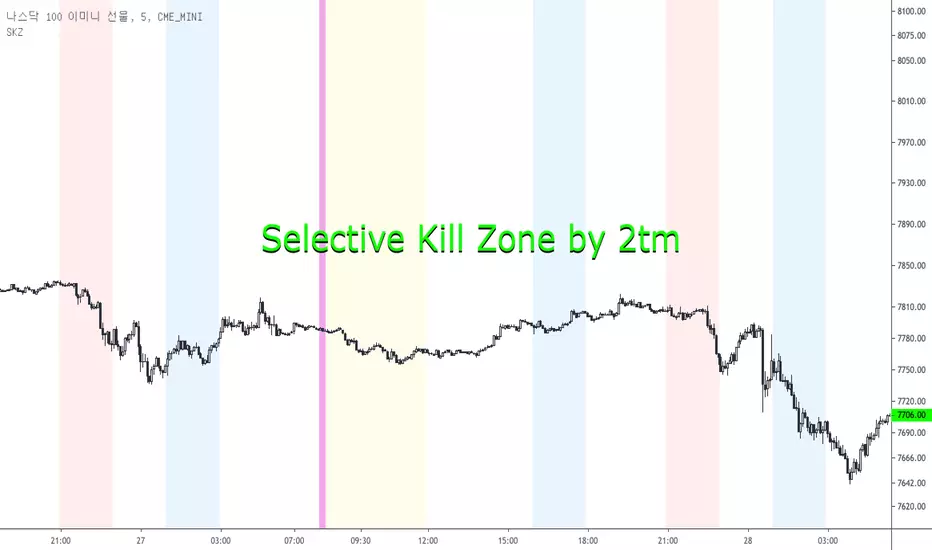
Selective Kill Zones by 2tm1. I think if you know how to use Kill Zone the this is very helpful to you but the Newbies must find out how to use the Kill Zone.
2. I've colored each Time Zone based on Olympic Flag, So the Yellow is Asia KZ, the blue is Europe I mean London and the Red is America for New York KZ.
3. There are Session Opens / Closes and Market Sessions in each Time Zone.
4. If you need adjust for Summer Time, then just click check box.
5. There are some options for the Period, that is a day, 3 days, a week, a month and a year.
6. It shows on weekends, so you can use on the crypto markets also.
7. Thanks and I hope your successful investment.
Megalodon Pro Utility PanelHow to use?
Simply, add the indicator and follow the timing and kill zone signals on the screen.
This indicator is designed for Daily time frame for longer term analysis and 1 minute time frame for shorter term analysis.
Turn on the kill zone feature for overlaying different kill zones.
Turn on Day Trading checklist feature for becoming a better Day Trader using Megalodon indicators.
