Multiple Non-Linear Regression [ChartPrime]This Pine Script indicator is designed to perform multiple non-linear regression analysis using four independent variables: close, open, high, and low prices. Here's a breakdown of its components and functionalities:
Inputs:
Users can adjust several parameters:
Normalization Data Length: Length of data used for normalization.
Learning Rate: Rate at which the algorithm learns from errors.
Smooth?: Option to smooth the output.
Smooth Length: Length of smoothing if enabled.
Define start coefficients: Initial coefficients for the regression equation.
Data Normalization:
The script normalizes input data to a range between 0 and 1 using the highest and lowest values within a specified length.
Non-linear Regression:
It calculates the regression equation using the input coefficients and normalized data. The equation used is a weighted sum of the independent variables, with coefficients adjusted iteratively using gradient descent to minimize errors.
Error Calculation:
The script computes the error between the actual and predicted values.
Gradient Descent: The coefficients are updated iteratively using gradient descent to minimize the error.
// Compute the predicted values using the non-linear regression function
predictedValues = nonLinearRegression(x_1, x_2, x_3, x_4, b1, b2, b3, b4)
// Compute the error
error = errorModule(initial_val, predictedValues)
// Update the coefficients using gradient descent
b1 := b1 - (learningRate * (error * x_1))
b2 := b2 - (learningRate * (error * x_2))
b3 := b3 - (learningRate * (error * x_3))
b4 := b4 - (learningRate * (error * x_4))
Visualization:
Plotting of normalized input data (close, open, high, low).
The indicator provides visualization of normalized data values (close, open, high, low) in the form of circular markers on the chart, allowing users to easily observe the relative positions of these values in relation to each other and the regression line.
Plotting of the regression line.
Color gradient on the regression line based on its value and bar colors.
Display of normalized input data and predicted value in a table.
Signals for crossovers with a midline (0.5).
Interpretation:
Users can interpret the regression line and its crossovers with the midline (0.5) as signals for potential buy or sell opportunities.
This indicator helps users analyze the relationship between multiple variables and make trading decisions based on the regression analysis. Adjusting the coefficients and parameters can fine-tune the model's performance according to specific market conditions.
Linear

regressionsLibrary "regressions"
This library computes least square regression models for polynomials of any form for a given data set of x and y values.
fit(X, y, reg_type, degrees)
Takes a list of X and y values and the degrees of the polynomial and returns a least square regression for the given polynomial on the dataset.
Parameters:
X (array) : (float ) X inputs for regression fit.
y (array) : (float ) y outputs for regression fit.
reg_type (string) : (string) The type of regression. If passing value for degrees use reg.type_custom
degrees (array) : (int ) The degrees of the polynomial which will be fit to the data. ex: passing array.from(0, 3) would be a polynomial of form c1x^0 + c2x^3 where c2 and c1 will be coefficients of the best fitting polynomial.
Returns: (regression) returns a regression with the best fitting coefficients for the selecected polynomial
regress(reg, x)
Regress one x input.
Parameters:
reg (regression) : (regression) The fitted regression which the y_pred will be calulated with.
x (float) : (float) The input value cooresponding to the y_pred.
Returns: (float) The best fit y value for the given x input and regression.
predict(reg, X)
Predict a new set of X values with a fitted regression. -1 is one bar ahead of the realtime
Parameters:
reg (regression) : (regression) The fitted regression which the y_pred will be calulated with.
X (array)
Returns: (float ) The best fit y values for the given x input and regression.
generate_points(reg, x, y, left_index, right_index)
Takes a regression object and creates chart points which can be used for plotting visuals like lines and labels.
Parameters:
reg (regression) : (regression) Regression which has been fitted to a data set.
x (array) : (float ) x values which coorispond to passed y values
y (array) : (float ) y values which coorispond to passed x values
left_index (int) : (int) The offset of the bar farthest to the realtime bar should be larger than left_index value.
right_index (int) : (int) The offset of the bar closest to the realtime bar should be less than right_index value.
Returns: (chart.point ) Returns an array of chart points
plot_reg(reg, x, y, left_index, right_index, curved, close, line_color, line_width)
Simple plotting function for regression for more custom plotting use generate_points() to create points then create your own plotting function.
Parameters:
reg (regression) : (regression) Regression which has been fitted to a data set.
x (array)
y (array)
left_index (int) : (int) The offset of the bar farthest to the realtime bar should be larger than left_index value.
right_index (int) : (int) The offset of the bar closest to the realtime bar should be less than right_index value.
curved (bool) : (bool) If the polyline is curved or not.
close (bool) : (bool) If true the polyline will be closed.
line_color (color) : (color) The color of the line.
line_width (int) : (int) The width of the line.
Returns: (polyline) The polyline for the regression.
series_to_list(src, left_index, right_index)
Convert a series to a list. Creates a list of all the cooresponding source values
from left_index to right_index. This should be called at the highest scope for consistency.
Parameters:
src (float) : (float ) The source the list will be comprised of.
left_index (int) : (float ) The left most bar (farthest back historical bar) which the cooresponding source value will be taken for.
right_index (int) : (float ) The right most bar closest to the realtime bar which the cooresponding source value will be taken for.
Returns: (float ) An array of size left_index-right_index
range_list(start, stop, step)
Creates an from the start value to the stop value.
Parameters:
start (int) : (float ) The true y values.
stop (int) : (float ) The predicted y values.
step (int) : (int) Positive integer. The spacing between the values. ex: start=1, stop=6, step=2:
Returns: (float ) An array of size stop-start
regression
Fields:
coeffs (array__float)
degrees (array__float)
type_linear (series__string)
type_quadratic (series__string)
type_cubic (series__string)
type_custom (series__string)
_squared_error (series__float)
X (array__float)
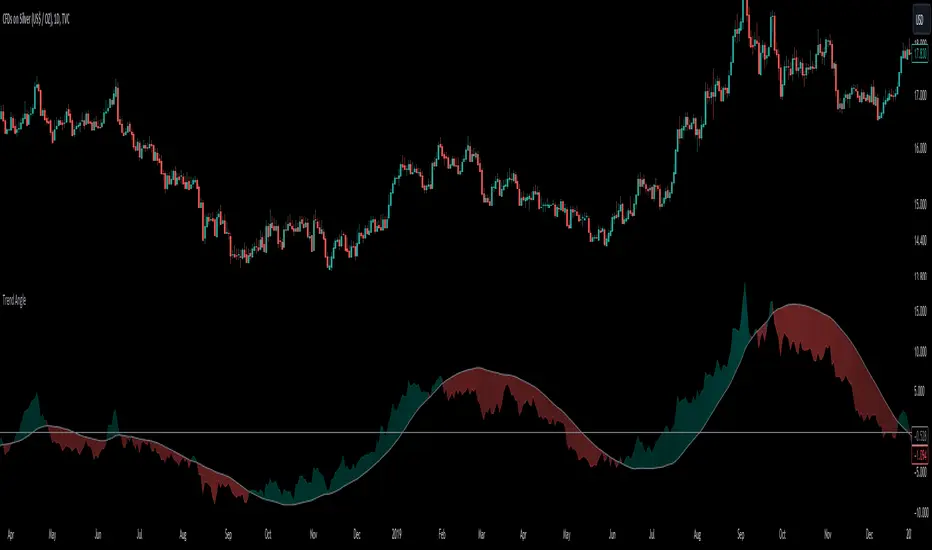
Trend AngleThe "Trend Angle" indicator serves as a tool for traders to decipher market trends through a methodical lens. It quantifies the inclination of price movements within a specified timeframe, making it easy to understand current trend dynamics.
Conceptual Foundation:
Angle Measurement: The essence of the "Trend Angle" indicator is its ability to compute the angle between the price trajectory over a defined period and the horizontal axis. This is achieved through the calculation of the arctangent of the percentage price change, offering a straightforward measure of market directionality.
Smoothing Mechanisms: The indicator incorporates options for "Moving Average" and "Linear Regression" as smoothing mechanisms. This adaptability allows for refined trend analysis, catering to diverse market conditions and individual preferences.
Functional Versatility:
Source Adaptability: The indicator affords the flexibility to select the desired price source, enabling users to tailor the angle calculation to their analytical framework and other indicators.
Detrending Capability: With the detrending feature, the indicator allows for the subtraction of the smoothing line from the calculated angle, highlighting deviations from the main trend. This is particularly useful for identifying potential trend reversals or significant market shifts.
Customizable Period: The 'Length' parameter empowers traders to define the observation window for both the trend angle calculation and its smoothing, accommodating various trading horizons.
Visual Intuition: The optional colorization enhances interpretability, with the indicator's color shifting based on its relation to the smoothing line, thereby providing an immediate visual cue regarding the trend's direction.
Interpretative Results:
Market Flatness: An angle proximate to 0 suggests a flat market condition, indicating a lack of significant directional movement. This insight can be pivotal for traders in assessing market stagnation.
Trending Market: Conversely, a relatively high angle denotes a trending market, signifying strong directional momentum. This distinction is crucial for traders aiming to capitalize on trend-driven opportunities.
Analytical Nuance vs. Simplicity:
While the "Trend Angle" indicator is underpinned by mathematical principles, its utility lies in its simplicity and interpretative clarity. However, it is imperative to acknowledge that this tool should be employed as part of a comprehensive trading strategy , complemented by other analytical instruments for a holistic market analysis.
In essence, the "Trend Angle" indicator exemplifies the harmonization of simplicity and analytical rigor. Its design respects the complexity of market behaviors while offering straightforward, actionable insights, making it a valuable component in the arsenal of both seasoned and novice traders alike.
LTI_FiltersLinear Time-Invariant (LTI) filters are fundamental tools in signal processing that operate with consistent behavior over time and linearly respond to input signals. They are crucial for analyzing and manipulating signals in various applications, ensuring the output signal's integrity is maintained regardless of when an input is applied or its magnitude. The Windowed Sinc filter is a specific type of LTI filter designed for digital signal processing. It employs a Sinc function, ideal for low-pass filtering, truncated and shaped within a finite window to make it practically implementable. This process involves multiplying the Sinc function by a window function, which tapers off towards the ends, making the filter finite and suitable for digital applications. Windowed Sinc filters are particularly effective for tasks like data smoothing and removing unwanted frequency components, balancing between sharp cutoff characteristics and minimal distortion. The efficiency of Windowed Sinc filters in digital signal processing lies in their adept use of linear algebra, particularly in the convolution process, which combines input data with filter coefficients to produce the desired output. This mathematical foundation allows for precise control over the filtering process, optimizing the balance between filtering performance and computational efficiency. By leveraging linear algebra techniques such as matrix multiplication and Toeplitz matrices, these filters can efficiently handle large datasets and complex filtering tasks, making them invaluable in applications requiring high precision and speed, such as audio processing, financial signal analysis, and image restoration.
Library "LTI_Filters"
offset(length, enable)
Calculates the time offset required for aligning the output of a filter with its input, based on the filter's length. This is useful for centered filters where the output is naturally shifted due to the filter's operation.
Parameters:
length (simple int) : The length of the filter.
enable (simple bool) : A boolean flag to enable or dissable the offset calculation.
Returns: The calculated offset if enabled; otherwise, returns 0.
lti_filter(filter_type, source, length, prefilter, centered, fc, window_type)
General-purpose Linear Time-Invariant (LTI) filter function that can apply various filter types to a data series. Can be used to apply a variety of LTI filters with different characteristics to financial data series or other time series data.
Parameters:
filter_type (simple string) : Specifies the type of filter. ("Sinc", "SMA", "WMA")
source (float) : The input data series to filter.
length (simple int) : The length of the filter.
prefilter (simple bool) : Boolean indicating whether to prefilter the input data.
centered (simple bool) : Determines whether the filter coefficients are centered.
fc (simple float) : Filter cutoff. Expressed like a length.
window_type (simple string) : Type of window function to apply. ("Hann", "Hamming", "Blackman", "Triangular", "Lanczos", "None")
Returns: The filtered data series.
lti_sma(source, length, prefilter)
Applies a Simple Moving Average (SMA) filter to the data series. Useful for smoothing data series to identify trends or for use as a component in more complex indicators.
Parameters:
source (float) : The input data series to filter.
length (simple int) : The length of the SMA filter.
prefilter (simple bool) : Boolean indicating whether to prefilter the input data.
Returns: The SMA-filtered data series.
lti_wma(source, length, prefilter, centered)
Applies a Weighted Moving Average (WMA) filter to a data series. Ideal for smoothing data with emphasis on more recent values, allowing for dynamic adjustments to the weighting scheme.
Parameters:
source (float) : The input data series to filter.
length (simple int) : The length of the WMA filter.
prefilter (simple bool) : Boolean indicating whether to prefilter the input data.
centered (simple bool) : Determines whether the filter coefficients are centered.
Returns: The WMA-filtered data series.
lti_sinc(source, length, prefilter, centered, fc, window_type)
Applies a Sinc filter to a data series, optionally using a window function. Particularly useful for signal processing tasks within financial analysis, such as smoothing or trend identification, with the ability to fine-tune filter characteristics.
Parameters:
source (float) : The input data series to filter.
length (simple int) : The length of the Sinc filter.
prefilter (simple bool) : Boolean indicating whether to prefilter the input data.
centered (simple bool) : Determines whether the filter coefficients are centered.
fc (simple float) : Filter cutoff. Expressed like a length.
window_type (simple string) : Type of window function to apply. ("Hann", "Hamming", "Blackman", "Triangular", "Lanczos", "None")
Returns: The Sinc-filtered data series.
Scalper's Volatility Filter [QuantraSystems]Scalpers Volatility Filter
Introduction
The 𝒮𝒸𝒶𝓁𝓅𝑒𝓇'𝓈 𝒱𝑜𝓁𝒶𝓉𝒾𝓁𝒾𝓉𝓎 𝐹𝒾𝓁𝓉𝑒𝓇 (𝒮𝒱𝐹) is a sophisticated technical indicator, designed to increase the profitability of lower timeframe trading.
Due to the inherent decrease in the signal-to-noise ratio when trading on lower timeframes, it is critical to develop analysis methods to inform traders of the optimal market periods to trade - and more importantly, when you shouldn’t trade.
The 𝒮𝒱𝐹 uses a blend of volatility and momentum measurements, to signal the dominant market condition - trending or ranging.
Legend
The 𝒮𝒱𝐹 consists of a signal line that moves above and below a central zero line, serving as the indication of market regime.
When the signal line is positioned above zero, it indicates a period of elevated volatility. These periods are more profitable for trading, as an asset will experience larger price swings, and by design, trend-following indicators will give less false signals.
Conversely, when the signal line moves below zero, a low volatility or mean-reverting market regime dominates.
This distinction is critical for traders in order to align strategies with the prevailing market behaviors - leveraging trends in volatile markets and exercising caution or implementing mean-reversion systems in periods of lower volatility.
Case Study
Here we can see the indicator's unique edge in action.
Out of the four potential long entries seen on the chart - displayed via bar coloring, two would result in losses.
However, with the power of the 𝒮𝒱𝐹 a trader can effectively filter false signals by only entering momentum-trades when the signal line is above zero.
In this small sample of four trades, the 𝒮𝒱𝐹 increased the win rate from 50% to 100%
Methodology
The methodology behind the 𝒮𝒱𝐹 is based upon three components:
By calculating and contrasting two ATR’s, the immediate market momentum relative to the broader, established trend is calculated. The original method for this can be credited to the user @xinolia
A modified and smoothed ADX indicator is calculated to further assess the strength and sustainability of trends.
The ‘Linear Regression Dispersion’ measures price deviations from a fitted regression line, adding further confluence to the signals representation of market conditions.
Together, these components synthesize a robust, balanced view of market conditions, enabling traders to help align strategies with the prevailing market environment, in order to potentially increase expected value and win rates.

ATR TrendTL;DR - An average true range (ATR) based trend
ATR trend uses a (customizable) ATR calculation and highest high & lowest low prices to calculate the actual trend. Basically it determines the trend direction by using highest high & lowest low and calculates (depending on the determined direction) the ATR trend by using a ATR based calculation and comparison method.
The indicator will draw one trendline by default. It is also possible to draw a second trendline which shows a 'negative trend'. This trendline is calculated the same way the primary trendline is calculated but uses a negative (-1 by default) value for the ATR calculation. This trendline can be used to detect early trend changes and/or micro trends.
How to use:
Due to its ATR nature the ATR trend will show trend changes by changing the trendline direction. This means that when the price crosses the trendline it does not automatically mean a trend change. However using the 'negative trend' option ATR trend can show early trend changes and therefore good entry points.
Some notes:
- A (confirmed) trend change is shown by a changing color and/or moving trendline (up/down)
- Unlike other indicators the 'time period' value is not the primary adjustment setting. This value is only used to calculate highest high & lowest low values and has medium impact on trend calculation. The primary adjustment setting is 'ATR weight'
- Every settings has a tooltip with further explanation
- I added additional color coding which uses a different color when the trend attempts to change but the trend change isn't confirmed (yet)
- Default values work fine (at least in my back testing) but the recommendation is to adjust the settings (especially ATR weight) to your trading style
- You can further finetune this indicator by using custom moving average types for the ATR calculation (like linear regression or Hull moving average)
- Both trendlines can be used to determine future support and resistance zones
- ATR trend can be used as a stop loss finder
- Alerts are using buy/sell signals
- You can use fancy color filling ;)
Happy trading!
Daniel

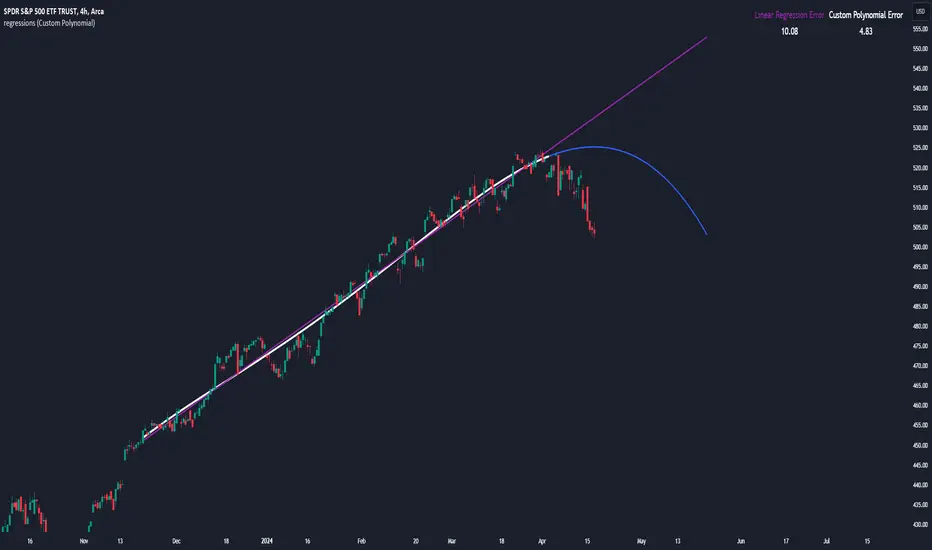
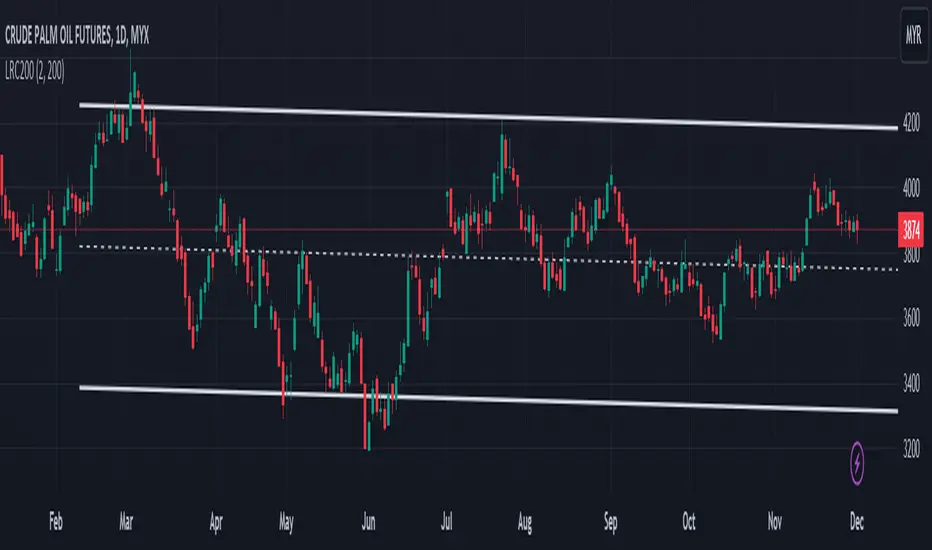
Linear Regression Channel 200█ OVERVIEW
This a simplified version of linear regression channel which use length 200 instead of traditional length 100.
█ FEATURES
Color change depends light / dark mode.
█ LIMITATIONS
Limited to source of closing price and max bars back is 1500.
█ SIMILAR
Regression Channel Alternative MTF
Regression Channel Alternative MTF V2
Predictive Channels [LuxAlgo]The Predictive Channels indicator is a real-time estimate of a trend channel. The indicator returns 2 resistances, 2 supports, and an average line.
🔶 USAGE
The Predictive Channels attempt to find a real-time estimate of an underlying linear trend in the price, the returned supports/resistances are constructed from this estimate.
The area between the price and the estimated trend is also highlighted, with a green color when the price is above the estimated trend, indicating a bullish variation relative to the trend, and a red color indicating a bearish variation.
Price deviating significantly from an estimated trend will return new channels. The Factor setting controls the allowed distance between the price and the trend estimate, with higher values allowing for greater distances and less frequent channels.
The Slope setting will affect the steepness of the channels, with lower values returning steeper channels, this can cause the price to more quickly deviate from the estimated trend, increasing the frequency at which new channels are created.
🔶 SETTINGS
Factor: Multiplicative factor, determines the allowed distance between the price and an estimated trend before a new channel is constructed.
Slope: Controls the line steepness of the channels, with lower values returning steeper lines.

YinYang RSI Volume Trend StrategyThere are many strategies that use RSI or Volume but very few that take advantage of how useful and important the two of them combined are. This strategy uses the Highs and Lows with Volume and RSI weighted calculations on top of them. You may be wondering how much of an impact Volume and RSI can have on the prices; the answer is a lot and we will discuss those with plenty of examples below, but first…
How does this strategy work?
It’s simple really, when the purchase source crosses above the inner low band (red) it creates a Buy or Long. This long has a Trailing Stop Loss band (the outer low band that's also red) that can be adjusted in the Settings. The Stop Loss is based on a % of the inner low band’s price and by default it is 0.1% lower than the inner band’s price. This Stop Loss is not only a stop loss but it can also act as a Purchase Available location.
You can get back into a trade after a stop loss / take profit has been hit when your Reset Purchase Availability After condition has been met. This can either be at Stop Loss, Entry or None.
It is advised to allow it to reset in case the stop loss was a fake out but the call was right. Sometimes it may trigger stop loss multiple times in a row, but you don’t lose much on stop loss and you gain lots when the call is right.
The Take Profit location is the basis line (white). Take Profit occurs when the Exit Source (close, open, high, low or other) crosses the basis line and then on a different bar the Exit Source crosses back over the basis line. For example, if it was a Long and the bar’s Exit Source closed above the basis line, and then 2 bars later its Exit Source closed below the basis line, Take Profit would occur. You can disable Take Profit in Settings, but it is very useful as many times the price will cross the Basis and then correct back rather than making it all the way to the opposing zone.
Longs:
If for instance your Long doesn’t need to Take Profit and instead reaches the top zone, it will close the position when it crosses above the inner top line (green).
Please note you can change the Exit Source too which is what source (close, open, high, low) it uses to end the trades.
The Shorts work the same way as the Long but just opposite, they start when the purchase source crosses under the inner upper band (green).
Shorts:
Shorts take profit when it crosses under the basis line and then crosses back.
Shorts will Stop loss when their outer upper band (green) is crossed with the Exit Source.
Short trades are completed and closed when its Exit Source crosses under the inner low red band.
So, now that you understand how the strategy works, let’s discuss why this strategy works and how it is profitable.
First we will discuss Volume as we deem it plays a much bigger role overall and in our strategy:
As I’m sure many of you know, Volume plays a huge factor in how much something moves, but it also plays a role in the strength of the movement. For instance, let’s look at two scenarios:
Bitcoin’s price goes up $1000 in 1 Day but the Volume was only 10 million
Bitcoin’s price goes up $200 in 1 Day but the Volume was 40 million
If you were to only look at the price, you’d say #1 was more important because the price moved x5 the amount as #2, but once you factor in the volume, you know this is not true. The reason why Volume plays such a huge role in Price movement is because it shows there is a large Limit Order battle going on. It means that both Bears and Bulls believe that price is a good time to Buy and Sell. This creates a strong Support and Resistance price point in this location. If we look at scenario #2, when there is high volume, especially if it is drastically larger than the average volume Bitcoin was displaying recently, what can we decipher from this? Well, the biggest take away is that the Bull’s won the battle, and that likely when that happens we will see bullish movement continuing to happen as most of the Bears Limit Orders have been fulfilled. Whereas with #2, when large price movement happens and Bitcoin goes up $1000 with low volume what can we deduce? The main takeaway is that Bull’s pressured the price up with Market Orders where they purchased the best available price, also what this means is there were very few people who were wanting to sell. This generally dictates that Whale Limit orders for Sells/Shorts are much higher up and theres room for movement, but it also means there is likely a whale that is ready to dump and crash it back down.
You may be wondering, what did this example have to do with YinYang RSI Volume Trend Strategy? Well the reason we’ve discussed this is because we use Volume multiple times to apply multiplications in our calculations to add large weight to the price when there is lots of volume (this is applied both positively and negatively). For instance, if the price drops a little and there is high volume, our strategy will move its bounds MUCH lower than the price actually dropped, and if there was low volume but the price dropped A LOT, our strategy will only move its bounds a little. We believe this reflects higher levels of price accuracy than just price alone based on the examples described above.
Don’t believe us?
Here is with Volume NOT factored in (VWMA = SMA and we remove our Volume Filter calculation):
Which produced -$2880 Profit
Here is with our Volume factored in:
Which produced $553,000 (55.3%)
As you can see, we wen’t from $-2800 profit with volume not factored to $553,000 with volume factored. That's quite a big difference! (Please note previous success does not predict future success we are simply displaying the $ amounts as example).
Now how about RSI and why does it matter in this strategy?
As I’m sure most of you are aware, RSI is one of the leading indicators used in trading. For this reason we figured it would only make sense to incorporate it into our calculations. We fiddled with RSI for quite awhile and sometimes what logically seems to be the right way to use it isn’t. Now, because of this, our RSI calculation is a little odd, but basically what we’re doing is we calculate the RSI, then turn it into a percentage (between 0-1) that can easily be multiplied to the price point we need. The price point we use is the difference between our high purchase zone and our low purchase zone. This allows us to see how much price movement there is between zones. We multiply our zone size with our RSI multiplication and we get the amount we will add +/- to our basis line (white line). This officially creates the NEW high and low purchase zones that we are actually using and displaying in our trades.
If you found that confusing, here are some examples to why it is an important calculation for this strategy:
Before RSI factored in:
Which produced 27.8% Profit
After RSI factored in:
Which produced 553% Profit
As you can see, the RSI makes not only the purchase zones more accurate, but it also greatly increases the profit the strategy is able to make. It also helps ensure an relatively linear profit slope so you know it is reliable with its trades.
This strategy can work on pretty much anything, but you should tweak the values a bit for each pair you are trading it with for best results.
We hope you can find some use out of this simple but effective strategy, if you have any questions, comments or concerns please let us know.
HAPPY TRADING!

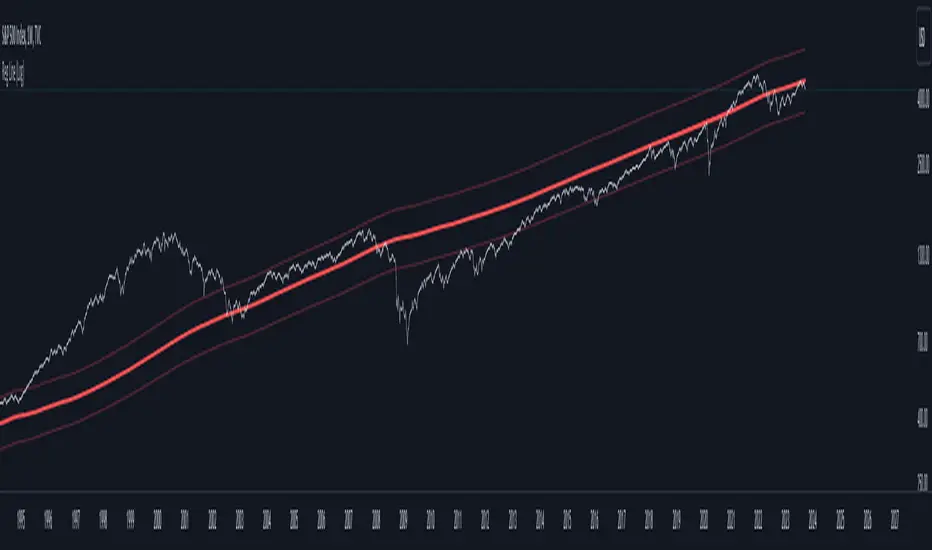
Regression Line (Log)This indicator is based on the "Linear Regression Channel (Log)," which, in turn, is derived from TradingView's "Linear Regression Channel."
The "Regression Line (Log)" indicator is a valuable tool for traders and investors seeking to gain insights into long-term market trends. This indicator is personally favored for its ability to provide a comprehensive view of price movements over extended periods. It offers a unique perspective compared to traditional linear regression lines and moving averages, making it a valuable addition to the toolkit of experienced traders and investors.
Indicator Parameters:
Before delving into the details, it's worth noting that the chosen number of periods (2870) is a personal preference. This specific value is utilized for the S&P 500 index due to its alignment with various theories regarding the beginning of the modern economic era in the stock market. Different analysts propose different starting points, such as the 1950s, 1970s, or 1980s. However, users are encouraged to adjust this parameter to suit their specific needs and trading strategies.
How It Works:
The "Regression Line (Log)" indicator operates by transforming the closing price data into a logarithmic scale. This transformation can make the linear regression more suitable for data with exponential trends or rapid growth. Here's a breakdown of its functioning and why it can be advantageous for long-term trend analysis:
1. Logarithmic Transformation : The indicator begins by applying a logarithmic transformation to the closing price. This transformation helps capture price movements proportionally, making it especially useful for assets that exhibit exponential or rapid growth. This transformation can render linear regression more suitable for data with exponential or fast-paced trends.
2. Linear Regression on Log Scale : After the logarithmic transformation, the indicator calculates a linear regression line (lrc) on this log-transformed data. This step provides a smoother representation of long-term trends compared to a linear regression line on a linear scale.
3. Exponential Reversion : To present the results in a more familiar format, the indicator reverts the log-transformed regression line back to a linear scale using the math.exp function. This final output is the "Linear Regression Curve," which can be easily interpreted on standard price charts.
Advantages:
- Long-Term Trend Clarity : The logarithmic scale better highlights long-term trends and exponential price movements, making it a valuable tool for investors seeking to identify extended trends.
- Smoothing Effect : The logarithmic transformation and linear regression on a log scale smooth out price data, reducing noise and providing a clearer view of underlying trends.
- Adaptability : The indicator allows traders and investors to customize the number of periods (length) to align with their preferred historical perspective or trading strategy.
- Complementary to Other Tools : While not meant to replace other technical indicators, the "Regression Line (Log)" indicator complements traditional linear regression lines and moving averages, offering an alternative perspective for more comprehensive analysis.
Conclusion:
In summary, the "Regression Line (Log)" indicator is a versatile tool that can enhance your ability to analyze long-term market trends. Its logarithmic transformation provides a unique perspective on price data, particularly suited for assets with exponential growth patterns. While the choice of the number of periods is a personal one, it can be adapted to fit various historical viewpoints. This indicator is best utilized as part of a well-rounded trading strategy, in conjunction with other technical tools, to aid in informed decision-making.
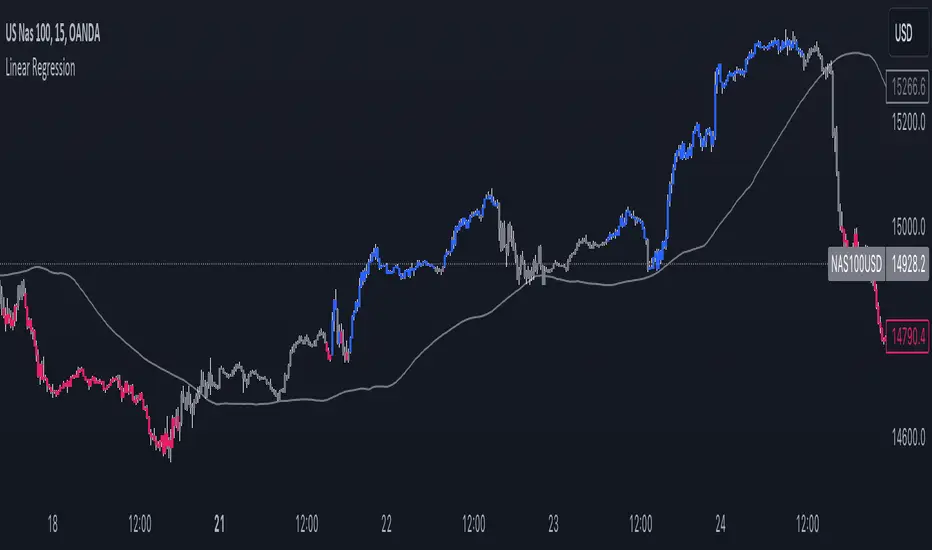
Linear RegressionThis indicator can be used to determine the direction of the current trend.
The indicator plots two different histograms based on the linear regression formula:
- The colored ones represent the direction of the short-term trend
- The gray one represents the direction of the long-term trend
In the settings, you can change the length of the short-term value, which also influences the long-term as a basis that will be multiplied

Linear Regression IndicatorThis tool can be used to determine the direction of the current trend.
The indicator changes the color of the candles based on the direction of the linear regression formula. This is made settings the length of the short-term linear regression in the settings, the longer one is also based on that parameter but significantly larger.
The indicator also plots the average between the two linear regression lines used in the candle coloring formula, and can be used both for support and resistance or as a trend line used to analyze breakouts.
Linear Cross Trading StrategyLinear Cross Trading Strategy
The Linear Cross trading strategy is a technical analysis strategy that uses linear regression to predict the future price of a stock. The strategy is based on the following principles:
The price of a stock tends to follow a linear trend over time.
The slope of the linear trend can be used to predict the future price of the stock.
The strategy enters a long position when the predicted price crosses above the current price, and exits the position when the predicted price crosses below the current price.
The Linear Cross trading strategy is implemented in the TradingView Pine script below. The script first calculates the linear regression of the stock price over a specified period of time. The script then plots the predicted price and the current price on the chart. The script also defines two signals:
Long signal: The long signal is triggered when the predicted price crosses above the current price.
Short signal: The short signal is triggered when the predicted price crosses below the current price.
The script enters a long position when the long signal is triggered and exits the position when the short signal is triggered.
Here is a more detailed explanation of the steps involved in the Linear Cross trading strategy:
Calculate the linear regression of the stock price over a specified period of time.
Plot the predicted price and the current price on the chart.
Define two signals: the long signal and the short signal.
Enter a long position when the long signal is triggered.
Exit the long position when the short signal is triggered.
The Linear Cross trading strategy is a simple and effective way to trade stocks. However, it is important to note that no trading strategy is guaranteed to be profitable. It is always important to do your own research and backtest the strategy before using it to trade real money.
Here are some additional things to keep in mind when using the Linear Cross trading strategy:
The length of the linear regression period is a key parameter that affects the performance of the strategy. A longer period will smooth out the noise in the price data, but it will also make the strategy less responsive to changes in the price.
The strategy is more likely to generate profitable trades when the stock price is trending. However, the strategy can also generate profitable trades in ranging markets.
The strategy is not immune to losses. It is important to use risk management techniques to protect your capital when using the strategy.
I hope this blog post helps you understand the Linear Cross trading strategy better. Booost and share with your friend, if you like.

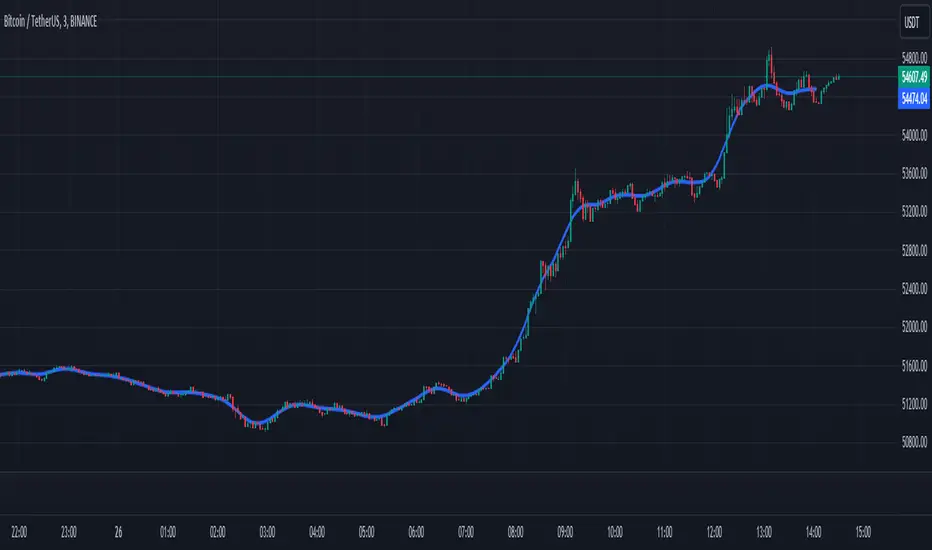
AI Moving Average (Expo)█ Overview
The AI Moving Average indicator is a trading tool that uses an AI-based K-nearest neighbors (KNN) algorithm to analyze and interpret patterns in price data. It combines the logic of a traditional moving average with artificial intelligence, creating an adaptive and robust indicator that can identify strong trends and key market levels.
█ How It Works
The algorithm collects data points and applies a KNN-weighted approach to classify price movement as either bullish or bearish. For each data point, the algorithm checks if the price is above or below the calculated moving average. If the price is above the moving average, it's labeled as bullish (1), and if it's below, it's labeled as bearish (0). The K-Nearest Neighbors (KNN) is an instance-based learning algorithm used in classification and regression tasks. It works on a principle of voting, where a new data point is classified based on the majority label of its 'k' nearest neighbors.
The algorithm's use of a KNN-weighted approach adds a layer of intelligence to the traditional moving average analysis. By considering not just the price relative to a moving average but also taking into account the relationships and similarities between different data points, it offers a nuanced and robust classification of price movements.
This combination of data collection, labeling, and KNN-weighted classification turns the AI Moving Average (Expo) Indicator into a dynamic tool that can adapt to changing market conditions, making it suitable for various trading strategies and market environments.
█ How to Use
Dynamic Trend Recognition
The color-coded moving average line helps traders quickly identify market trends. Green represents bullish, red for bearish, and blue for neutrality.
Trend Strength
By adjusting certain settings within the AI Moving Average (Expo) Indicator, such as using a higher 'k' value and increasing the number of data points, traders can gain real-time insights into strong trends. A higher 'k' value makes the prediction model more resilient to noise, emphasizing pronounced trends, while more data points provide a comprehensive view of the market direction. Together, these adjustments enable the indicator to display only robust trends on the chart, allowing traders to focus exclusively on significant market movements and strong trends.
Key SR Levels
Traders can utilize the indicator to identify key support and resistance levels that are derived from the prevailing trend movement. The derived support and resistance levels are not just based on historical data but are dynamically adjusted with the current trend, making them highly responsive to market changes.
█ Settings
k (Neighbors): Number of neighbors in the KNN algorithm. Increasing 'k' makes predictions more resilient to noise but may decrease sensitivity to local variations.
n (DataPoints): Number of data points considered in AI analysis. This affects how the AI interprets patterns in the price data.
maType (Select MA): Type of moving average applied. Options allow for different smoothing techniques to emphasize or dampen aspects of price movement.
length: Length of the moving average. A greater length creates a smoother curve but might lag recent price changes.
dataToClassify: Source data for classifying price as bullish or bearish. It can be adjusted to consider different aspects of price information
dataForMovingAverage: Source data for calculating the moving average. Different selections may emphasize different aspects of price movement.
-----------------
Disclaimer
The information contained in my Scripts/Indicators/Ideas/Algos/Systems does not constitute financial advice or a solicitation to buy or sell any securities of any type. I will not accept liability for any loss or damage, including without limitation any loss of profit, which may arise directly or indirectly from the use of or reliance on such information.
All investments involve risk, and the past performance of a security, industry, sector, market, financial product, trading strategy, backtest, or individual's trading does not guarantee future results or returns. Investors are fully responsible for any investment decisions they make. Such decisions should be based solely on an evaluation of their financial circumstances, investment objectives, risk tolerance, and liquidity needs.
My Scripts/Indicators/Ideas/Algos/Systems are only for educational purposes!

Extrapolated Previous Trend [LuxAlgo]The Extrapolated Previous Trend indicator extrapolates the estimated linear trend of the prices within a previous interval to the current interval. Intervals can be user-defined.
🔶 USAGE
Returned lines can be used to provide a forecast of trends, assuming trends are persistent in sign and slope.
Using them as support/resistance can also be an effecting usage in case the trend in a new interval does not follow the characteristic of the trend in the previous interval.
The indicator includes a dashboard showing the degree of persistence between segmented trends for uptrends and downtrends. A higher value is indicative of more persistent trend signs.
A lower value could hint at an anti-persistent behavior, with uptrends over an interval often being followed by a down-trend and vice versa. We can invert candle colors to determine future trend direction in this case.
🔶 DETAILS
This indicator can be thought of as a segmented linear model ( a(n)t + b(n) ), where n is the specific interval index. Unlike a regular segmented linear regression model, this indicator is not subject to lookahead bias, coefficients of the model are obtained on previous intervals.
The quality of the fit of the model is dependent on the variability of its coefficients a(n) and b(n) . Coefficients being less subject to change over time are more indicative of trend persistence.
🔶 SETTINGS
Timeframe: Determine the frequency at which new trends are estimated.

HK Percentile Interpolation One
This script is designed to execute a trading strategy based on Heikin Ashi candlesticks, moving averages, and percentile levels.
Please note that you should keep your original chart in normal candlestick mode and not switch it to Heikin Ashi mode. The script itself calculates Heikin Ashi values from regular candlesticks. If your chart is already in Heikin Ashi mode, the script would be calculating Heikin Ashi values based on Heikin Ashi values, which would produce incorrect results.
The strategy begins trading from a start date that you can specify by modifying the `startDate` parameter. The format of the date is "YYYY MM DD". So, for example, to start the strategy from January 1, 2022, you would set `startDate = timestamp("2022 01 01")`.
The script uses Heikin Ashi candlesticks, which are plotted in the chart. This approach can be useful for spotting trends and reversals more easily than with regular candlestick charts. This is particularly useful when backtesting in TradingView's "Rewind" mode, as you can see how the Heikin Ashi candles behaved at each step of the strategy.
Buy and sell signals are generated based on two factors:
1. The crossing over or under of the Heikin Ashi close price and the 75th percentile price level.
2. The Heikin Ashi close price being above certain moving averages.
You have the flexibility to adjust several parameters in the script, including:
1. The stop loss and trailing stop percentages (`stopLossPercentage` and `trailStopPercentage`). These parameters allow the strategy to exit trades if the price moves against you by a certain percentage.
2. The lookback period (`lookback`) used to calculate percentile levels. This determines the range of past bars used in the percentile calculation.
3. The lengths of the two moving averages (`yellowLine_length` and `purplLine_length`). These determine how sensitive the moving averages are to recent price changes.
4. The minimum holding period (`holdPeriod`). This sets the minimum number of bars that a trade must be kept open before it can be closed.
Please adjust these parameters according to your trading preferences and risk tolerance. Happy trading!

Strongest TrendlineUnleashing the Power of Trendlines with the "Strongest Trendline" Indicator.
Trendlines are an invaluable tool in technical analysis, providing traders with insights into price movements and market trends. The "Strongest Trendline" indicator offers a powerful approach to identifying robust trendlines based on various parameters and technical analysis metrics.
When using the "Strongest Trendline" indicator, it is recommended to utilize a logarithmic scale . This scale accurately represents percentage changes in price, allowing for a more comprehensive visualization of trends. Logarithmic scales highlight the proportional relationship between prices, ensuring that both large and small price movements are given due consideration.
One of the notable advantages of logarithmic scales is their ability to balance price movements on a chart. This prevents larger price changes from dominating the visual representation, providing a more balanced perspective on the overall trend. Logarithmic scales are particularly useful when analyzing assets with significant price fluctuations.
In some cases, traders may need to scroll back on the chart to view the trendlines generated by the "Strongest Trendline" indicator. By scrolling back, traders ensure they have a sufficient historical context to accurately assess the strength and reliability of the trendline. This comprehensive analysis allows for the identification of trendline patterns and correlations between historical price movements and current market conditions.
The "Strongest Trendline" indicator calculates trendlines based on historical data, requiring an adequate number of data points to identify the strongest trend. By scrolling back and considering historical patterns, traders can make more informed trading decisions and identify potential entry or exit points.
When using the "Strongest Trendline" indicator, a higher Pearson's R value signifies a stronger trendline. The closer the Pearson's R value is to 1, the more reliable and robust the trendline is considered to be.
In conclusion, the "Strongest Trendline" indicator offers traders a robust method for identifying trendlines with significant predictive power. By utilizing a logarithmic scale and considering historical data, traders can unleash the full potential of this indicator and gain valuable insights into price trends. Trendlines, when used in conjunction with other technical analysis tools, can help traders make more informed decisions in the dynamic world of financial markets.

MultiMovesCombines 3 different moving averages together with the linear regression. The moving averages are the HMA, EMA, and SMA. The script makes use of two different lengths to allow the end user to utilize common crossovers in order to determine entry into a trade. The edge of each "cloud" is where each of the moving averages actually are. The bar color is the average of the shorter length combined moving averages.
-The Hull Moving Average (HMA), developed by Alan Hull, is an extremely fast and smooth moving average. In fact, the HMA almost eliminates lag altogether and manages to improve smoothing at the same time. A longer period HMA may be used to identify trend.
-The exponential moving average (EMA) is a technical chart indicator that tracks the price of an investment (like a stock or commodity) over time. The EMA is a type of weighted moving average (WMA) that gives more weighting or importance to recent price data.
-A simple moving average (SMA) is an arithmetic moving average calculated by adding recent prices and then dividing that figure by the number of time periods in the calculation average.
-The Linear Regression Indicator plots the ending value of a Linear Regression Line for a specified number of bars; showing, statistically, where the price is expected to be. Instead of plotting an average of past price action, it is plotting where a Linear Regression Line would expect the price to be, making the Linear Regression Indicator more responsive than a moving average.
The lighter colors = default 50 MA
The darker colors = default 200 MA

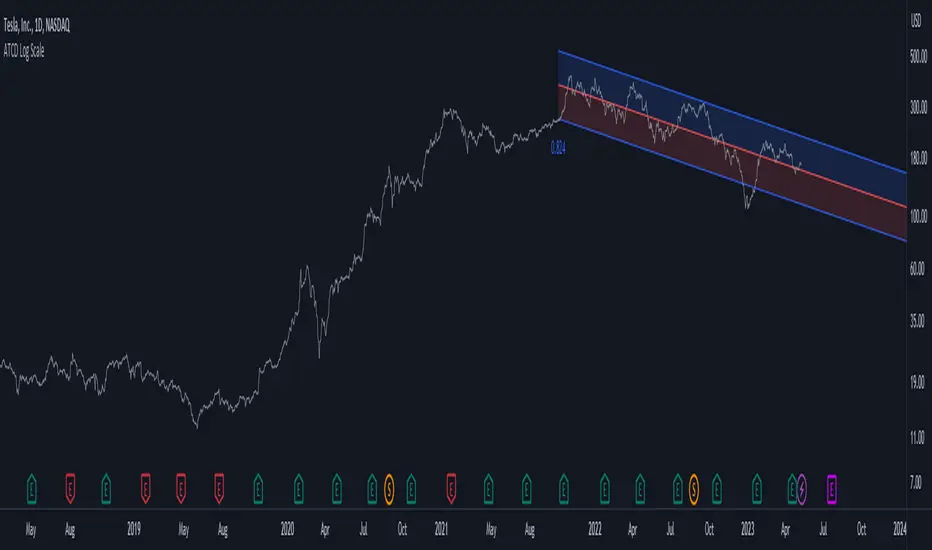
Advanced Trend Channel Detection (Log Scale)The Advanced Trend Channel Detection (Log Scale) indicator is designed to identify the strongest trend channels using logarithmic scaling. It does this by calculating the highest Pearson's R value among all length inputs and then determining which length input to use for the selected slope, average, and intercept. The script then draws the upper and lower deviation lines on the chart based on the selected slope, average, and intercept, and optionally displays the Pearson's R value.
To use this indicator, you will need to switch to logarithmic scale. There are several advantages to using logarithmic scale over regular scale. Firstly, logarithmic scale provides a better visualization of data that spans multiple orders of magnitude by compressing large ranges of values into a smaller space. Secondly, logarithmic scale can help to minimize the impact of outliers, making it easier to identify patterns and trends in the data. Finally, logarithmic scale is often utilized in scientific contexts as it can reveal relationships between variables that may not be visible on a linear scale.
If the trend channel does not appear on the chart, it may be necessary to scroll back to view historical data. The indicator uses past price data to calculate the trend channel, so if there is not enough historical data visible on the chart, the indicator may not be able to identify the trend channel. In this case, the user should adjust the chart's timeframe or zoom out to view more historical data. Additionally, the indicator may need to be recalibrated if there is a significant shift in market conditions or if the selected length input is no longer appropriate.
Deming Linear Regression [wbburgin]Deming regression is a type of linear regression used to model the relationship between two variables when there is variability in both variables. Deming regression provides a solution by simultaneously accounting for the variability in both the independent and dependent variables, resulting in a more accurate estimation of the underlying relationship. In the hard-science fields, where measurements are critically important to judging the conclusions drawn from data, Deming regression can be used to account for measurement error.
Tradingview's default linear regression indicator (the ta.linreg() function) uses least squares linear regression, which is similar but different than Deming regression. In least squares regression, the regression function minimizes the sum of the squared vertical distances between the data points and the fitted line. This method assumes that the errors or variability are only present in the y-values (dependent variable), and that the x-values (independent variable) are measured without error.
In time series data used in trading, Deming regression can be more accurate than least squares regression because the ratio of the variances of the x and y variables is large. X is the bar index, which is an incrementally-increasing function that has little variance, while Y is the price data, which has extremely high variance when compared to the bar index. In such situations, least squares regression can be heavily influenced by outliers or extreme points in the data, whereas Deming regression is more resistant to such influence.
Additionally, if your x-axis uses variable widths - such as renko blocks or other types of non-linear widths - Deming regression might be more effective than least-squares linear regression because it accounts for the variability in your x-values as well. Additionally, if you are creating a machine-learning model that uses linear regression to filter or extrapolate data, this regression method may be more accurate than least squares.
In contrast to least squares regression, Deming regression takes into account the variability or errors in both the x- and y-values. It minimizes the sum of the squared perpendicular distances between the data points and the fitted line, accounting for both the x- and y-variability. This makes Deming regression more robust in both variables than least squares regression.

Chandelier Exit ZLSMA StrategyIntroducing a Powerful Trading Indicator: Chandelier Exit with ZLSMA
If you're a trader, you know the importance of having the right tools and indicators to make informed decisions. That's why we're excited to introduce a powerful new trading indicator that combines the Chandelier Exit and ZLSMA: two widely-used and effective indicators for technical analysis.
The Chandelier Exit (CE) is a popular trailing stop-loss indicator developed by Chuck LeBeau. It's designed to follow the price trend of a security and provide an exit signal when the price crosses below the CE line. The CE line is based on the Average True Range (ATR), which is a measure of volatility. This means that the CE line adjusts to the volatility of the security, making it a reliable indicator for trailing stop-losses.
The ZLEMA (Zero Lag Exponential Moving Average) is a type of exponential moving average that's designed to reduce lag and improve signal accuracy. The ZLSMA takes into account not only the current price but also past prices, using a weighted formula to calculate the moving average. This makes it a smoother indicator than traditional moving averages, and less prone to giving false signals.
When combined, the CE and ZLSMA create a powerful indicator that can help traders identify trend changes and make more informed trading decisions. The CE provides the trailing stop-loss signal, while the ZLSMA provides a smoother trend line to help identify potential entry and exit points.
In our indicator, the CE and ZLSMA are plotted together on the chart, making it easy to see both the trailing stop-loss and the trend line at the same time. The CE line is displayed as a dotted line, while the ZLSMA line is displayed as a solid line.
Using this indicator, traders can set their stop-loss levels based on the CE line, while also using the ZLSMA line to identify potential entry and exit points. The combination of these two indicators can help traders reduce their risk and improve their trading performance.
In conclusion, the Chandelier Exit with ZLSMA is a powerful trading indicator that combines two effective technical analysis tools. By using this indicator, traders can identify trend changes, set stop-loss levels, and make more informed trading decisions. Try it out for yourself and see how it can improve your trading performance.
Warning: The results in the backtest are from a repainting strategy. Don't take them seriously. You need to do a dry live test in order to test it for its useability.
-
Here is a description of each input field in the provided source code:
length: An integer input used as the period for the ATR (Average True Range) calculation. Default value is 1.
mult: A float input used as a multiplier for the ATR value. Default value is 2.
showLabels: A boolean input that determines whether to display buy/sell labels on the chart. Default value is false.
isSignalLabelEnabled: A boolean input that determines whether to display signal labels on the chart. Default value is true.
useClose: A boolean input that determines whether to use the close price for extrema calculations. Default value is true.
zcolorchange: A boolean input that determines whether to enable rising/decreasing highlighting for the ZLSMA (Zero-Lag Exponential Moving Average) line. Default value is false.
zlsmaLength: An integer input used as the length for the ZLSMA calculation. Default value is 50.
offset: An integer input used as an offset for the ZLSMA calculation. Default value is 0.
-
Ty for checking this out and good luck on your trading journey! Likes and comments are appreciated. 👍
--
Credits to:
▪ @everget – Chandelier Exit (CE)
▪ @netweaver2022 – ZLSMA

Regression Envelope MTFThe Regression Envelope MTF indicator is a technical analysis tool that uses linear regression to identify potential price reversal points in the market. The indicator plots a linear regression line based on the selected price source over a specified length, and adds and subtracts a multiple of the standard deviation to create upper and lower bands around the line.
One advantage of using linear regression over the traditional envelope indicator is that it takes into account the slope of the trend, rather than assuming that the trend is linear. This means that the bands will adapt to the slope of the trend, which can provide more accurate signals in trending markets.
Another advantage of using linear regression over a simple moving average (SMA) is that it is less sensitive to outliers. SMAs can be heavily influenced by extreme values in the data, which can result in false signals. Linear regression, on the other hand, is more robust to outliers, which can lead to more reliable signals.
Overall, the Regression Envelope MTF indicator can be a useful tool for traders and investors looking to identify potential price reversal points and generate trading signals. However, it should be used in conjunction with other technical analysis tools and with proper risk management strategies in place.

Autoregressive Covariance Oscillator by TenozenWell to be honest I don't know what to name this indicator lol. But anyway, here is my another original work! Gonna give some background of why I create this indicator, it's all pretty much a coincidence when I'm learning about time series analysis.
_ _ _ _ _ _ _ _ _ _ _ _ _ _ _ _ _ _ _ _ _ _ _ _ _ _ _ _ _ _ _ _ _ _ _ _ _
Well, the formula of Auto-covariance is:
E{(X(t)-(t) * (X(t-s)-(t-s))}= Y_s
But I don't multiply both values but rather subtract them:
E{(X(t)-(t) - (X(t-s)-(t-s))}= Y_s?
_ _ _ _ _ _ _ _ _ _ _ _ _ _ _ _ _ _ _ _ _ _ _ _ _ _ _ _ _ _ _ _ _ _ _ _ _
For arm_vald, the equation is as follows:
arm_vald = val_mu + mu_plus_lsm + et
val_mu --> mean of time series
mu_plus_lsm --> val_mu + LSM
et --> error term
As you can see, val_mu^2. I did this so the oscillator is much smoother.
_ _ _ _ _ _ _ _ _ _ _ _ _ _ _ _ _ _ _ _ _ _ _ _ _ _ _ _ _ _ _ _ _ _ _ _ _
After I get the value, I normalize them:
aco = Y_s? / arm_vald
So by this calculation, I get something like an oscillator!
(more details in the code)
_ _ _ _ _ _ _ _ _ _ _ _ _ _ _ _ _ _ _ _ _ _ _ _ _ _ _ _ _ _ _ _ _ _ _ _ _
So how to use this indicator? It's so easy! If the value is above 0, we gonna expect a bullish response, if the value is below 0, we gonna expect a bearish response; that simple. Be aware that you should wait for the price to be closed before executing a trade.
Well, try it out! So far this is the most powerful indicator that I've created, hope it's useful. Ciao.
(more updates for the indicator if needed)
