SMC Sessions NYThis script plots vertical session markers on the chart to highlight session opens and closes based on New York time.
Key characteristics:
The indicator is plotted on the price chart (overlay).
It draws thin, dotted vertical lines at specific session times.
Sessions are calculated using the America/New_York timezone to ensure correct alignment.
Only weekdays (Monday to Friday) are considered.
The script draws sessions for today and up to one week back (maximum 7 calendar days).
All drawings are created once on the last bar to avoid duplicates and performance issues.
Each session has its own color for clear visual distinction:
Asia session (open)
London session (open and close)
New York / Kill Zone Morning (open and close)
Lunch session (open and close)
New York / Kill Zone Afternoon (open and close)
The Asia session open at 20:00 NY is intentionally excluded on Fridays, as there is no valid Asia session start on Friday evening.
The vertical lines extend across the entire visible price range of the chart.
The script is optimized to stay well within TradingView object limits.
Purpose:
The indicator is designed to give traders a clean, non-intrusive visual reference for key session transitions, helping to analyze price behavior around session opens and closes without cluttering the chart.
This approach is suitable for intraday and session-based trading models, including SMC-style workflows.
London

TMT Sessions - Hitesh NimjeTMT Sessions - Hitesh Nimje Indicator
Overview
The TMT Sessions indicator is a comprehensive trading tool designed to visualize and analyze the four major global trading sessions. It provides session-based technical analysis including ranges, trends, averages, and statistical metrics for each trading session.
Key Features
Four Global Trading Sessions
1. Session A - New York (13:00-22:00 UTC)
Color: Blue (#0000FF)
Default timeframe: US/Eastern market hours
2. Session B - London (07:00-16:00 UTC)
Color: Black (#000000)
Default timeframe: European market hours
3. Session C - Tokyo (00:00-09:00 UTC)
Color: Red (#FF0000)
Default timeframe: Asian market hours
4. Session D - Sydney (21:00-06:00 UTC)
Color: Orange (#FFA500)
Default timeframe: Australian market hours
Technical Analysis Tools
Range Analysis:
* Visual range boxes showing session high/low boundaries
* Transparent background areas with configurable transparency
* Range outline borders
* Session labels with customizable text display
Trend Analysis:
* Linear regression trendlines for each session
* Statistical metrics including:
R-squared values for trend strength
Standard deviation calculations
Correlation measurements
Statistical Indicators:
* Session Averages: Simple Moving Averages (SMA) calculated within each session
* VWAP: Volume Weighted Average Price for session-based intraday analysis
* Max/Min Lines: Highest and lowest prices recorded during each session
Visual Elements
Session Dividers:
* Visual markers showing session start/end points
* Session identification symbols (NYE, LDN, TYO, SYD)
* Configurable divider display options
Dashboard Features:
* Basic Dashboard: Session status (Active/Inactive) with color-coded indicators
* Advanced Dashboard: Additional metrics including:
Session trend strength (R-squared values)
Volume data
Standard deviation statistics
* Multiple dashboard positions (Top Right, Bottom Right, Bottom Left)
* Configurable text sizes (Tiny, Small, Normal)
Customization Options
Timezone Management:
* UTC offset adjustment (+/- hours)
* Exchange timezone option for automatic adjustment
* Session time customization
Display Settings:
* Individual session enable/disable
* Color customization for each session
* Range area transparency control
* Line description display toggle
* Session text label configuration
Use Cases
1. Session-Based Trading: Identify optimal trading times for each global session
2. Range Trading: Use session ranges as support/resistance levels
3. Trend Analysis: Track session-specific trends and momentum
4. Statistical Analysis: Monitor session volatility and trend strength
5. Market Structure: Understand how price moves across different trading sessions
Technical Specifications
* Pine Script Version: 6
* Overlays: True (displays on price chart)
* Performance: Optimized for up to 500 bars back
* Multi-element Support: Handles up to 500 lines, boxes, and labels
* Data Source: Compatible with all trading instruments and timeframes
Benefits for Traders
1. Global Market Awareness: Visual representation of all major trading sessions
2. Session Analysis: Automated calculation of key session statistics
3. Trading Strategy Development: Session-based entry and exit signals
4. Risk Management: Session ranges for stop-loss and take-profit levels
5. Market Timing: Optimal trading session identification
This indicator is particularly valuable for forex traders, day traders, and anyone who needs to understand price behavior across different global market sessions. It combines multiple technical analysis concepts into a unified, session-focused trading tool.
TRADING DISCLAIMER
RISK WARNING
Trading involves substantial risk of loss and is not suitable for all investors. Past performance is not indicative of future results. You should carefully consider whether trading is suitable for you in light of your circumstances, knowledge, and financial resources.
NO FINANCIAL ADVICE
This indicator is provided for educational and informational purposes only. It does not constitute:
* Financial advice or investment recommendations
* Buy/sell signals or trading signals
* Professional investment advice
* Legal, tax, or accounting guidance
LIMITATIONS AND DISCLAIMERS
Technical Analysis Limitations
* Pivot points are mathematical calculations based on historical price data
* No guarantee of accuracy of price levels or calculations
* Markets can and do behave irrationally for extended periods
* Past performance does not guarantee future results
* Technical analysis should be used in conjunction with fundamental analysis
Data and Calculation Disclaimers
* Calculations are based on available price data at the time of calculation
* Data quality and availability may affect accuracy
* Pivot levels may differ when calculated on different timeframes
* Gaps and irregular market conditions may cause level failures
* Extended hours trading may affect intraday pivot calculations
Market Risks
* Extreme market volatility can invalidate all technical levels
* News events, economic announcements, and market manipulation can cause gaps
* Liquidity issues may prevent execution at calculated levels
* Currency fluctuations, inflation, and interest rate changes affect all levels
* Black swan events and market crashes cannot be predicted by technical analysis
USER RESPONSIBILITIES
Due Diligence
* You are solely responsible for your trading decisions
* Conduct your own research before using this indicator
* Verify calculations with multiple sources before trading
* Consider multiple timeframes and confirm levels with other technical tools
* Never rely solely on one indicator for trading decisions
Risk Management
* Always use proper risk management and position sizing
* Set appropriate stop-losses for all positions
* Never risk more than you can afford to lose
* Consider the inherent risks of leverage and margin trading
* Diversify your portfolio and trading strategies
Professional Consultation
* Consult with qualified financial advisors before trading
* Consider your tax obligations and legal requirements
* Understand the regulations in your jurisdiction
* Seek professional advice for complex trading strategies
LIMITATION OF LIABILITY
Indemnification
The creator and distributor of this indicator shall not be liable for:
* Any trading losses, whether direct or indirect
* Inaccurate or delayed price data
* System failures or technical malfunctions
* Loss of data or profits
* Interruption of service or connectivity issues
No Warranty
This indicator is provided "as is" without warranties of any kind:
* No guarantee of accuracy or completeness
* No warranty of uninterrupted or error-free operation
* No warranty of merchantability or fitness for a particular purpose
* The software may contain bugs or errors
Maximum Liability
In no event shall the liability exceed the purchase price (if any) paid for this indicator. This limitation applies regardless of the theory of liability, whether contract, tort, negligence, or otherwise.
REGULATORY COMPLIANCE
Jurisdiction-Specific Risks
* Regulations vary by country and region
* Some jurisdictions prohibit or restrict certain trading strategies
* Tax implications differ based on your location and trading frequency
* Commodity futures and options trading may have additional requirements
* Currency trading may be regulated differently than stock trading
Professional Trading
* If you are a professional trader, ensure compliance with all applicable regulations
* Adhere to fiduciary duties and best execution requirements
* Maintain required records and reporting
* Follow market abuse regulations and insider trading laws
TECHNICAL SPECIFICATIONS
Data Sources
* Calculations based on TradingView data feeds
* Data accuracy depends on broker and exchange reporting
* Historical data may be subject to adjustments and corrections
* Real-time data may have delays depending on data providers
Software Limitations
* Internet connectivity required for proper operation
* Software updates may change calculations or functionality
* TradingView platform dependencies may affect performance
* Third-party integrations may introduce additional risks
MONEY MANAGEMENT RECOMMENDATIONS
Conservative Approach
* Risk only 1-2% of capital per trade
* Use position sizing based on volatility
* Maintain adequate cash reserves
* Avoid over-leveraging accounts
Portfolio Management
* Diversify across multiple strategies
* Don't put all capital into one approach
* Regularly review and adjust trading strategies
* Maintain detailed trading records
FINAL LEGAL NOTICES
Acceptance of Terms
* By using this indicator, you acknowledge that you have read and understood this disclaimer
* You agree to assume all risks associated with trading
* You confirm that you are legally permitted to trade in your jurisdiction
Updates and Changes
* This disclaimer may be updated without notice
* Continued use constitutes acceptance of any changes
* It is your responsibility to stay informed of updates
Governing Law
* This disclaimer shall be governed by the laws of the jurisdiction where the indicator was created
* Any disputes shall be resolved in the appropriate courts
* Severability clause: If any part of this disclaimer is invalid, the remainder remains enforceable
REMEMBER: THERE ARE NO GUARANTEES IN TRADING. THE MAJORITY OF RETAIL TRADERS LOSE MONEY. TRADE AT YOUR OWN RISK.
Contact Information:
* Creator: Hitesh_Nimje
* Phone: Contact@8087192915
* Source: Thought Magic Trading
© HiteshNimje - All Rights Reserved
This disclaimer should be prominently displayed whenever the indicator is shared, sold, or distributed to ensure users are fully aware of the risks and limitations involved in trading.

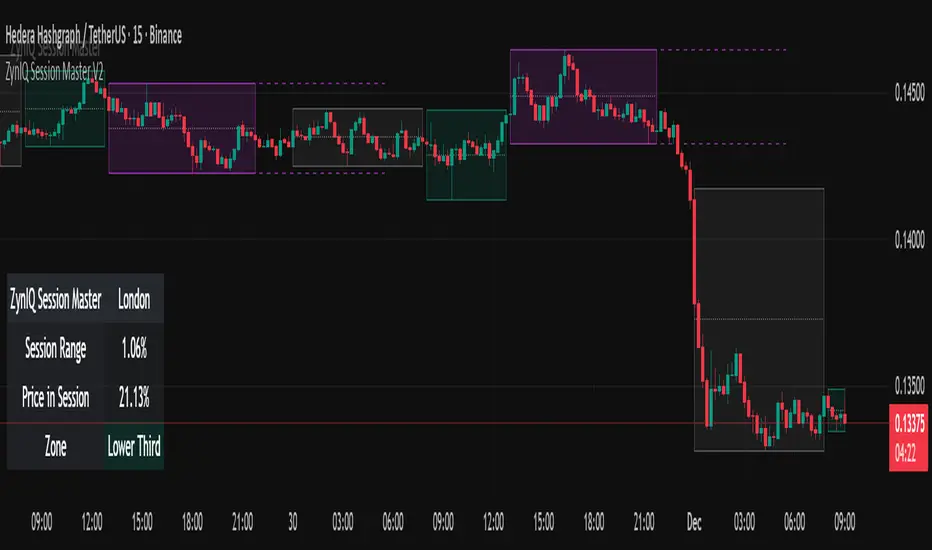
ZynIQ Session Master v2 - (Lite Pack)Overview
ZynIQ Session Master v2 (Lite) highlights key market sessions and their associated ranges, helping traders understand when volatility tends to shift between Asian, London and New York sessions. It provides clean visual context for intraday trading without overwhelming the chart.
Key Features
• Automatic detection and shading of major trading sessions
• Configurable session highlighting
• Optional range markers for Asia, London and New York
• Lightweight visuals suitable for fast intraday charting
• Simple session-based structure for context around volatility shifts
• Optional labels marking session transitions
Use Cases
• Seeing where session volatility typically increases
• Identifying when price is leaving a session range
• Timing trades around session opens
• Combining session structure with breakout, trend or momentum tools
Notes
This script provides session structure and volatility context. It is not a standalone trading system. Use alongside your preferred confirmation and risk management.
TMT Session - HiteshNimje TMT Session - HiteshNimje
Overview
This indicator highlights four configurable trading sessions (default: New York / London / Tokyo / Sydney) and draws session ranges, session VWAPs, session mean/trendline, max/min lines and optional dashboard info. It was built for students of Thought Magic Trading (TMT) to quickly visualize intraday structure across major sessions.
Key features
4 separate sessions (A/B/C/D) — customizable names, times and colors.
Session Range boxes (high/low), optional outline and labels.
VWAP per session (volume-weighted average price).
Mean / Trendline for session price (optional).
Optional session Max/Min lines.
Small on-chart descriptive labels explaining what each plotted line means.
Simple dashboard showing session status (Active/Inactive), volume, trend strength and standard deviation (optional).
Timezone offset or use exchange timezone.
Default colors
Session A — Blue
Session B — Black
Session C — Red
Session D — Orange
Usage / Notes
Designed for intraday analysis — works best on intraday timeframes.
Toggle any session, overlay, or label via input settings to reduce chart clutter.
Labels and dashboard are optional; enable them only when you want the additional on-chart information.
The indicator does not provide buy/sell signals. Use it as a structural reference in conjunction with your trading plan.
Access & License
EXCLUSIVE ACCESS: This indicator is for TMT students only.
Distribution: Invite-only (author permission required) — the author will grant access by invitation.
Redistribution, modification, or public reposting without permission is prohibited.
Support / Contact
For access requests or issues, contact the author: Hitesh_Nimje (Thought Magic Trading).
(Provide invite requests directly to the author — do not attempt to share copies.)
Disclaimer
For educational purposes only. Trading involves risk. Past performance is not indicative of future results. The author is not responsible for trading losses.

[iQ]PRO Market Sessions+🌐 PRO Market Sessions+: The Architecture of Market Time
Elevate your market analysis with the PRO v1 Time Cycles indicator—a sophisticated, proprietary framework engineered to meticulously map and visualize critical, high-probability time segments across global trading sessions. This tool transcends conventional session highlighting by providing a multi-layered, time-boxed view of market behavior, offering unparalleled clarity on structural shifts and key price levels.
This tool is optimized for professional traders, providing an edge by focusing on the fractal nature of market timing.
⏳ Precision Time Segmentation
The core functionality revolves around the hyper-precise segmentation of the trading day, anchored to the New York (EST) timezone to capture institutional flow.
Global Overlap Coverage: Integrates key Asia and London sessions with the comprehensive New York trading day, allowing for the analysis of transitional volatility and overlap strategies.
Structured Cycles: Deploys a unique system of 270-minute cycles, nested with 90-minute and 30-minute subdivisions. This hierarchical structure reveals how market structure evolves from macro-sessions down to critical, granular pivots.
New York Focus: Features distinct AM and PM 270-minute cycles, further broken down into 90-minute tranches (AM1, AM2, AM3 / PM1, PM2, PM3) and fine-tuned with 30-minute and even 10-minute boxes for exceptional high-resolution analysis.
London Depth: The London session is captured as a 270-minute block, with its own nested 90/30-minute structures, providing a complete view of the European market's structural integrity before the US open.
✨ Dynamic Structural Analysis
Beyond mere visualization, the indicator computes and projects critical structural levels within each time box, acting as dynamic reference points for price action.
Dynamic Price Anchors: Each time-cycle box is calculated to reveal key price metrics, including the Open Price and the Equilibrium (EQ) Level (Mid-Range). These lines serve as potent technical levels, often representing institutional reference points for deviation and reversion.
High/Low Capture: The extreme High and Low of each significant time segment are captured and marked, forming the boundaries of the structural range and identifying potential areas of liquidity draw.
Persistent Levels: Projects Previous Day, Week, and Month High/Low levels. These crucial historical benchmarks act as magnets or barriers to current price movement, providing essential macro-context to intra-day analysis.
🎨 Customizable & Non-Intrusive
The PRO v1 Time Cycles is designed for seamless integration into any chart setup, offering extensive customization without cluttering the price action.
Control over Granularity: Users maintain complete control over which time cycles (270, 90, 30, 10-minute) are displayed, ensuring the chart reflects the specific trading strategy and timeframe required.
Aesthetic Flexibility: Features highly detailed options for color, border styles, text alignment, and line thickness for every major session and nested cycle, allowing for a fully personalized and professional workspace.
This tool is a fundamental component of the iQ PRO suite, providing the essential temporal context required to execute sophisticated, time-based trading strategies. Its robust architecture is built to empower the discerning trader with a clearer, more structured view of the market's inner workings.

ORBs, EMAs, AVWAPThis Pine Script (version 6) is a multi-session trading indicator that combines Opening Range Breakouts (ORBs), Exponential Moving Averages (EMAs), and an Anchored VWAP (AVWAP) system — all in one overlay script for TradingView.
Here’s a clear breakdown of its structure and functionality:
🕒 1. Session Logic and ORB Calculation
Purpose: Identify and plot the high and low of the first 30 minutes (default) for the Tokyo, London, and New York trading sessions.
Session Anchors (NY time):
Tokyo → 20:00
London → 03:00
New York → 09:30
(All configurable in inputs.)
ORB Duration: Default is 30 minutes (orbDurationMin), also user-configurable.
Resets:
London and NY ORBs reset at the start of each new New York trading day (17:00 NY time).
Tokyo ORB resets independently using a stored timestamp.
Process:
For each session:
While the time is within the ORB window, the script captures the session’s high and low.
Once the window closes, those levels remain plotted until reset.
Plot Colors:
Tokyo → Yellow (#fecc02)
London → Gray (#8c9a9c)
New York → Magenta (#ff00c8)
These form visible horizontal lines marking the prior session ranges — useful for breakout or retest trading setups.
📈 2. EMA System
Purpose: Provide trend and dynamic support/resistance guidance.
It calculates and plots four EMAs:
EMA Period Color Purpose
EMA 9 Short-term Green Fast signal
EMA 20 Short-term Red Confirms direction
EMA 113 Medium Aqua Trend filter
EMA 200 Long-term Orange Macro trend baseline
Each EMA is plotted directly on the price chart for visual confluence with ORB and VWAP levels.
⚖️ 3. Anchored VWAP (AVWAP)
Purpose: Display a volume-weighted average price anchored to specific timeframes or events, optionally with dynamic deviation or percentage bands.
Features:
Anchor Options:
Time-based: Session, Week, Month, Quarter, Year, Decade, Century
Event-based: Earnings, Dividends, Splits
VWAP resets when the chosen anchor condition is met (e.g., new month, new earnings event, etc.).
Bands:
Up to three levels of symmetric upper/lower bands.
Choose between Standard Deviation or Percentage-based widths.
Display Toggles:
Each band’s visibility is optional.
VWAP can be hidden on 1D+ timeframes (hideonDWM option).
Color Scheme:
VWAP: Fuchsia (magenta-pink) line
Bands: Green / Olive / Teal with light-filled zones
⚙️ 4. Technical Highlights
Uses ta.vwap() with built-in band calculations.
Handles instruments with or without volume (errors if missing volume).
Uses time-zone aware timestamps (timestamp(NY_TZ, …)).
Uses timeframe.change() to detect new anchors for the VWAP.
Employs persistent variables (var) to maintain session state across bars.
💡 In Practice
This indicator is designed for multi-session intraday traders who:
Trade Tokyo, London, or NY open breakouts or retests.
Use EMA stacking and crossovers for trend confirmation.
Use Anchored VWAP as a fair-value or mean-reversion reference.
Need clear visual structure across different market sessions.
It provides strong session separation, trend context, and volume-weighted price reference — making it ideal for discretionary or semi-systematic trading strategies focused on liquidity zones and session momentum.

Sessions Highs/LowsThis indicator plots the High and Low of the three main trading sessions:
Asia (20:00–03:00) – green lines
London (03:00–08:00) – blue lines
New York (08:00–13:00) – red lines
Features:
Levels update in real time during each session.
When a new session starts, the previous lines are deleted – only the latest active sessions remain visible.
Default session times are set to Asia (20:00–03:00), London (03:00–08:00), and New York (08:00–13:00), but you can adjust them to your own custom hours in the settings.
Colors can also be customized.
Use cases:
Quickly visualize session ranges.
Track session highs/lows for breakouts, fakeouts, and reactions around liquidity zones.

STOCK EXCHANGE + SILVER BULLET FRAMESThis script is an updated version of the " NY/LDN/TOK Stock Exchange Opening Hours " script.
Objective
Displays global stock exchange sessions (New York, London, Tokyo) with session frames, highs/lows, and opening lines. Includes ICT Silver Bullet windows (NY, London, Tokyo) with configurable shading. Past sessions are frozen at close, ongoing sessions update dynamically until closure, and upcoming sessions are pre-drawn. Fully customizable with options for weekends, labels, padding, opacity, and individual session toggles.
It is designed to help traders quickly interpret market context, liquidity zones, and session-based price behavior.
Main Features
Past sessions (historical data)
• Session Frames:
• Each box is frozen at the session’s close.
• The left edge aligns with the opening time, while the right edge is fixed at the closing time.
• The top and bottom reflect the highest and lowest prices during the session.
• Session Labels:
• Names (NY, LDN, TOK) displayed above the frame, aligned left, in the same color as the frame.
• Opening Lines:
• Vertical dotted lines mark the start of each session.
Ongoing and upcoming sessions (live market)
• Dynamic Session Frames:
• The right edge is locked at the future close time.
• The top and bottom update in real time as new highs and lows form.
• Labels and Lines:
• The session label is visible above the active frame.
• Opening lines are drawn as soon as the session begins.
Silver Bullet Time Windows (ICT concept)
• Highlights key liquidity windows within sessions:
• New York: 10:00–11:00 and 14:00–15:00
• London: 08:00–09:00
• Tokyo: 09:00–10:00
• Silver Bullet zones are shaded with configurable opacity (default 5%).
Customization and Options
• Enable or disable individual sessions (NY, London, Tokyo).
• Toggle weekend display (frames and Silver Bullets).
• Adjust label size, padding, and text visibility.
• Control frame opacity (default 0%).
• Optimized memory management with automatic pruning of old graphical objects.

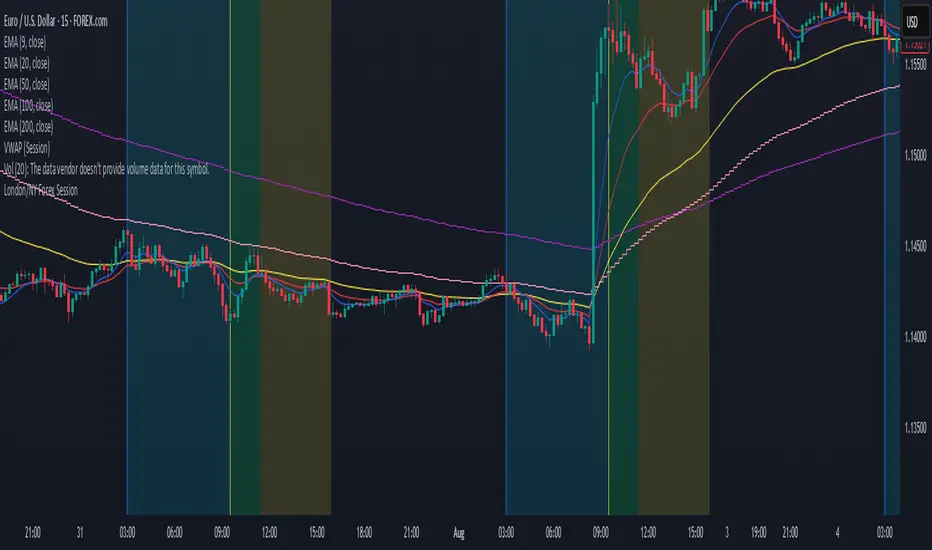
London/NY Forex SessionDesigned for Forex traders who want a clear view of market dynamics.
This tool highlights the most active trading windows of the day, helping you align with institutional moves and avoid low-liquidity periods.
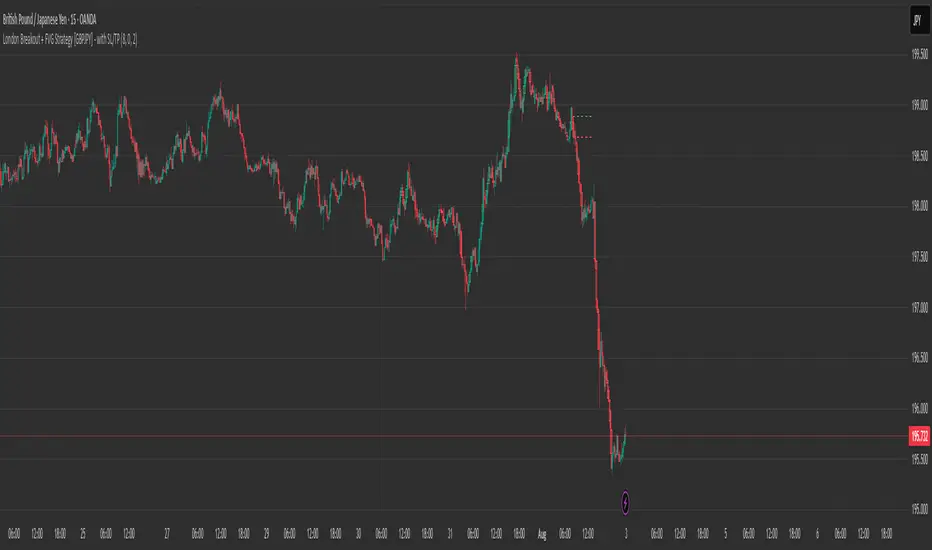
London Breakout + FVG Strategy [GBPJPY] - with SL/TPMarks the London open high and low on 15 min time frame, ads fvg on 5 min for orders
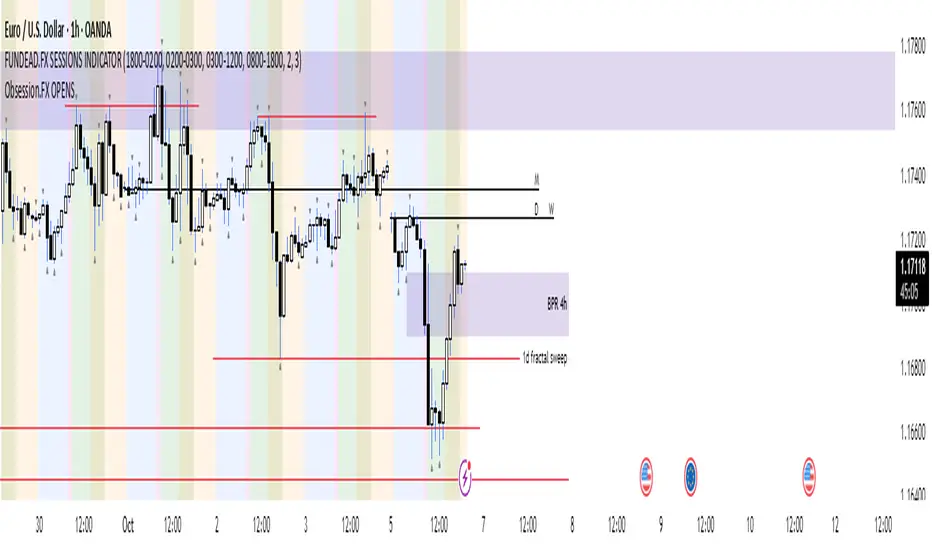
Obsession.FX Sessions IndicatorSession & Fractal Structure Tool — for Market Phases and Microstructure Analysis
This script combines session timeframes with local fractal identification to help traders analyze market context and structural shifts. It is designed for those applying Smart Money Concepts, where precise session boundaries and reactions to key levels are critical.
Session Zones
The script visualizes the three main trading sessions: Asia, London, and New York. It helps to:
– identify active phases of market participation;
– track each session’s Highs and Lows;
– interpret price behavior in relation to intraday liquidity shifts.
Each session is fully customizable — including start/end time, background and border colors, and display style (box, high/low lines, filled zones).
Fractal Structure
Fractals are shown as local highs and lows, supporting:
– detection of BOS/CHOCH on lower timeframes;
– building A→B ranges for structural flow;
– confirming short-term directional changes.
The fractal algorithm is optimized for responsiveness and clarity, with no repainting and minimal delay.
Purpose and Usage
This tool is intended for contextual reading of price action: determining the active session and monitoring price behavior within its boundaries, with a focus on microstructural reactions. It supports building precise entry logic based on the interaction between session ranges and fractal structure.
Closed Source Justification
The script is closed-source due to its use of proprietary logic for fractal detection and session integration, developed as part of a private trading methodology not available in public libraries.
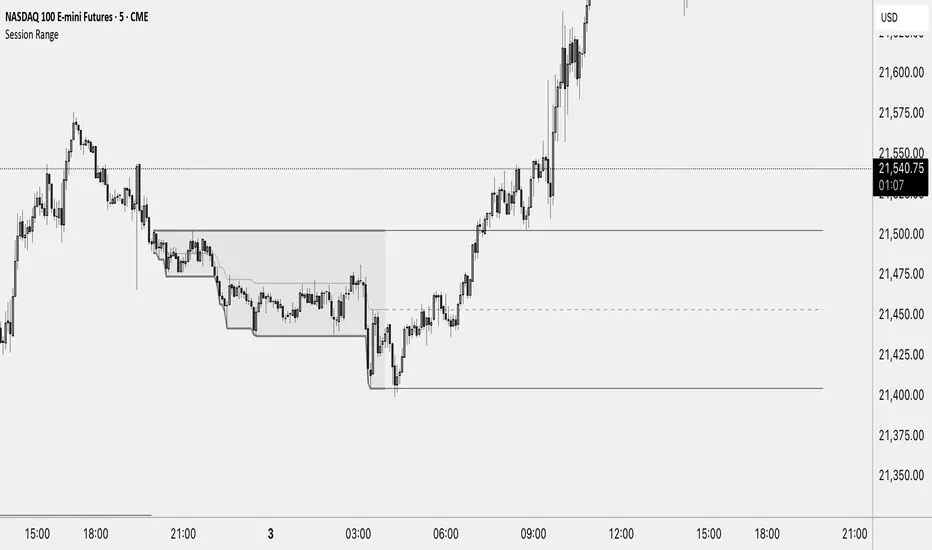
Session RangeThis Indicator Shows you the high, low and the midpoint for a chosen session and displays them on the chart.
You can make the following inputs:
Timezone: Choose your time zone (in UTC) to display the session correctly
Session Time: Choose the start time and end time of the session you want to have displayed.
Show Session Midpoint: Choose between displaying or not displaying the midpoint of the sessions high and low.
Extend Session Values until next Session: Choose this option if you want to display the sessions range until the next session starts. The midpoint will only be displayed if you chose "yes" at "Show Session Midpoint?"
Maximum number of bars between sessions: This is needed to ensure the correct display of the extended lines. Also this will affect the running speed of the script.
Limitations:
A higher number between bars slows down the script. What does that mean practically? If you choose to not have the sessions values displayed until the next session you can set this to 1 and the script will run as fast as it can. If you choose to display all the values until the next session you have to make sure that the number you put in is higher than the number of bars between the sessions. Otherwise the lines will be displayed backwards. As this affects the calculation speed you want to keep the number as low as possible. The default setting is 300 which is fine for 5 minute charts. On a 1 minute chart you will have to use something around 5000 depending on how long your session is.
Also the script will only run correctly if the start time of your session can be divided by the timeframe you are using. Example: you can use a 1min, 3min, 5min, or 15min chart on all sessions as they can only start every 15 minutes and 15 can be divided by all these numbers. A 2 minute timeframe will only work on sessions that start at minute 00 or 30, as 15 and 45 can not be divided by 2.
Customization and Alerts:
You can change the color of the sessions high, low, midpoint and background filling. The line style can also be changed but this might lead to a faulty display of the session.
The style of the extension lines can not be altered.
Alerts can be added for crossing the sessions high or low (after the session is finished). You do not have to display the extension lines in order to set an alert.
credit: The inspiration (especially for the look of this indicator) comes from the Asian Range by Nico948 indicator.
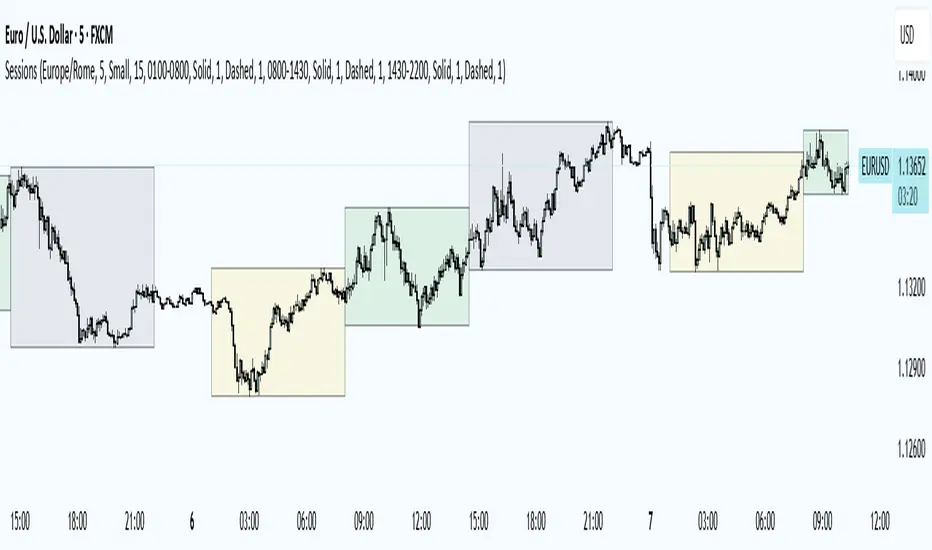
Trading Sessions
Trading Sessions
Highlights the Asia, London, and New York trading sessions with dynamic High-Low boxes.
General
Timezone : select your reference zone (e.g. Exchange, UTC, Europe/Rome, America/New_York).
Extend Session High/Low : extend the High/Low lines to the last candle.
Extend Lines (bars) : number of bars to extend lines beyond the last candle (0–100, default 15).
Show High/Low Labels : display labels for the High/Low levels.
Show Mitigated Levels : also show mitigated (broken) levels.
Show Only Recent Levels : filter levels from the last N days.
Number of Recent Days : sets how many days are considered “recent” (1–30).
Show Debug Info : enable a panel with current time, session status, and active filters.
Sessions
Asia , London , New York : enable or disable each session.
Session Time : set the start/end times with the time picker.
Box Color : choose a semi-transparent highlight color for each session.
Line Style & Width : customize style (Solid, Dotted, Dashed) and width of current and past High/Low lines.
Text Size : select the label text size (Tiny, Small, Normal, Large).
Show Only Recent Levels – filters High/Low lines to show only those from the last Number of Recent Days .
Number of Recent Days – sets how many days are considered “recent” for the filter.
Show Mitigated Levels – enables display of broken levels; otherwise only active levels remain visible.
Show High/Low Labels – toggles text labels at the ends of lines on or off.
Show Debug Info – displays a floating panel showing:
Current time in the selected timezone
On/Off status of Asia, London, NY sessions
Active filters (recent days, mitigated levels)
Line style settings for each session
Key Benefits
Visualize session-specific volatility and potential breakouts.
No historical limit: scroll back through any past sessions.
Filter and extend High/Low levels for precise price context.
Fully customize to fit any chart layout.
Ideal For
Intraday traders who need clear session boundaries and price level context.
London Judas Swing Indicator by PoorTomTradingThis indicator is designed to help people identify and trade the London Judas Swing by Inner Circle Trader (ICT).
UPDATES IN V2:
This is a v2 update with automatic timezone settings, there is no longer any need to adjust the time or offset for DST.
It will now also work on any chart that trades during the Asia and London sessions (20:00 - 05:00 NY Time), including crypto.
It is recommended to use this indicator on the 5 minute timeframe.
INTRODUCTION OF KEY CONCEPTS:
Swing Points are a candle patterns defining highs and lows, these are explained further down in the description in more detail. They are shown on the indicator by arrows above and below candles. They can be removed if you wish by turning their opacity to 0% in settings. Swing points are automatically removed when price trades beyond them (above swing highs, below swing lows).
The Asia Session can be set by the user, but is defined by default as 20:00 - 00:00 NY time. Lines are drawn at the high and low of the Asia Session and the Asian Range is set at midnight.
The London Session is defined as 02:00 - 05:00 NY time.
The user can also include the pre-London session (00:00 - 02:00) for detection of breakouts and Market Structure Breaks (MSBs - explained lower down in the description with examples). This is selected by default.
EXPLANATION OF INDICATOR:
During the London Session, the indicator will wait for a break of either the high or low of the Asian Range.
When this is detected, it will draw a dashed line where the breakout occurred and trigger an alert.
After the break of the Asian Range, the indicator will look for an MSB in the opposite direction, which is when price closes beyond a swing point opposing current price direction. The indicator will draw a line indicating the MSB point and trigger an alert.
Finally, the indicator will also trigger an alert when price returns to this MSB level, which is the most simple Judas Swing entry method.
The Judas swing
Example with chart for Judas Swing short setups -
Price breaks above the Asia High, no candle close is required, the indicator will then wait for price to close a candle below the last swing low.
A swing low is defined as a 3 candle pattern, with two candles on either side of the middle one having higher lows. When a candle closes below the middle candle's low, that is an MSB.
When price returns to the MSB point, the Take Profit and Stop Loss levels will appear.
When price goes to either the Stop Loss or Take Profit level, the MSB, TP and SL, lines will be removed.
After this, if price creates a new setup in the opposite direction, the indicator will also work for this, as shown in this example that occurred right after the first example
SETTINGS:
- The "Swing Point strength" can be adjusted in the settings.
Example:
For a swing low:
The default setting is 1 (one candle on each side of a middle candle has a higher low).
You can change this setting to 2, for a 5 candle pattern (two candles on each side of the middle candle have higher lows).
This can be changed to a maximum of 10. But only 1 or 2 is recommended especially on the 5 minute chart.
- ATR Length and Triangle Distance Multiplier settings are for adjusting how the swing point symbols appear on the chart.
This is to ensure triangles are not drawn over candles when price gets volatile.
The default setting is ideal for almost all market conditions, but you can play around with it to adjust to your liking.
- Alerts.
For alerts to be triggered, they must first be selected in settings.
Then you need to go on to the chart and right-click on an element of the indicator (such as the swing point symbols) and select "add alert on PTT-LJS-v2".
If after this, you change any settings on the indicator such as session times or pre-London session, you must add the alert again, and delete the old one if you wish.

London ORB + Session High/Low + FVGLondon ORB + Session High/Low + FVG
📘 Script Description: London ORB + Session High/Low + Fair Value Gap
This script is designed to assist intraday traders during the London session open by combining:
🕒 1. Opening Range Breakout (ORB)
Captures the high and low of the first 15-minute candle after the London open (08:00–08:15 GMT).
Draws lines and labels for the ORB High and Low levels.
Detects breakouts above or below the ORB and plots a triangle signal at the breakout bar.
🌐 2. Asian & US Session Levels
Automatically marks the highs and lows of the Asian (00:00–06:00 GMT) and US (13:30–20:00 GMT) sessions.
Useful for identifying prior session liquidity zones, key support/resistance levels, and potential reaction areas.
📉 3. Fair Value Gaps (FVG)
Highlights imbalances in price action between non-overlapping candles (also known as FVGs or inefficiencies).
Draws a shaded box between candles where gaps exist:
Green for bullish FVGs
Red for bearish FVGs
🔔 4. Alert Support
Optional alerts are built in for:
Long breakout (price breaks above ORB)
Short breakout (price breaks below ORB)
🎯 Use Case
Perfect for:
Day traders looking to capitalize on early volatility at the London open
Traders using liquidity-based strategies, retests, or gap-fills
Visualizing and aligning with prior session highs/lows for structure and context

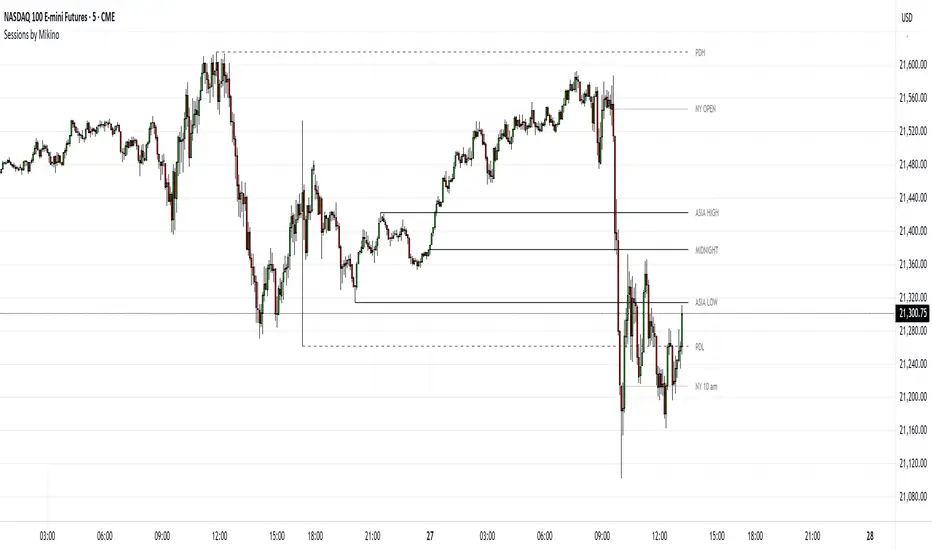
Sessions by MikinoAn indicator that draws lines from major price levels, made especially for NQ, ES and YM futures.
Features
• Show and hide any lines you want and don't need individually
• Customize how far the lines and labels are drawn (in bar length)
• Change label text, color, width and line type of any line drawn
Price levels (in NY time)
• "Show session open" - price at the beginning of the session at 6:00 PM
• "Show Asia open" - price at 8:00 PM
• "Show Asia high" - highest price during Asia session from 8 PM - midnight
• "Show Asia low" - lowest price during Asia session from 8 PM - midnight
• "Show London open" - price at 3:00/4:00 AM (depending on daylight savings time), at the start of London session
• "Show London high" - highest price during London session from 3:00/4:00 AM - 5:00/6:00 AM
• "Show Asia low" - lowest price during London session from 3:00/4:00 AM - 5:00/6:00 AM
• "Show midnight open" - price at midnight
• "Show New York open" - price at 9:30 AM
• "Show New York 10 am" - price at 10:00 AM (10 AM reversal)
• "Show previous day high" - highest price during yesterdays session (from 6:00 PM until 6:00 PM)
• "Show previous day low" - lowest price during yesterdays session (from 6:00 PM until 6:00 PM)
Limitations
All of the lines/labels will be drawn on the chart on up to hourly chart, with the exemption of PDH/PDL that can be drawn on up to 4 hour chart. PDH/PDL tracks each trading day from from 6:00 PM until 6:00 PM, Asia range from 8:00 PM until midnight, London from 3:00 AM until 05:00 AM. The indicator will work on different indices other than NQ, ES and YM, but some of the features might not work correctly due to what is considered a trading day.
Sessions Full Markets [TradingFinder] Forex Stocks Index 7 Time🔵 Introduction
In global financial markets, particularly in FOREX and stocks, precise timing of trading sessions plays a crucial role in the success of traders. Each trading session—Asian, European, and American—has its own unique characteristics in terms of volatility and trading volume.
The Asian session (Tokyo), Sydney session, Shanghai session, European session (London and Frankfurt), and American session (New York AM and New York PM) are examples of these trading sessions, each of which opens and closes at specific times.
This session indicator also includes a Time Convertor, enabling users to view FOREX market hours based on GMT, UTC, EST, and local time. Another valuable feature of this indicator is the automatic detection of Daylight Saving Time (DST), which automatically applies time changes for the New York, London, and Sydney sessions.
🔵 How to Use
The indicator also displays session times based on the exact opening and closing times for each geographic region. Users can utilize this indicator to view trading hours either locally or in UTC time, and if needed, set their own custom trading times.
Additionally, the session information table includes the start and end times of each session and whether they are open or closed. This functionality helps traders make better trading decisions by using accurate and precise time data.
Key Features of the Session Indicator
The session indicator is a versatile and advanced tool that provides several unique features for traders.
Some of these features are :
• Automatic Daylight Saving Time (DST) Detection : This indicator dynamically detects Daylight Saving Time (DST) changes for various trading sessions, including New York, London, and Sydney, without requiring manual adjustments. This feature allows traders to manage their trades without worrying about time changes.
Below are the start and end dates for DST in the New York, London, and Sydney trading sessions :
1. New York :
Start of DST: Second Sunday of March, at 2:00 AM.
End of DST: First Sunday of November, at 2:00 AM
2. London :
Start of DST: Last Sunday of March, at 1:00 AM.
End of DST: Last Sunday of October, at 2:00 AM.
3. Sydney :
Start of DST: First Sunday of October, at 2:00 AM.
End of DST: First Sunday of April, at 3:00 AM.
• Session Display Based on Different Time Zones : The session indicator allows users to view trading times based on different time zones, such as UTC, the local time of each market, or the user’s local time. This feature is especially useful for traders operating in diverse geographic regions.
• Custom Trading Time Setup : Another notable feature of this indicator is the ability to set custom trading times. Traders can adjust their own trading times according to their personal strategies and benefit from this flexibility.
• Session Information Table : The session indicator provides a complete information table that includes the exact start and end times of each trading session and whether they are open or closed. This table helps users simultaneously and accurately monitor the status of all trading sessions and make better trading decisions.
🟣 Session Trading Hours Based on Market Mode and Time Zones
The session indicator provides precise information on the start and end times of trading sessions.
These times are adjusted based on different market modes (FOREX, stocks, and TFlab suggestions) and time zones (UTC and local time) :
🟣 (FOREX Session Time) Forex Market Mode
• Sessions in UTC (DST inactive) :
Sydney: 22:00 - 06:00
Tokyo: 23:00 - 07:00
Shanghai: 01:00 - 09:00
Asia: 22:00 - 07:00
Europe: 07:00 - 16:00
London: 08:00 - 16:00
New York: 13:00 - 21:00
• Sessions in UTC (DST active) :
Sydney: 21:00 - 05:00
Tokyo: 23:00 - 07:00
Shanghai: 01:00 - 09:00
Asia: 21:00 - 07:00
Europe: 06:00 - 15:00
London: 07:00 - 15:00
New York: 12:00 - 20:00
• Sessions in Local Time :
Sydney: 08:00 - 16:00
Tokyo: 08:00 - 16:00
Shanghai: 09:00 - 17:00
Asia: 22:00 - 07:00
Europe: 07:00 - 16:00
London: 08:00 - 16:00
New York: 08:00 - 16:00
🟣 Stock Market Trading Hours (Stock Market Mode)
• Sessions in UTC (DST inactive) :
Sydney: 00:00 - 06:00
Asia: 00:00 - 06:00
Europe: 07:00 - 16:30
London: 08:00 - 16:30
New York: 14:30 - 21:00
Tokyo: 00:00 - 06:00
Shanghai: 01:30 - 07:00
• Sessions in UTC (DST active) :
Sydney: 23:00 - 05:00
Asia: 23:00 - 06:00
Europe: 06:00 - 15:30
London: 07:00 - 15:30
New York: 13:30 - 20:00
Tokyo: 00:00 - 06:00
Shanghai: 01:30 - 07:00
• Sessions in Local Time:
Sydney: 10:00 - 16:00
Tokyo: 09:00 - 15:00
Shanghai: 09:30 - 15:00
Asia: 00:00 - 06:00
Europe: 07:00 - 16:30
London: 08:00 - 16:30
New York: 09:30 - 16:00
🟣 TFlab Suggestion Mode
• Sessions in UTC (DST inactive) :
Sydney: 23:00 - 05:00
Tokyo: 00:00 - 06:00
Shanghai: 01:00 - 09:00
Asia: 23:00 - 06:00
Europe: 07:00 - 16:00
London: 08:00 - 16:00
New York: 13:00 - 21:00
• Sessions in UTC (DST active) :
Sydney: 22:00 - 04:00
Tokyo: 00:00 - 06:00
Shanghai: 01:00 - 09:00
Asia: 22:00 - 06:00
Europe: 06:00 - 15:00
London: 07:00 - 15:00
New York: 12:00 - 20:00
• Sessions in Local Time :
Sydney: 09:00 - 16:00
Tokyo: 09:00 - 15:00
Shanghai: 09:00 - 17:00
Asia: 23:00 - 06:00
Europe: 07:00 - 16:00
London: 08:00 - 16:00
New York: 08:00 - 16:00
🔵 Setting
Using the session indicator is straightforward and practical. Users can add this indicator to their trading chart and take advantage of its features.
The usage steps are as follows :
Selecting Market Mode : The user can choose one of the three main modes.
Forex Market Mode: Displays the forex market trading hours.
oStock Market Mode: Displays the trading hours of stock exchanges.
Custom Mode: Allows the user to set trading hours based on their needs.
TFlab Suggestion Mode: Displays the higher volume hours of the forex market in Asia.
Setting the Time Zone : The indicator allows displaying sessions based on various time zones. The user can select one of the following options:
UTC (Coordinated Universal Time)
Local Time of the Session
User’s Local Time
Displaying Comprehensive Session Information : The session information table includes the opening and closing times of each session and whether they are open or closed. This table helps users monitor all sessions at a glance and precisely set the best time for entering and exiting trades.
🔵Conclusion
The session indicator is a highly efficient and essential tool for active traders in the FOREX and stock markets. With its unique features, such as automatic DST detection and the ability to display sessions based on different time zones, the session indicator helps traders to precisely and efficiently adjust their trading activities.
This indicator not only shows users the exact opening and closing times of sessions, but by providing a session status table, it helps traders identify the best times to enter and exit trades. Moreover, the ability to set custom trading times allows traders to easily personalize their trading schedules according to their strategies.
In conclusion, using the session indicator ensures that traders are continuously and accurately informed of time changes and the opening and closing hours of markets, eliminating the need for manual updates to align with DST changes. These features enable traders to optimize their trading strategies with greater confidence and up-to-date information, allowing them to capitalize on opportunities in the market.

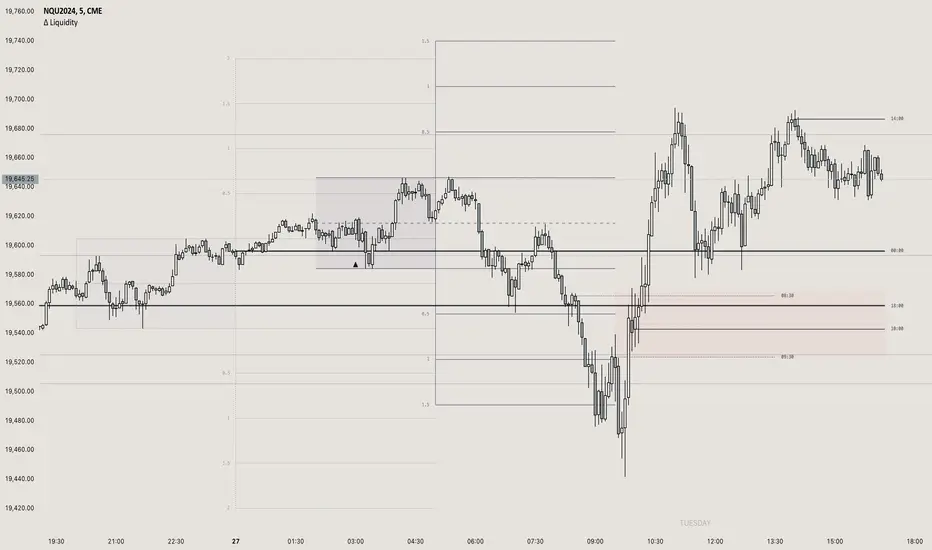
itradesize /\ Previous Liquidity x ICTI’d like to introduce a clean and simple RTH gap and liquidity levels indicator with additional Asian and London ranges, along with standard deviation levels and many customizable options.
Previous D/W/M highs and lows are areas where liquidity tends to accumulate. This is because many traders place stop-loss orders around these levels, creating a concentration of buy stops above the previous day's high and sell stops below the previous day's low. High-frequency trading algorithms and institutional traders often target these areas to capture liquidity.
What the indicator could show in summary?
- Regular trading hours gap with deviations
- Asia with deviations (lines or boxes)
- London with deviations (lines or boxes)
- Weekdays on chart
- 3 AM candle marker
- Previous D/W/M levels
- Important opening times (08:00, 09:30, 10:00, 14:00, 00:00, 18:00)
- Daily separators
By marking out the previous day's highs and lows, traders can create a framework for their trading day. This helps in identifying potential setups and understanding where significant price action might occur. It also aids in filtering out noise and focusing on the most relevant price levels.
These levels can also act as potential reversal points. When the market reaches a previous high or low, it might reverse direction, especially if it has raided the liquidity resting there. This concept is part of a strategy where traders look for the market to raid these levels and then reverse, providing trading opportunities
The indicator shows previous liquidity levels on a daily, weekly, and monthly basis. It also displays opening times at 8:30, 9:30-10:00, 14:00-00:00, and 18:00. Opening times are crucial in trading because they help define specific periods when market activity is expected to be higher, which can lead to better trading opportunities. The script has been made mostly for indices.
You can create various entry and exit strategies based on the indicator. Please remember, that adequate knowledge of ICT is necessary for this to be beneficial.
You might wonder why only these times are shown. This is because these are the times when the futures market is active or should be active. It's important to note that opening times can vary between different asset classes.
18:00 A new daily candle open
00:00 Midnight open
02:00 New 4-hour candle open
08:30 High-impact news
09:30 NY Equities open
10:00 New 4-hour candle open
The concept of "Asian Killzone Standard Deviations" involves using the Asian trading session's price range to project potential price movements during subsequent trading sessions, such as the London or New York sessions. This is done by calculating standard deviations from the Asian range, which can help traders identify potential support and resistance levels.
You can create a complete model by exclusively focusing on the Asian time zone. Deviations within this zone may have varying impacts on future price movements, and the Interbank Price Delivery Agreement (IPDA) often reflects Asia's high, close, and low prices.
A similar approach can be taken with the London time zone. The standard deviation levels within each zone could potentially serve as support or indicate reversals, including liquidity hunts. It's important to backtest these ideas to gain reliable insights into when and where to apply them.
* Asian Range: This is the price range established during the Asian trading session. It serves as a reference point for calculating standard deviations.
* London Range: The same applies to the London range as well. Combine standard deviation projections with other technical analysis tools, such as order blocks or fair value gaps, to enhance accuracy.
* Standard Deviations: These are statistical measures that indicate the amount of variation or dispersion from the average. In trading, they are used to project potential price levels beyond the current range.
You can also use regular trading hours gap as a standalone model. The 4 STDV and 2.5 STDV levels are important for determining the high or low of the current price action.
The RTH gap is created when there is a difference between the closing price of a market at the end of one trading day and the opening price at the start of the next trading day. This gap can be upward (gap higher), downward (gap lower), or unchanged. It is significant because it often indicates market sentiment and can create inefficiencies that traders look to exploit.
Alternatively, you can combine these elements to create a complete strategy for different scenarios.
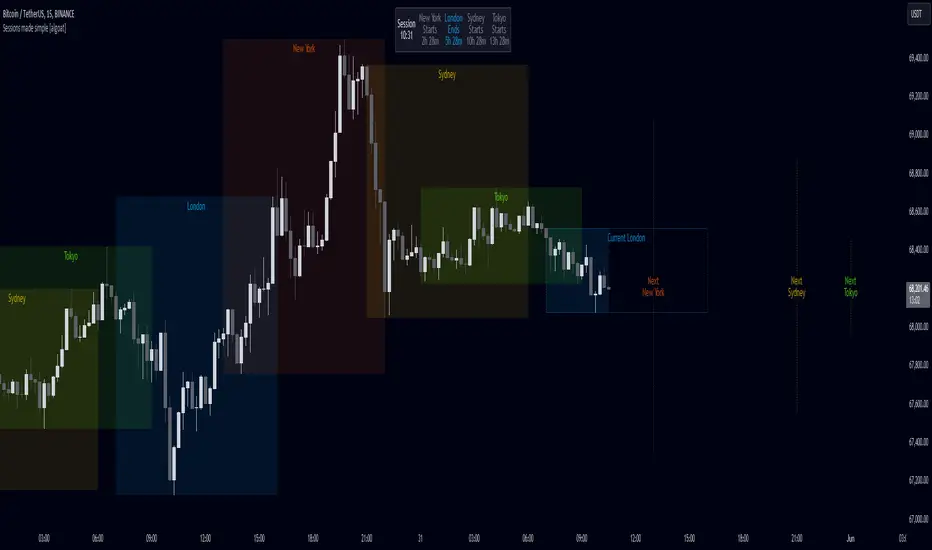
Sessions made simple [algoat]The indicator — by default — provides a clear and concise representation of the four major global trading sessions. Each session is distinctly marked on your trading chart, helping you visualize the specific time periods when these markets are most active. Whether you're a day trader looking to exploit intraday volatility or a long-term investor wanting to understand broader market trends, the Market Sessions feature can be a useful tool in your trading toolkit. The indicator comes with a dashboard, displaying the remaining time until the session end if the session is active and next start if the session is inactive.
Don't forget to align indicator timezone settings according to your region!
⭐ Key Features:
Visual Session Markers
Each of the four trading sessions is fully configurable by visibility, title, time range, and more. The enabled sessions are distinctly marked on the chart with customizable colors, various display options, current sessions' end time and next sessions' start time.
Session Dashboard
The indicator includes a dashboard that displays the remaining time until the session end if the session is active, and the next start time if the session is inactive. This feature provides a quick reference for traders to plan their trading activities.
Timezone Settings
Easily align the indicator's timezone settings with your region by entering your time zone's offset in UTC hours. This ensures that the session times are accurately displayed according to your local time.
Weekend Visibility
Optionally, you can choose to display or hide weekend sessions based on your trading preferences.
Flexible Configuration
The indicator allows for various configurations such as the maximum timeframe for session display, the position of the dashboard, and the text size for better readability.
══════════════════
🧠 General advice
Trading effectively requires a range of techniques, experience, and expertise. From technical analysis to market fundamentals, traders must navigate multiple factors, including market sentiment and economic conditions. However, traders often find themselves overwhelmed by market noise, making it challenging to filter out distractions and make informed decisions. By integrating multiple analytical approaches, traders can tailor their strategies to fit their unique trading styles and objectives.
Confirming signals with other indicators
As with all technical indicators, it is important to confirm potential signals with other analytical tools, such as support and resistance levels, as well as indicators like RSI, MACD, and volume. This helps increase the probability of a successful trade.
Use proper risk management
When using this or any other indicator, it is crucial to have proper risk management in place. Consider implementing stop-loss levels and thoughtful position sizing.
Combining with other technical indicators
Integrate this indicator with other technical indicators to develop a comprehensive trading strategy and provide additional confirmation.
Conduct Thorough Research and Backtesting
Ensure a solid understanding of the indicator and its behavior through thorough research and backtesting before making trading decisions. Consider incorporating fundamental analysis and market sentiment into your trading approach.
══════════════════
⭐ Conclusion
We hold the view that the true path to success is the synergy between the trader and the tool, contrary to the common belief that the tool itself is the sole determinant of profitability. The actual scenario is more nuanced than such an oversimplification. A word to the wise is enough: developed by traders, for traders — pioneering innovations for the modern era.
Risk Notice
Everything provided by algoat — from scripts, tools, and articles to educational materials — is intended solely for educational and informational purposes. Past performance does not assure future returns.
B A N K $ - Advanced Session RangesThis is a simple indicator that has been designed to aid intraday trading and has a few components;
Key Features
Session Ranges + Optimal Exit Time
Asia Pip Range
New York Midnight Open Line
Session Ranges + Optimal Exit Time
Information ℹ️
This is a visual depiction of the 3 main sessions in the markets. Asia, London & New York. The default timings are set to perfectly align with each session however the Start & End times for each session can be changed in the settings. (I've added a website on the tooltip to easily convert timezones)
I have also added a 4th session range called "Optimal Exit Time". This is statistically the most probable time window for the opposite High / Low of Day to form is within this window. It helps the trader understand when they should look to take profit.
How It Works 🔑
The indicator automatically maps on two lines for the High & Low of the range between the selected Start & End time, it also colours the background.
The individual lines & background can be toggled & customised to the traders preference.
Asia Pip Range
Information ℹ️
This displays the Asia Range in pips beneath the Asia Session Low.
How It Works 🔑
This calculates the distance between the Asia High - Asia Low in pips. It will automatically recalibrate to the timings the trader sets in the settings if they change the Start / End.
New York Midnight Open Line
Information ℹ️
This helps look for Buys beneath the line for a Bullish Expansion day 📈 & Sells above the line for a Bearish Expansion day 📉
How It Works 🔑
This adds a horizontal line to the chart that is anchored to New York Midnight Open (00:00) by default. It can be changed in the settings in required. You can also toggle on the time being shown above the line.

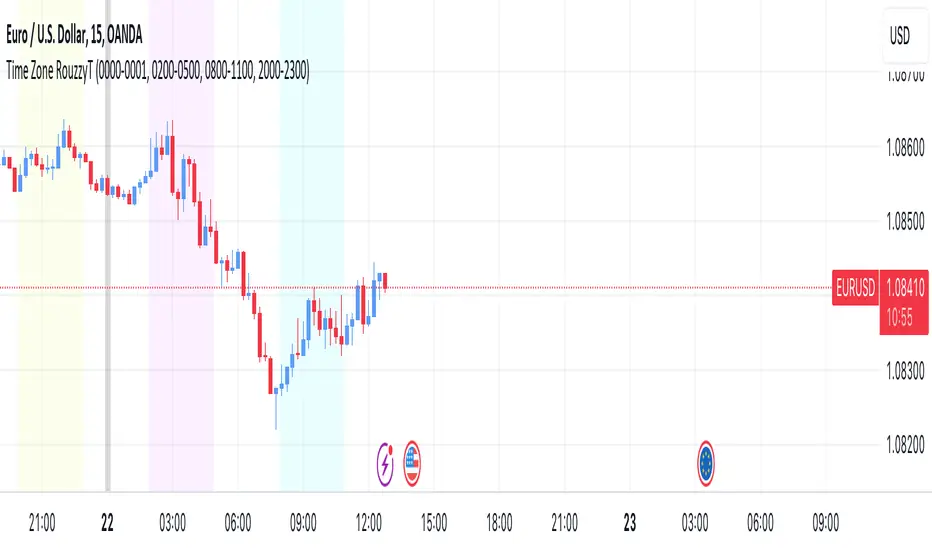
Time Zone RouzzyTNYC , London & Asia section
Each time-zone has a different color to be able to distinguish which section we are in at the moment.
These sessions have been identified to operate the EURUSD, apart from that it also works with the DXY.
London is identified with the color light purple.
NYC is identified with the color turquoise blue.
Asia is identified with the color yellow.
The beginnings of each Day are identified with the color gray.
London is from 2am to 5am
NYC from 8am to 11am
Asia from 8pm to 11pm
OANDA:EURUSD
FX:EURUSD
TVC:DXY
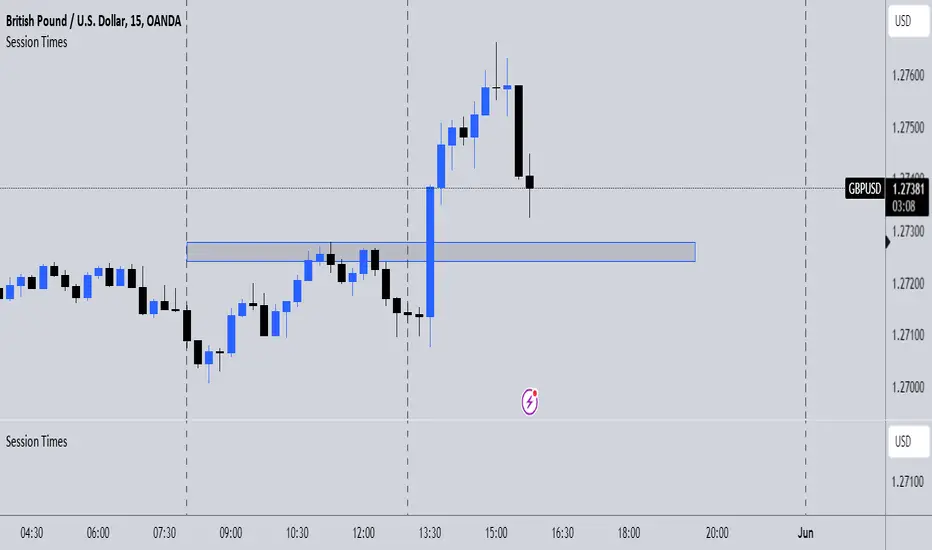
Session TimesDescription:
This indicator simply when enabled will draw dashed lines at each of the session openings. This is based on UTC+1 Time. There will be lines at 00:00 & 08:00 (Asian Session), lines at 08:00 & 13:00 (London Session) and finally lines at 13:00 & 00:00 (New York Session).
Potential Use:
There are many ways you could use this indicator to benefit your trading, but the best way I find is that it makes it clear where the previous highs and lows are of a session, which are potential areas you could trade off. Obviously, there are many other ways you can use this to help you.
How The Script Works:
The way the script works isn't too complicated as it is only a short script. Simply it firstly calculates what are the weekdays (Whenever it isn't Saturday or Sunday). Then from there simply finds the times which I mentioned above, and adds a vertical dashed line there.
Future Updates:
In the future I will mainly be looking to make the indicator more customisable. Firstly, I will look to make it so that the user can adjust the times that the lines are drawn at so it still works wherever you are in the world. I would also like to make it so the user can choose the colour of the lines. If you have any other additions you would like added to this, then feel free to message me.
Sessions [TradingFinder] New York, London, Tokyo & Sydney ForexTiming is one of the influential factors in a trader's position. This indicator categorizes transactions into three sessions (Asia, Europe, and America). Five significant trading cities (New York, London, Frankfurt, Tokyo, and Sydney) are selectable.
I recommend using the tool on a 5-minute time frame, but it is usable on all time frames.
Settings:
• Trading sessions: Display or hide each trading session as needed.
• Color: Change the color of each box.
• Session time intervals: The default is based on the main working hours for each time interval and can be adjusted.
• Information table: Delete or display additional information table.
Information Table:
• Trading sessions
• Opening and closing times of each trading session
How to Use:
Initiating trading sessions involves entering with increased liquidity, and the market usually experiences significant movements. Many trading strategies are based on "time" and "session openings." This tool empowers traders to focus intensely on each time interval.
These trading sessions are crucial for all Forex, stock, and index traders:
The total price ceiling and floor in the Asia session (Tokyo and Sydney) are crucial for traders in the European session.
The European session starts with Frankfurt, and an hour later, London begins, collectively forming the European session.
The dashboard provides additional information, displaying hours based on UTC.
Customization options are considered in all sections so that everyone can apply their own settings.
Important: Default times are the most accurate for each region, and in most indicators, this time is not correctly selected. Therefore, the level of influence and time intervals are specified at the beginning of each session. If you are using another indicator, match its default time to the announced time and share the results with me in the comments.
