M-oscillator

Hancock - Filtered Volume OBV OSC [Strategy]Trading strategy based on Donchain channel price breakouts confirmed by an optionally configurable volume filtered OBV oscillator.
Colored diamonds on charts represent signals where top side is buy side and bot side is sell side - green indicates open and red indicates close.
Pretty simple but nicely demonstrates the volume filtered OBV oscillator found here .
Happy trading
Hancock

[GM PRO] ASH+The Absolute Strength Histogram with built in strategy tester to help you find optimum trade entries, and best parameters for your System.
Includes
- Backtest start date
- Backtest end date
- Money Managment (percent risk, stop loss and take profit distance and ratio).
- Fully Featured Absolute Strength Histogram - with many MA modes and options.
The indicator comes with default settings. It is up to you to fine tune and find the optimal settings for the market you trade.
Coming Soon - Full fledged Algorithms - including entries, exits, and volatility/volume filters to keep you out of those choppy sideways markets. Look for the GM ELITE tag.

Early Reverseal Signal Indicator (ERSI). [Fournier-Eaton]ERSI: EARLY REVERSAL SIGNAL INDICATOR
ABOUT:
ERSI is an dynamically sensitive trend-strength oscillator.
ERSI uses a weighted best-fit synthesis of volume metrics, money flow , and self-adjusting lengths and look-backs to capture optimal buy and sells signals.
ERSI default settings are optimized for a 1-month view, 30m candle
Default settings are generally suited to 1 month chart with 30min candle
Gray -> Red = SELL
RED -> Gray = BUY
Early Alerts: crossover of black and red lines.

Incremental Order size +This is an old and incomplete script that is being pulled up and dusted off as per request.
The sole purpose of this script was to provide code snippets allowing one to easily convert their own script/strategy to include incremental order sizes. More control over your pyramiding orders.
**It may repaint, and was not intended for trading but more as an attempt to provide examples for more control with pyramiding.

Trade Like a Whale Stategy1st draft of TLAW strategy. Has been tested on hourly and above BTC chart on Bitstamp. Still being tweaked for performance across all time frames and assets

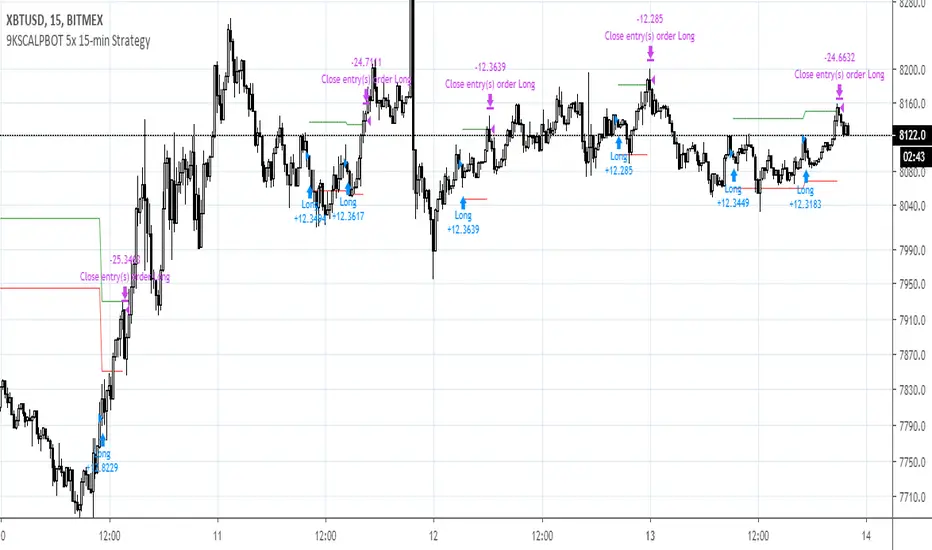
9KSCALPBOT 5x 15-min StrategyThis scalp bot uses low leverage to scalp small but high certainty movements on the 15-minute timeframe. Its amazing proprietary feature addresses the common problem of accumulated losses due to excessive stop-lossing -- this is done by assessing macro trends on higher timeframes when underwater, and then riding the position out until profitable again. You will get an average of about 1 entry and 1 exit per day.
The core logic uses a modified combination of CCI and Schaff Trend oscillators and a proprietary pattern recognition mechanic. Leverage should be kept low (5X or less) as the algorithm could temporarily go significantly underwater as well as pyramid (stack) same direction entries up to five times before closing. Any leverage higher than 5X significantly increases risk of liquidation. This bot has been consistently backtested for 10 months with about 75-85% win rate, 100%+ 3-month profitability, very low ~5% drawdown, all after factoring typical BitMex fees (0.06% after counting affiliate self-referral).
As with any automated strategy, it does not account for black swan events or disruptions in server connectivity (e.g., BitMex overload errors).
Trading Associates slot saverIncludes:
Pivot Reversal Strategy (Source code: pastebin.com )
Donchian Channels
Bollinger Bands
6 MAs with crossing indicator
4 EMAs
Candlestick Patterns identified by repo32
Support and Resistance by RicardoSantos (I just changed it a bit)
Weekly and Daily Pivot Points
Ichimoku Cloud with my parameters
VWAP
You can save some slots with this indicator on Tradingview. Take advantage of it.
The pivot reversal strategy isn't bad on higher timeframes, bot it if you want to.
Cheers

inwCoin ActionZone - Ignore first red StrategyinwCoin Action Zone Ignore 1st Red Candle Strategy.
Description : Action Zone is easier version of painting MACD on the chart.
If MACD signal line above zero = bar will become Green = buy signal
If MACD signal line under zero = bar will become Red = sell signal
This alteration is just a proof of concept to answer these questions;
* What will happen if we just ignore the first red bar after we just enter position?
* If red bar is between entry price and stop loss price, we'll not sell the position.
* We'll sell when red bar is above entry price and stop loss price only.
* We'll also stop loss if price drop below previous high
* We can avoid the false signal by just holding position until we get stop out... is it worth? ( Compare with regular Action Zone strategy )
The Result ;
* Some assets gave better backtest result with this tweak strategy.
* But some assets perform worse than original action zone...
* After tried with Thai Stock, this strategy is no match with the original action zone.
Conclusion;
* You can try this strategy to see the result by yourself.
========================
inwCoin Action Zone Ignore 1st Red Candle Strategy ( ชื่อยาวไปไหน )
ก็ไม่มีอะไรมากครับ เอา Action Zone ตัวธรรมดามาทดสอบคอนเซ็ปที่ลุงโฉลกได้สอนไว้ ว่า
" ถ้า Action Zone เขียว แล้วแดงแรก ให้เราไม่สนมันไปก่อน"
ผมก็เลยลองเขียน backtest ขึ้นมาดู เพราะอยากรู้ว่า วิธีนี้มันจะเวิร์คหรือไม่เวิร์ค
หลังจากลองทดสอบกับ หุ้นไทย จำนวน 200 กว่าตัว ก็พบว่า...
วิธีนี้ ยังไงก็ยังได้ผลกำไรแพ้ Action Zone Quick Exit ครับ
คือมันจะมีบางตัวนะ ที่ได้กำไร ชนะ Action Zone ธรรมดา แต่หลายๆ ตัว และส่วนใหญ่ด้วย ที่ขาดทุนแล้ว ขาดทุนหนัก
ตอนนี้ ถ้าให้พูดตรงๆ ตัวกลยุทธ inwCoin Break Previous High ยังให้ผลโดยรวม ที่ค่อนข้างดีอยู่ครับ
ใครอยากเอาไปลองเล่น ก็ลองไปใส่กราฟดูได้ครับ

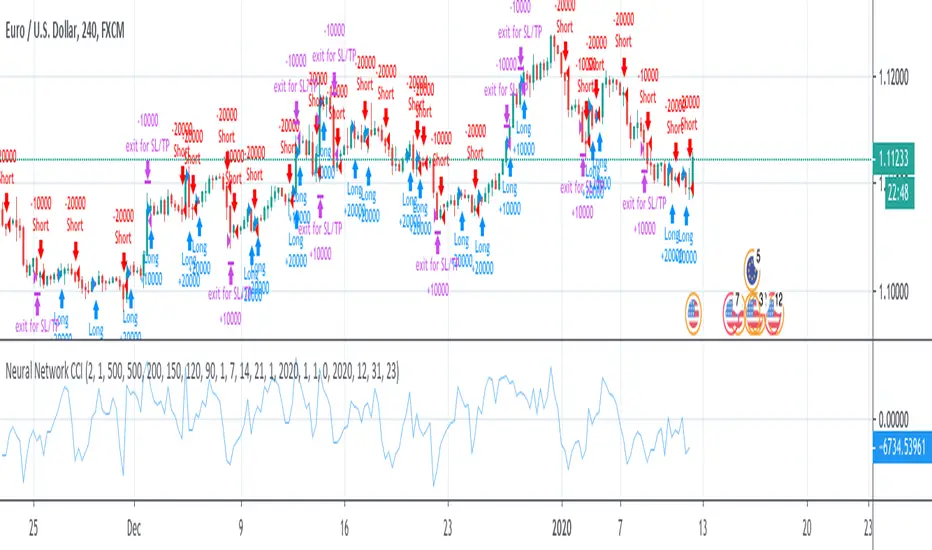
Neural Network CCI - RSIThis is a test of neural network with one layer.
Two layers will follow soon.
Signals are given by CCI or RSI.
Method 1 triggers a change of oscillator (buy if >0)
Method 2 triggers oscillator over 0 (for CCI only)
How to use:
1- launch the strategy on a chart,
2- open "Strategy Tester" tab
3- open startegy option panel
4- modify x11, x12, x13 and x14 to get the best results (net profit, profit factor, drawdown, etc...)
5- repeat once a week
Need help with self-optimization: I couldn't yet found a formula to optimize profit or win% or whatever changing values of x11, x12, x13 and x14 inside the strategy.
Voss Strategy (Filter + Trend Indicator) [Bitduke]Created strategy based on Voss Predictive Filter, implemented by TradingView user e2e4mfck.
Voss Predictive Filter
This is a relatively new filter from John F. Ehlers’ article, “A Peek Into The Future .” Ehlers describes the calculation of a new filter that could help signal cyclical turning points in markets.
But filter has a negative group delay and while an indicator based on it cannot actually see into the future, it may provide the trader with signals in advance of other indicators.
In mentioned article he tested filter on SPY and at one point in time "it went into a trend mode in January 2019, and the cycle signal failed miserably, signaling a short position during the runup. <...> The only way to minimize the impact of this condition is to employ an additional trend detector."
Thus I've added another Ehlers' based trend based indicator Instantaneous Trendline (thanks to LazyBear for implementation) to minimize the impact of the trend mode and got a good results on XBTUSD pair 4h.
Backtest :
> Range: 2016 - 2020
> XBTUSD
> 4h
> ~20% drawdown
> Sharpe (0.361, not too impressive)
I think it can be improved with Risk Management system and experimenting with various trend following indicators.

RSI-VWAPBacktest script based on the previous RSI-VWAP indicator:
It's the popular RSI indicator with VWAP as a source instead of close:
- RSI_VWAP = rsi(vwap(close), RSI_VWAP_length)
What is the Volume Weighted Average Price ( VWAP )?
VWAP is calculated by adding up the dollars traded for every transaction (price multiplied by the number of shares traded) and then dividing by the total shares traded.
Trades are laddered to improve the average entry price and each entry is increased, improving the entry but increasing the risk of being liquidated.
It can be easily converted to study (alerts)
Settings for BINANCE:BTCUSDT at 30m

RSI-VWAP INDICATORThis simple indicator provides great results.
It is the popular RSI indicator with VWAP as a source instead of close.
What is the Volume Weighted Average Price (VWAP)?
VWAP is calculated by adding up the dollars traded for every transaction (price multiplied by the number of shares traded) and then dividing by the total shares traded. That is, volume.
On the Backtest, trades are laddered to improve the average entrance price.

Pozipozi Bouya ver.USDJPYThis is a version of the indicator for USDJPY that incorporates the Pozipozi Bouya Indicator.
It is a plot of the starting up trend and down trend
Multi RIS Length RSI Strategy calibrated to 20min timeframeI have been working on many itterations of this script, on multiple time frames, with multiple settings.
It's not exactly how I want it, but if used on the 20 min timeframe (I chose this one to publish, not because it's the most profitable, or percent profitable , but for multiple other reasons.
1) From my back testing, this seems to be the most stable (gives the greatest margin for error). By that I mean, I am not a bot, I am a human trader, so I actually have to sleep, and work, and can't always trade all the time when I when I get my signals. So I need some margin of error.
The 20min time frame gives me this, it's still decently profitable (52K), and allows me some margin of error for being human.
2) It not exactly how I want it, because you have to use it in conjunction with the strategy tester to see if it is in longs or shorts (open trades). You can't see that on the app, or even if you are logged in to TV on a browser on a smart phone. At least I cant, I can only see the strategy tester when I am logged in on my computer, which obviously I can not be all the time.
3) It's also not exactly how I want it because it doesn't tell you when it is switching from buying additional longs (or shorts), and closing them out, and reversing. You can figure this out from the strategy tester, but I would like my script to make it more clear in real time.
4) The alerts on the script only fire after the current bar is closed. So really to use this you need to be a non free member or TV, because then you can add the appropriate RSIs to your chart, and set up real time alerts on them that will fire in real time, as opposed to displaying on the chart after the bar closes (a lot can happen in 20 minutes). Which is sad, and not my intent, I want this to be useful to free members, I just don't know how to do that given they don't have custom time frames (like 20 min), and multiple real time alerts. I can't fix that, that's a limitation of TV.

Combo Backtest 123 Detrended Price Oscillator This is combo strategies for get a cumulative signal.
First strategy
This System was created from the Book "How I Tripled My Money In The
Futures Market" by Ulf Jensen, Page 183. This is reverse type of strategies.
The strategy buys at market, if close price is higher than the previous close
during 2 days and the meaning of 9-days Stochastic Slow Oscillator is lower than 50.
The strategy sells at market, if close price is lower than the previous close price
during 2 days and the meaning of 9-days Stochastic Fast Oscillator is higher than 50.
Second strategy
The Detrend Price Osc indicator is similar to a moving average,
in that it filters out trends in prices to more easily identify
cycles. The indicator is an attempt to define cycles in a trend
by drawing a moving average as a horizontal straight line and
placing prices along the line according to their relation to a
moving average. It provides a means of identifying underlying
cycles not apparent when the moving average is viewed within a
price chart. Cycles of a longer duration than the Length (number
of bars used to calculate the Detrend Price Osc) are effectively
filtered or removed by the oscillator.
WARNING:
- For purpose educate only
- This script to change bars colors.
Multi-Oscillator Divergence StrategyNote: This is a modified version of TradingView's built-in "Divergence Indicator" and applied in "Strategy" format to show back testing results
It finds bullish and bearish divergence in a selection of well known MA formulas: MACD, RSI, STOCH, DETRENDED PRICE OSCILLATOR, MOMENTUM.
I've found good results even on 1 minute charts!
In this example the chart backtest is utilizing the detrended price oscillator (DPO)
There are multiple variables, so the ability to find good back test can sometimes be "time consuming"
And please note that if you increase "Pivot LookBack Right" variable too high, then you will increase chance of repaint. Keep this variable as low as possible
I've also drawn my own solutions on the chart (red and green trend lines) to find good take profit and safe stop loss. In order to study this properly you need the own the chart. Scripts don't give you this option.
See private chart publication link to "own" the chart for yourself. Simply click on the "Share" button (it's the megaphone icon) and click on "Make it Mine"
I've found the best approach is to create 5 copies of indicator on 1 chart and have each running with different MA formula. This will give you a majority consensus type environment.
I will post study with alert conditions next
Good luck and enjoy!

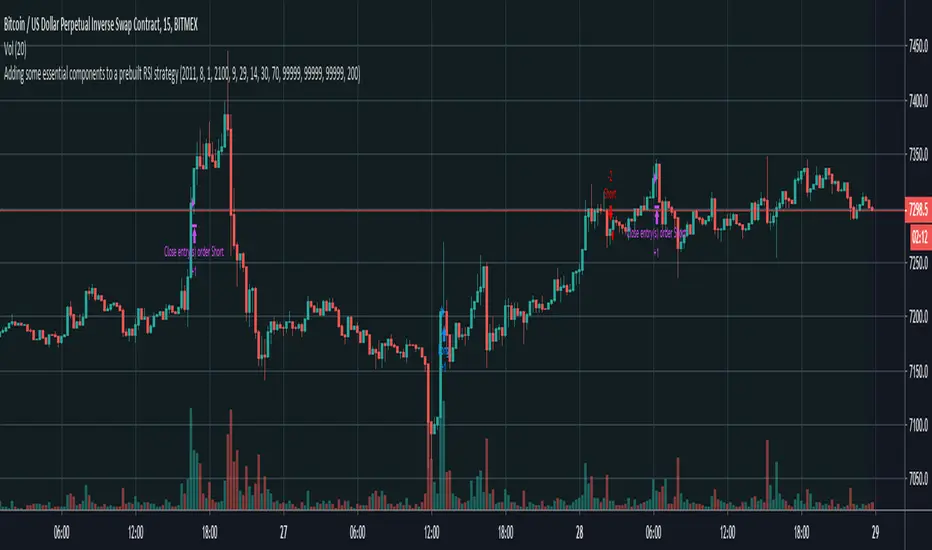
Adding some essential components to a prebuilt RSI strategy v4Taken from and just updated to compile in version 4. Added notes for users on where to swap out RSI component with their setup components to signal a long or short position.
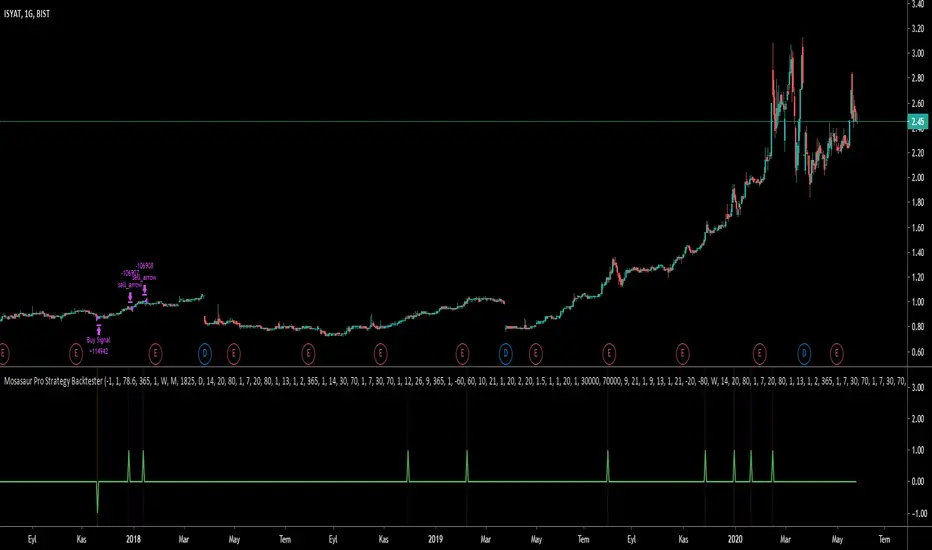
Mosasaur Pro BacktesterBacktester indicator for Mosasaur ◬ | Comprehensive & Profitable Trading Setup Builder available for free here.
Scroll all the way down in the setting menu to adjust the backtesting strategy.
Current features:
Find out the backtesting results for your customized strategy.
Set alerts for strong buy, buy, strong sell and sell signals.
Option for waiting fractal candle stick pattern before entering or exiting.
All features and setups used can be found on this tradingview page.
This backtester has settings of:
Setting 1 lets user select the source for putting a buy order.
Setting 2 lets user select the source for putting a sell order.
Setting 3 defines how much percent user wants to risk per trade to buy.
Setting 4 defines maximum possible trades for buying.
Setting 5 lets user only buy with fractal bottom after a buy signal has been found.
Setting 6 lets user only sell with fractal top after a sell signal has been found.
Setting 7 lets user only buy if the pre defined time period has elapsed on the chart.
Setting 8 lets user only sell if the pre defined time period has elapsed on the chart.
Setting 9 lets user only buy with a strong buy signal (orange color).
Setting 10 lets user only sell with a strong sell signal (purple color).
Setting 11 defines the time period to be elapsed to trigger a buy.
Setting 12 defines the time period to be elapsed to trigger a sell.
Upcoming features:
Advanced pre-defined strategies for user to select from. This will also auto adjust the setups and time frames being combined.
Stop Loss and Stop to Trailing options for the strategy.
Stop Loss and Stop to Trailing alerts.
Defining risk/reward ratio before entering the trade.
~Bo
Founder of Megalodon Indicators
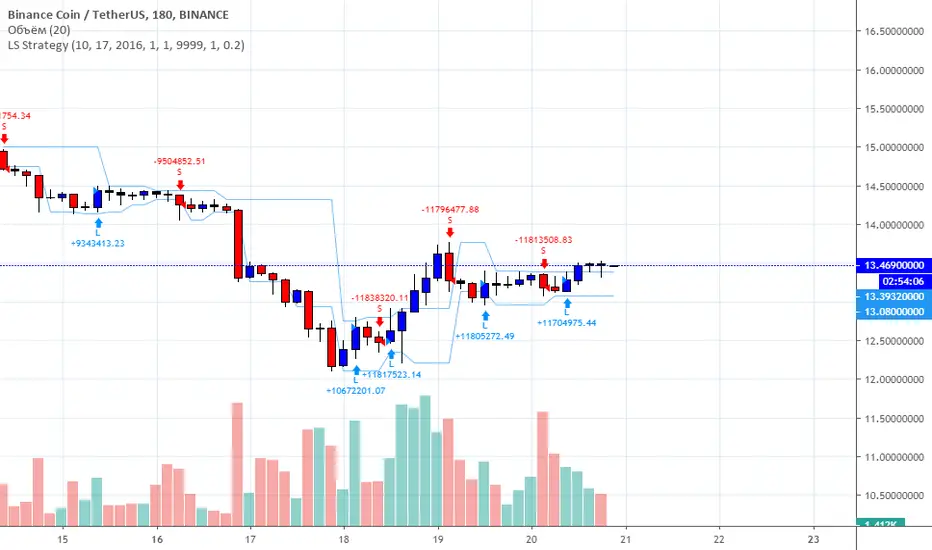
LS Strategy final version 1Hello. Strategy for timeframe 4 hours and up to 24 hours. for couples with a dollar. Good results for bnbusdt , btcusdt , ethusdt , eosusdt, ltcusdt , neousdt pairs. Suitable for exchange Binance, Bitmex.
Closing trades on the reverse signal.
first position 2019-01-17 19:00
Do not have code security