PatternTransitionTablesPatternTransitionTables Library
🌸 Part of GoemonYae Trading System (GYTS) 🌸
🌸 --------- 1. INTRODUCTION --------- 🌸
💮 Overview
This library provides precomputed state transition tables to enable ultra-efficient, O(1) computation of Ordinal Patterns. It is designed specifically to support high-performance indicators calculating Permutation Entropy and related complexity measures.
💮 The Problem & Solution
Calculating Permutation Entropy, as introduced by Bandt and Pompe (2002), typically requires computing ordinal patterns within a sliding window at every time step. The standard successive-pattern method (Equations 2+3 in the paper) requires ≤ 4d-1 operations per update.
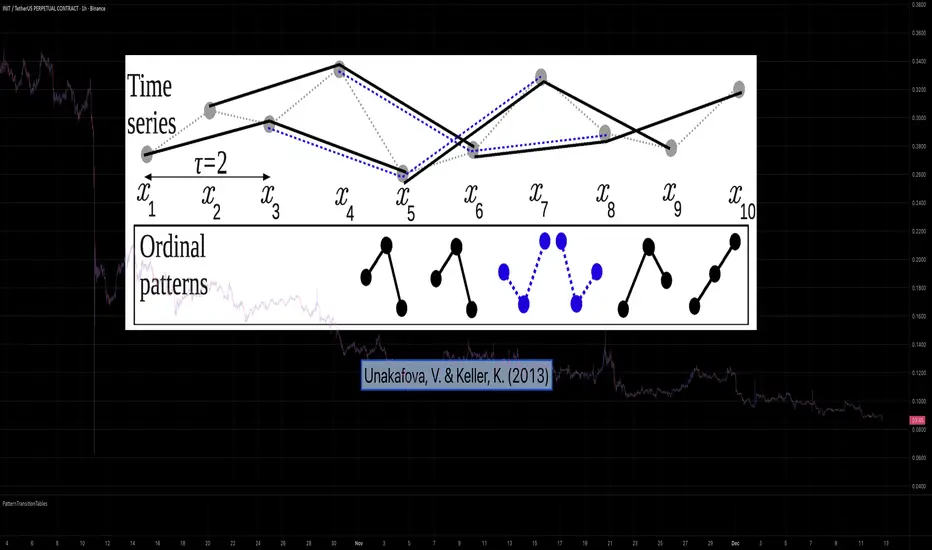
Unakafova and Keller (2013) demonstrated that successive ordinal patterns "overlap" significantly. By knowing the current pattern index and the relative rank (position l) of just the single new data point, the next pattern index can be determined via a precomputed look-up table. Computing l still requires d comparisons, but the table lookup itself is O(1), eliminating the need for d multiplications and d additions. This reduces total operations from ≤ 4d-1 to ≤ 2d per update (Table 4). This library contains these precomputed tables for orders d = 2 through d = 5.
🌸 --------- 2. THEORETICAL BACKGROUND --------- 🌸
💮 Permutation Entropy
Bandt, C., & Pompe, B. (2002). Permutation entropy: A natural complexity measure for time series.
doi.org
This concept quantifies the complexity of a system by comparing the order of neighbouring values rather than their magnitudes. It is robust against noise and non-linear distortions, making it ideal for financial time series analysis.
💮 Efficient Computation
Unakafova, V. A., & Keller, K. (2013). Efficiently Measuring Complexity on the Basis of Real-World Data.
doi.org
This library implements the transition function φ_d(n, l) described in Equation 5 of the paper. It maps a current pattern index (n) and the position of the new value (l) to the successor pattern, reducing the complexity of updates to constant time O(1).
🌸 --------- 3. LIBRARY FUNCTIONALITY --------- 🌸
💮 Data Structure
The library stores transition matrices as flattened 1D integer arrays. These tables are mathematically rigorous representations of the factorial number system used to enumerate permutations.
💮 Core Function: get_successor()
This is the primary interface for the library for direct pattern updates.
• Input: The current pattern index and the rank position of the incoming price data.
• Process: Routes the request to the specific transition table for the chosen order (d=2 to d=5).
• Output: The integer index of the next ordinal pattern.
💮 Table Access: get_table()
This function returns the entire flattened transition table for a specified dimension. This enables local caching of the table (e.g. in an indicator's init() method), avoiding the overhead of repeated library calls during the calculation loop.
💮 Supported Orders & Terminology
The parameter d is the order of ordinal patterns (following Bandt & Pompe 2002). Each pattern of order d contains (d+1) data points, yielding (d+1)! unique patterns:
• d=2: 3 points → 6 unique patterns, 3 successor positions
• d=3: 4 points → 24 unique patterns, 4 successor positions
• d=4: 5 points → 120 unique patterns, 5 successor positions
• d=5: 6 points → 720 unique patterns, 6 successor positions
Note: d=6 is not implemented. The resulting code size (approx. 191k tokens) exceeds the Pine Script limit of 100k tokens (as of 2025-12).
Market Geometry
Symmetrical Geometric MandalaSymmetrical Geometric Mandala
Overview
The Symmetrical Geometric Mandala is an advanced geometric trading tool that applies phi (φ) harmonic relationships to price-time analysis. This indicator automatically detects swing ranges and constructs a scale-invariant geometric framework based on the square root of phi (√φ), revealing natural support/resistance zones and harmonic price-time balance points.
Core Concept
Traditional technical analysis often treats price and time as separate dimensions. This indicator harmonizes them using the mathematical constant √φ (approximately 1.272), creating a geometric "squaring" of price and time that remains proportionally consistent across different chart scales.
The Mathematics
When you select a price range (from swing low to swing high or vice versa), the indicator calculates:
PBR (Price-to-Bar Ratio) = Range / Number of Bars
Harmonic PBR = PBR × √φ (1.272019649514069)
Phi Extension = Range × φ (1.618033988749895)
The Harmonic PBR is the critical value - this is the chart scaling factor that creates perfect geometric harmony between price and time for your selected range.
Visual Components
1. Horizontal Boundary Lines
Two horizontal lines extend from the selected range at a distance of Range × φ (golden ratio extension):
Upper line: Extended above the swing high (for uplegs) or swing low (for downlegs)
Lower line: Extended below the swing low (for uplegs) or swing high (for downlegs)
These lines mark the natural harmonic boundaries of the price movement.
2. Rectangle Diagonal Lines
Two diagonal lines that create a "rectangle" effect, connecting:
Overlap points on horizontal boundaries to swing extremes
These lines go in the opposite direction of the price leg (creating the symmetrical mandala pattern)
When extended, they reveal future geometric support/resistance zones
3. Phi Harmonic Circles (Optional)
Two precisely calculated circles (drawn as smooth polylines):
Circle A: Centered at the first swing extreme (Nodal A)
Circle B: Centered at the second swing extreme (Nodal B)
Radius = Range × φ, causing them to perfectly touch the horizontal boundary lines
These circles visualize the geometric harmony and create a mandala-like pattern that reveals natural price zones.
How to Use
Step 1: Select Your Range
Set the Start Date at your swing low or swing high
Set the End Date at the opposite extreme
The indicator automatically detects whether it's an upleg or downleg
Step 2: Read the Harmonic PBR
Check the highlighted yellow row in the table: "PBR × √φ"
This is your chart scaling value
Step 3: Apply Chart Scaling (Optional)
For perfect geometric visualization:
Right-click on your chart's price axis
Select "Scale price chart only"
Enter the PBR × √φ value
The geometry will now display in perfect harmonic proportion
Step 4: Interpret the Geometry
Horizontal lines: Key support/resistance zones at phi extensions
Diagonal lines: Dynamic trend channels and future price-time balance points
Circle intersections: Natural harmonic turning points
Central diamond area: Core price-time equilibrium zone
Key Features
✅ Automatic swing detection - identifies upleg/downleg automatically
✅ Scale-invariant geometry - maintains proportions across timeframes
✅ Phi harmonic calculations - based on golden ratio mathematics
✅ Professional color scheme - clean, non-intrusive visuals
✅ Customizable display - toggle circles, lines, and table independently
✅ Smooth circle rendering - adjustable segments (16-360) for optimal smoothness
Settings
Show Horizontal Boundary Lines: Display phi extension levels
Show Rectangle Diagonal Lines: Display the geometric framework
Show Phi Harmonic Circles: Display circular geometry (optional)
Circle Smoothness: Adjust polyline segments (default: 96)
Colors: Fully customizable color scheme for all elements
Theory Background
This indicator draws inspiration from:
W.D. Gann's price-time squaring techniques
Bradley Cowan's geometric market analysis
Phi/golden ratio harmonic theory
Mathematical constants in market structure
Unlike traditional Fibonacci retracements, this tool uses √φ instead of φ as the primary scaling constant, creating a unique geometric relationship that "squares" price movement with time passage.
Best Practices
Use on significant swings - Works best on major swing highs/lows
Multiple timeframe analysis - Apply to different timeframes for confluence
Combine with other tools - Use alongside support/resistance and trend analysis
Respect the geometry - Pay attention when price interacts with geometric elements
Chart scaling optional - The geometry works at any scale, but scaling enhances visualization
Notes
The indicator draws geometry from left to right (from Nodal A to Nodal B)
All lines extend infinitely for future projections
The table shows real-time calculations for the selected range
Date range selection uses confirm dialogs to prevent accidental changes

ma_PLibrary "ma_P"
This library is made to expand traders moving average arsenal.
sma(src, length)
Parameters:
src (float)
length (simple int)
sma(src, length)
Parameters:
src (float)
length (int)
eit(src)
Parameters:
src (float)
ema(src, length)
Parameters:
src (float)
length (simple int)
ema(src, length)
Parameters:
src (float)
length (int)
ahma(src, length)
Parameters:
src (float)
length (simple int)
ahma(src, length)
Parameters:
src (float)
length (int)
bmf(src, length)
Parameters:
src (float)
length (simple int)
bmf(src, length)
Parameters:
src (float)
length (int)
cma(src, length)
Parameters:
src (float)
length (simple int)
cma(src, length)
Parameters:
src (float)
length (int)
dema(src, length)
Parameters:
src (float)
length (simple int)
dema(src, length)
Parameters:
src (float)
length (int)
dswf(src, length)
Parameters:
src (float)
length (simple int)
dswf(src, length)
Parameters:
src (float)
length (int)
evwma(src, length, volume)
Parameters:
src (float)
length (simple int)
volume (float)
evwma(src, length, volume)
Parameters:
src (float)
length (int)
volume (float)
esd(src, length)
Parameters:
src (float)
length (simple int)
esd(src, length)
Parameters:
src (float)
length (int)
frama(src, length)
Parameters:
src (float)
length (simple int)
frama(src, length)
Parameters:
src (float)
length (int)
flsma(src, len)
Parameters:
src (float)
len (simple int)
flsma(src, len)
Parameters:
src (float)
len (int)
gmma(src, length)
Parameters:
src (float)
length (simple int)
gmma(src, length)
Parameters:
src (float)
length (int)
hcf(src, length)
Parameters:
src (float)
length (simple int)
hcf(src, length)
Parameters:
src (float)
length (int)
hma(src, length)
Parameters:
src (float)
length (simple int)
hma(src, length)
Parameters:
src (float)
length (int)
jma(src, length)
Parameters:
src (float)
length (simple int)
jma(src, length)
Parameters:
src (float)
length (int)
kama(source, length, min_length, max_length)
Parameters:
source (float)
length (int)
min_length (int)
max_length (int)
kijun(src, length)
Parameters:
src (float)
length (simple int)
kijun(src, length)
Parameters:
src (float)
length (int)
lsma(src, length)
Parameters:
src (float)
length (simple int)
lsma(src, length)
Parameters:
src (float)
length (int)
lma(src, length)
Parameters:
src (float)
length (simple int)
lma(src, length)
Parameters:
src (float)
length (int)
mf(src, length)
Parameters:
src (float)
length (simple int)
mf(src, length)
Parameters:
src (float)
length (int)
mm(src, length)
Parameters:
src (float)
length (simple int)
mm(src, length)
Parameters:
src (float)
length (int)
smma(src, length)
Parameters:
src (float)
length (simple int)
smma(src, length)
Parameters:
src (float)
length (int)
ssma(src, length)
Parameters:
src (float)
length (simple int)
ssma(src, length)
Parameters:
src (float)
length (int)
swma(src, length)
Parameters:
src (float)
length (simple int)
swma(src, length)
Parameters:
src (float)
length (int)
tma(src, length)
Parameters:
src (float)
length (simple int)
tma(src, length)
Parameters:
src (float)
length (int)
tema(src, length)
Parameters:
src (float)
length (simple int)
tema(src, length)
Parameters:
src (float)
length (int)
tsf(src, length)
Parameters:
src (float)
length (simple int)
tsf(src, length)
Parameters:
src (float)
length (int)
varma(src, length)
Parameters:
src (float)
length (simple int)
varma(src, length)
Parameters:
src (float)
length (int)
vama(src, length)
Parameters:
src (float)
length (simple int)
vama(src, length)
Parameters:
src (float)
length (int)
vma(src, length)
Parameters:
src (float)
length (simple int)
vma(src, length)
Parameters:
src (float)
length (int)
vbma(src, length)
Parameters:
src (float)
length (simple int)
vbma(src, length)
Parameters:
src (float)
length (int)
vida(src, length)
Parameters:
src (float)
length (simple int)
vida(src, length)
Parameters:
src (float)
length (int)
qma(src, length)
Parameters:
src (float)
length (simple int)
qma(src, length)
Parameters:
src (float)
length (int)
rpma(src, len)
Parameters:
src (float)
len (simple int)
rpma(src, len)
Parameters:
src (float)
len (int)
rma(src, length)
Parameters:
src (float)
length (simple int)
rma(src, length)
Parameters:
src (float)
length (int)
rsrma(src, length)
Parameters:
src (float)
length (simple int)
rsrma(src, length)
Parameters:
src (float)
length (int)
zlema(src, length)
Parameters:
src (float)
length (simple int)
zlema(src, length)
Parameters:
src (float)
length (int)
selector(src, length, selectMA, min_length, max_length)
This function gives trader an instrument to test different kinds of moving averages on their strategy.
Parameters:
src (float)
length (simple int)
selectMA (string)
min_length (int)
max_length (int)
Returns: user selected moving average
selector(src, length, selectMA, min_length, max_length)
Parameters:
src (float)
length (int)
selectMA (string)
min_length (int)
max_length (int)

3D Cube Projection - √3 Diagonal3D Cube Projection - √3 Diagonal
OVERVIEW
This indicator implements Bradley F. Cowan's cube projection methodology from his "Four Dimensional Stock Market Structures & Cycles" work. It visualizes a 3D cube projected onto the 2D price-time chart, using the √3 (square root of 3) body diagonal as the primary analytical tool for identifying market structure and potential cycle termination points.
METHODOLOGY
The cube is constructed by selecting two pivot points (A and E) which form the body diagonal - the longest diagonal running through the cube's interior from one corner to the diagonally opposite corner. According to Cowan's geometric approach:
- Point A = Starting pivot (low or high)
- Point E = Ending pivot (opposite extreme)
- Body Diagonal (A→E) = √3 × cube side length
- Face Diagonal (A→C) = √2 × cube side length
The script calculates the cube dimensions by:
1. Measuring the total price range from A to E
2. Dividing by √3 to determine the cube side length in price
3. Distributing the time component across three equal segments
4. Projecting the 3D structure onto the 2D chart plane
FEATURES
✓ Interactive date selection for points A and E
✓ Automatic UPLEG/DOWNLEG detection
✓ All 8 cube vertices labeled (A-H)
✓ All 6 cube faces with independent color/opacity controls
✓ √3 body diagonal (red line by default)
✓ √2 face diagonal (orange line by default)
✓ Customizable cube lines, fills, and labels
✓ Information table showing key measurements
VISUAL CUSTOMIZATION
- Front & Back faces: Box fills for the two square faces
- Side faces: Left and right vertical faces
- Top & Bottom faces: Horizontal connecting faces
- Each group has independent color and opacity settings
- Label size and transparency fully adjustable
- Cube line styles (solid, dashed, dotted) for depth perception
IMPORTANT LIMITATIONS & DISCLOSURES
This indicator works within the inherent constraints of projecting 3D geometry onto a 2D price-time chart:
⚠️ VISUAL APPROXIMATION: This is a visual projection tool, not a mathematically perfect 3D cube. True 3D geometry cannot be accurately represented on a 2D plane without distortion.
⚠️ TIME DISTRIBUTION: The script divides the time axis into three equal segments (total bars ÷ 3) for practical visualization. This is an approximation that prioritizes visual coherence over strict geometric accuracy.
⚠️ UNIT SCALING: Price and time use different units (dollars vs. bars), making true isometric projection impossible. The cube appears proportional on screen but the dimensions are not directly comparable.
⚠️ 2D CONSTRAINT: We only have X (time) and Y (price) axes available. The Z-axis (depth) is simulated through visual projection techniques (line styles, shading).
INTENDED USE
This tool is designed for traders and analysts who study Bradley Cowan's geometric market analysis methods. It helps visualize:
- Market structure in geometric terms
- Potential support/resistance zones at cube edges
- Cycle timing relationships using √2 and √3 ratios
- Harmonic price-time relationships
The cube projection should be used as one component of a comprehensive analysis approach, combined with other technical tools and fundamental analysis.
MATHEMATICAL FOUNDATION
While the visual representation involves approximations, the core √3 relationship is mathematically sound:
- For any cube, the body diagonal = √3 × side length
- The face diagonal = √2 × side length
- These ratios are preserved in the price dimension calculations
HOW TO USE
1. Select your starting date (Point A) - typically a significant low or high
2. Select your ending date (Point E) - the opposite extreme pivot
3. The indicator automatically constructs the cube geometry
4. Analyze the cube edges, diagonals, and faces for market structure insights
5. Adjust colors and opacity to suit your chart aesthetic
TECHNICAL NOTES
- Works on all timeframes and instruments
- Best viewed on charts with sufficient historical data
- Cube updates in real-time as new bars form
- Range selection is marked with vertical lines and shading
- Calculator table shows Point A, Point E, side length, and bar measurements
ACKNOWLEDGMENT
This indicator is based on the geometric market analysis principles developed by Bradley F. Cowan. Users are encouraged to study Cowan's original works for deeper understanding of the theoretical framework.
DISCLAIMER
This indicator is for educational and analytical purposes only. It does not constitute financial advice. Past performance does not guarantee future results. Always conduct your own research and risk management before making trading decisions.

DynLenLibLibrary "DynLenLib"
sum_dyn(src, len)
Parameters:
src (float)
len (int)
lag_dyn(src, len)
Parameters:
src (float)
len (int)
highest_dyn(src, len)
Parameters:
src (float)
len (int)
lowest_dyn(src, len)
Parameters:
src (float)
len (int)
var_dyn(src, len)
Parameters:
src (float)
len (int)
stdev_dyn(src, len)
Parameters:
src (float)
len (int)
hl2()
hlc3()
ohlc4()
sma_dyn(src, len)
Parameters:
src (float)
len (int)
ema_dyn(src, len)
Parameters:
src (float)
len (int)
rma_dyn(src, len)
Parameters:
src (float)
len (int)
smma_dyn(src, len)
Parameters:
src (float)
len (int)
wma_dyn(src, len)
Parameters:
src (float)
len (int)
vwma_dyn(price, vol, len)
Parameters:
price (float)
vol (float)
len (int)
hma_dyn(src, len)
Parameters:
src (float)
len (int)
dema_dyn(src, len)
Parameters:
src (float)
len (int)
tema_dyn(src, len)
Parameters:
src (float)
len (int)
kama_dyn(src, erLen, fastLen, slowLen)
Parameters:
src (float)
erLen (int)
fastLen (int)
slowLen (int)
mcginley_dyn(src, len)
Parameters:
src (float)
len (int)
median_price()
true_range()
atr_dyn(len)
Parameters:
len (int)
bbands_dyn(src, len, mult)
Parameters:
src (float)
len (int)
mult (float)
bb_percent_b(src, len, mult)
Parameters:
src (float)
len (int)
mult (float)
bb_bandwidth(src, len, mult)
Parameters:
src (float)
len (int)
mult (float)
keltner_dyn(src, lenEMA, lenATR, multATR)
Parameters:
src (float)
lenEMA (int)
lenATR (int)
multATR (float)
donchian_dyn(len)
Parameters:
len (int)
choppiness_index(len)
Parameters:
len (int)
vol_stop(lenATR, mult)
Parameters:
lenATR (int)
mult (float)
roc_dyn(src, len)
Parameters:
src (float)
len (int)
rsi_dyn(src, len)
Parameters:
src (float)
len (int)
stoch_dyn(kLen, dLen, smoothK)
Parameters:
kLen (int)
dLen (int)
smoothK (int)
stoch_rsi_dyn(rsiLen, stochLen, kSmooth, dLen)
Parameters:
rsiLen (int)
stochLen (int)
kSmooth (int)
dLen (int)
cci_dyn(src, len)
Parameters:
src (float)
len (int)
cmo_dyn(src, len)
Parameters:
src (float)
len (int)
trix_dyn(len)
Parameters:
len (int)
tsi_dyn(shortLen, longLen)
Parameters:
shortLen (int)
longLen (int)
ultimate_osc(len1, len2, len3)
Parameters:
len1 (int)
len2 (int)
len3 (int)
dpo_dyn(src, len)
Parameters:
src (float)
len (int)
willr_dyn(len)
Parameters:
len (int)
macd_dyn(src, fastLen, slowLen, sigLen)
Parameters:
src (float)
fastLen (int)
slowLen (int)
sigLen (int)
ppo_dyn(src, fastLen, slowLen, sigLen)
Parameters:
src (float)
fastLen (int)
slowLen (int)
sigLen (int)
aroon_dyn(len)
Parameters:
len (int)
dmi_adx_dyn(diLen, adxLen)
Parameters:
diLen (int)
adxLen (int)
vortex_dyn(len)
Parameters:
len (int)
coppock_dyn(rocLen1, rocLen2, wmaLen)
Parameters:
rocLen1 (int)
rocLen2 (int)
wmaLen (int)
rvi_dyn(len)
Parameters:
len (int)
price_osc_dyn(src, fastLen, slowLen)
Parameters:
src (float)
fastLen (int)
slowLen (int)
rci_dyn(src, len)
Parameters:
src (float)
len (int)
obv()
pvt()
cmf_dyn(len)
Parameters:
len (int)
adl()
chaikin_osc_dyn(fastLen, slowLen)
Parameters:
fastLen (int)
slowLen (int)
mfi_dyn(len)
Parameters:
len (int)
volume_osc_dyn(fastLen, slowLen)
Parameters:
fastLen (int)
slowLen (int)
up_down_volume()
cvd()
supertrend_dyn(atrLen, mult)
Parameters:
atrLen (int)
mult (float)
envelopes_dyn(src, len, pct)
Parameters:
src (float)
len (int)
pct (float)
linreg_line_slope(src, len)
Parameters:
src (float)
len (int)
lsma_dyn(src, len)
Parameters:
src (float)
len (int)
corrcoef_dyn(a, b, len)
Parameters:
a (float)
b (float)
len (int)
psar(step, maxStep)
Parameters:
step (float)
maxStep (float)
pivots_standard()
williams_alligator(src, jawLen, teethLen, lipsLen)
Parameters:
src (float)
jawLen (int)
teethLen (int)
lipsLen (int)
twap_dyn(src, len)
Parameters:
src (float)
len (int)
vwap_anchored(price, volume, reset)
Parameters:
price (float)
volume (float)
reset (bool)
performance_pct(len)
Parameters:
len (int)

PubLibPivotLibrary "PubLibPivot"
Pivot detection library for harmonic pattern analysis - Fractal and ZigZag methods with validation and utility functions
fractalPivotHigh(depth)
Fractal pivot high condition
Parameters:
depth (int)
Returns: bool
fractalPivotLow(depth)
Fractal pivot low condition
Parameters:
depth (int)
Returns: bool
fractalPivotHighPrice(depth, occurrence)
Get fractal pivot high price
Parameters:
depth (int)
occurrence (simple int)
Returns: float
fractalPivotLowPrice(depth, occurrence)
Get fractal pivot low price
Parameters:
depth (int)
occurrence (simple int)
Returns: float
fractalPivotHighBarIndex(depth, occurrence)
Get fractal pivot high bar index
Parameters:
depth (int)
occurrence (simple int)
Returns: int
fractalPivotLowBarIndex(depth, occurrence)
Get fractal pivot low bar index
Parameters:
depth (int)
occurrence (simple int)
Returns: int
zigzagPivotHigh(deviation, backstep, useATR, atrLength)
ZigZag pivot high condition
Parameters:
deviation (float)
backstep (int)
useATR (bool)
atrLength (simple int)
Returns: bool
zigzagPivotLow(deviation, backstep, useATR, atrLength)
ZigZag pivot low condition
Parameters:
deviation (float)
backstep (int)
useATR (bool)
atrLength (simple int)
Returns: bool
zigzagPivotHighPrice(deviation, backstep, useATR, atrLength, occurrence)
Get ZigZag pivot high price
Parameters:
deviation (float)
backstep (int)
useATR (bool)
atrLength (simple int)
occurrence (simple int)
Returns: float
zigzagPivotLowPrice(deviation, backstep, useATR, atrLength, occurrence)
Get ZigZag pivot low price
Parameters:
deviation (float)
backstep (int)
useATR (bool)
atrLength (simple int)
occurrence (simple int)
Returns: float
zigzagPivotHighBarIndex(deviation, backstep, useATR, atrLength, occurrence)
Get ZigZag pivot high bar index
Parameters:
deviation (float)
backstep (int)
useATR (bool)
atrLength (simple int)
occurrence (simple int)
Returns: int
zigzagPivotLowBarIndex(deviation, backstep, useATR, atrLength, occurrence)
Get ZigZag pivot low bar index
Parameters:
deviation (float)
backstep (int)
useATR (bool)
atrLength (simple int)
occurrence (simple int)
Returns: int
isValidPivotVolume(pivotPrice, pivotBarIndex, minVolumeRatio, volumeLength)
Validate pivot quality based on volume
Parameters:
pivotPrice (float)
pivotBarIndex (int)
minVolumeRatio (float)
volumeLength (int)
Returns: bool
isValidPivotATR(pivotPrice, lastPivotPrice, minATRMultiplier, atrLength)
Validate pivot based on minimum ATR movement
Parameters:
pivotPrice (float)
lastPivotPrice (float)
minATRMultiplier (float)
atrLength (simple int)
Returns: bool
isValidPivotTime(pivotBarIndex, lastPivotBarIndex, minBars)
Validate pivot based on minimum time between pivots
Parameters:
pivotBarIndex (int)
lastPivotBarIndex (int)
minBars (int)
Returns: bool
isPivotConfirmed(pivotBarIndex, depth)
Check if pivot is not repainting (confirmed)
Parameters:
pivotBarIndex (int)
depth (int)
Returns: bool
addPivotToArray(pivotArray, barArray, pivotPrice, pivotBarIndex, maxSize)
Add pivot to array with validation
Parameters:
pivotArray (array)
barArray (array)
pivotPrice (float)
pivotBarIndex (int)
maxSize (int)
Returns: array - updated pivot array
getPivotFromArray(pivotArray, barArray, index)
Get pivot from array by index
Parameters:
pivotArray (array)
barArray (array)
index (int)
Returns: tuple - (price, bar_index)
getPivotsInRange(pivotArray, barArray, startIndex, count)
Get all pivots in range
Parameters:
pivotArray (array)
barArray (array)
startIndex (int)
count (int)
Returns: tuple, array> - (prices, bar_indices)
pivotDistance(barIndex1, barIndex2)
Calculate distance between two pivots in bars
Parameters:
barIndex1 (int)
barIndex2 (int)
Returns: int - distance in bars
pivotPriceRatio(price1, price2)
Calculate price ratio between two pivots
Parameters:
price1 (float)
price2 (float)
Returns: float - price ratio
pivotRetracementRatio(startPrice, endPrice, currentPrice)
Calculate retracement ratio
Parameters:
startPrice (float)
endPrice (float)
currentPrice (float)
Returns: float - retracement ratio (0-1)
pivotExtensionRatio(startPrice, endPrice, currentPrice)
Calculate extension ratio
Parameters:
startPrice (float)
endPrice (float)
currentPrice (float)
Returns: float - extension ratio (>1 for extension)
isInFibZone(startPrice, endPrice, currentPrice, fibLevel, tolerance)
Check if price is in Fibonacci retracement zone
Parameters:
startPrice (float)
endPrice (float)
currentPrice (float)
fibLevel (float)
tolerance (float)
Returns: bool - true if in zone
getPivotType(pivotPrice, pivotBarIndex, lookback)
Get pivot type (high/low) based on surrounding prices
Parameters:
pivotPrice (float)
pivotBarIndex (int)
lookback (int)
Returns: string - "high", "low", or "unknown"
calculatePivotStrength(pivotPrice, pivotBarIndex, lookback)
Calculate pivot strength based on volume and price action
Parameters:
pivotPrice (float)
pivotBarIndex (int)
lookback (int)
Returns: float - strength score (0-100)
XABCD_HarmonicsLibrary for detecting harmonic patterns using ZigZag pivots or custom swing points. Supports Butterfly, Gartley, Bat, and Crab patterns with automatic Fibonacci ratio validation and optional D-point projection using extremes. Returns detailed PatternResult including structure points and target projection. Ideal for technical analysis, algorithmic detection, or overlay visualizations.

juan_dibujosLibrary "juan_dibujos"
extend_line(lineId, labelId)
: Extend specific line with its label
Parameters:
lineId (line)
labelId (label)
update_line_coordinates(lineId, labelId, x1, y1, x2, y2)
: Update specific line coordinates with its label
Parameters:
lineId (line)
labelId (label)
x1 (int)
y1 (float)
x2 (int)
y2 (float)
update_label_coordinates(labelId, value)
: Update coordinates of a label
Parameters:
labelId (label)
value (float)
delete_line(lineId, labelId)
: Delete specific line with its label
Parameters:
lineId (line)
labelId (label)
update_box_coordinates(boxId, labelId, left, top, right, bottom)
: Update specific box coordinates with its label
Parameters:
boxId (box)
labelId (label)
left (int)
top (float)
right (int)
bottom (float)
delete_box(boxId, labelId)
: Delete specific box with its label
Parameters:
boxId (box)
labelId (label)
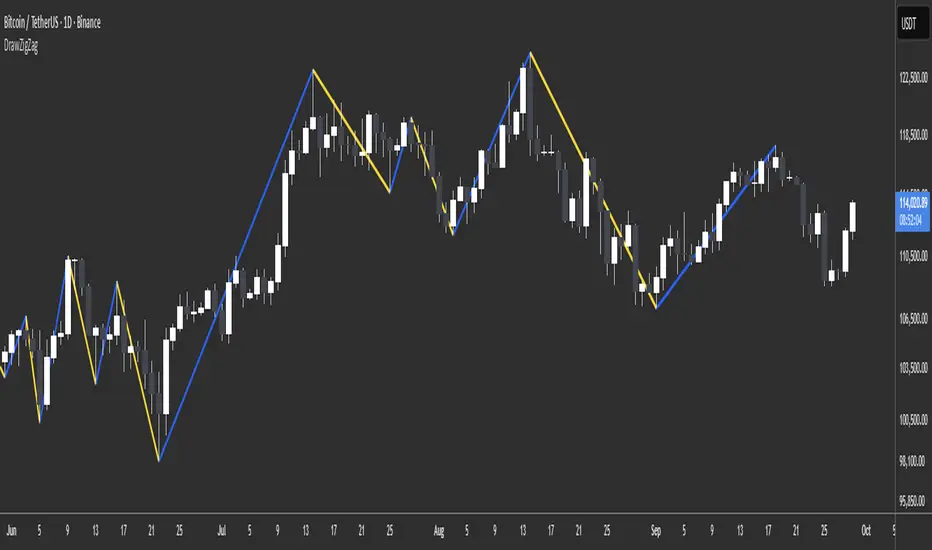
DrawZigZag🟩 OVERVIEW
This library draws zigzag lines for existing pivots. It is designed to be simple to use. If your script creates pivots and you want to join them up while handling edge cases, this library does that quickly and efficiently. If you want your pivots created for you, choose one of the many other zigzag libraries that do that.
🟩 HOW TO USE
Pine Script libraries contain reusable code for importing into indicators. You do not need to copy any code out of here. Just import the library and call the function you want.
For example, for version 1 of this library, import it like this:
import SimpleCryptoLife/DrawZigZag/1
See the EXAMPLE USAGE sections within the library for examples of calling the functions.
For more information on libraries and incorporating them into your scripts, see the Libraries section of the Pine Script User Manual.
🟩 WHAT IT DOES
I looked at every zigzag library on TradingView, after finishing this one. They all seemed to fall into two groups in terms of functionality:
• Create the pivots themselves, using a combination of Williams-style pivots and sometimes price distance.
• Require an array of pivot information, often in a format that uses user-defined types.
My library takes a completely different approach.
Firstly, it only does the drawing. It doesn't calculate the pivots for you. This isn't laziness. There are so many ways to define pivots and that should be up to you. If you've followed my work on market structure you know what I think of Williams pivots.
Secondly, when you pass information about your pivots to the library function, you only need the minimum of pivot information -- whether it's a High or Low pivot, the price, and the bar index. Pass these as normal variables -- bools, ints, and floats -- on the fly as your pivots confirm. It is completely agnostic as to how you derive your pivots. If they are confirmed an arbitrary number of bars after they happen, that's fine.
So why even bother using it if all it does it draw some lines?
Turns out there is quite some logic needed in order to connect highs and lows in the right way, and to handle edge cases. This is the kind of thing one can happily outsource.
🟩 THE RULES
• Zigs and zags must alternate between Highs and Lows. We never connect a High to a High or a Low to a Low.
• If a candle has both a High and Low pivot confirmed on it, the first line is drawn to the end of the candle that is the opposite to the previous pivot. Then the next line goes vertically through the candle to the other end, and then after that continues normally.
• If we draw a line up from a Low to a High pivot, and another High pivot comes in higher, we *extend* the line up, and the same for lines down. Yes this is a form of repainting. It is in my opinion the only way to end up with a correct structure.
• We ignore lower highs on the way up and higher lows on the way down.
🟩 WHAT'S COOL ABOUT THIS LIBRARY
• It's simple and lightweight: no exported user-defined types, no helper methods, no matrices.
• It's really fast. In my profiling it runs at about ~50ms, and changing the options (e.g., trimming the array) doesn't make very much difference.
• You only need to call one function, which does all the calculations and draws all lines.
• There are two variations of this function though -- one simple function that just draws lines, and one slightly more advanced method that modifies an array containing the lines. If you don't know which one you want, use the simpler one.
🟩 GEEK STUFF
• There are no dependencies on other libraries.
• I tried to make the logic as clear as I could and comment it appropriately.
• In the `f_drawZigZags` function, the line variable is declared using the `var` keyword *inside* the function, for simplicity. For this reason, it persists between function calls *only* if the function is called from the global scope or a local if block. In general, if a function is called from inside a loop , or multiple times from different contexts, persistent variables inside that function are re-initialised on each call. In this case, this re-initialisation would mean that the function loses track of the previous line, resulting in incorrect drawings. This is why you cannot call the `f_drawZigZags` function from a loop (not that there's any reason to). The `m_drawZigZagsArray` does not use any internal `var` variables.
• The function itself takes a Boolean parameter `_showZigZag`, which turns the drawings on and off, so there is no need to call the function conditionally. In the examples, we do call the functions from an if block, purely as an illustration of how to increase performance by restricting the amount of code that needs to be run.
🟩 BRING ON THE FUNCTIONS
f_drawZigZags(_showZigZag, _isHighPivot, _isLowPivot, _highPivotPrice, _lowPivotPrice, _pivotIndex, _zigzagWidth, _lineStyle, _upZigColour, _downZagColour)
This function creates or extends the latest zigzag line. Takes real-time information about pivots and draws lines. It does not calculate the pivots. It must be called once per script and cannot be called from a loop.
Parameters:
_showZigZag (bool) : Whether to show the zigzag lines.
_isHighPivot (bool) : Whether the current bar confirms a high pivot. Note that pivots are confirmed after the bar in which they occur.
_isLowPivot (bool) : Whether the current bar confirms a low pivot.
_highPivotPrice (float) : The price of the high pivot that was confirmed this bar. It is NOT the high price of the current bar.
_lowPivotPrice (float) : The price of the low pivot that was confirmed this bar. It is NOT the low price of the current bar.
_pivotIndex (int) : The bar index of the pivot that was confirmed this bar. This is not an offset. It's the `bar_index` value of the pivot.
_zigzagWidth (int) : The width of the zigzag lines.
_lineStyle (string) : The style of the zigzag lines.
_upZigColour (color) : The colour of the up zigzag lines.
_downZagColour (color) : The colour of the down zigzag lines.
Returns: The function has no explicit returns. As a side effect, it draws or updates zigzag lines.
method m_drawZigZagsArray(_a_zigZagLines, _showZigZag, _isHighPivot, _isLowPivot, _highPivotPrice, _lowPivotPrice, _pivotIndex, _zigzagWidth, _lineStyle, _upZigColour, _downZagColour, _trimArray)
Namespace types: array
Parameters:
_a_zigZagLines (array)
_showZigZag (bool) : Whether to show the zigzag lines.
_isHighPivot (bool) : Whether the current bar confirms a high pivot. Note that pivots are usually confirmed after the bar in which they occur.
_isLowPivot (bool) : Whether the current bar confirms a low pivot.
_highPivotPrice (float) : The price of the high pivot that was confirmed this bar. It is NOT the high price of the current bar.
_lowPivotPrice (float) : The price of the low pivot that was confirmed this bar. It is NOT the low price of the current bar.
_pivotIndex (int) : The bar index of the pivot that was confirmed this bar. This is not an offset. It's the `bar_index` value of the pivot.
_zigzagWidth (int) : The width of the zigzag lines.
_lineStyle (string) : The style of the zigzag lines.
_upZigColour (color) : The colour of the up zigzag lines.
_downZagColour (color) : The colour of the down zigzag lines.
_trimArray (bool) : If true, the array of lines is kept to a maximum size of two lines (the line elements are not deleted). If false (the default), the array is kept to a maximum of 500 lines (the maximum number of line objects a single Pine script can display).
Returns: This function has no explicit returns but it modifies a global array of zigzag lines.
FvgObject█ OVERVIEW
This library provides a suite of methods designed to manage the visual representation and lifecycle of Fair Value Gap (FVG) objects on a Pine Script™ chart. It extends the `fvgObject` User-Defined Type (UDT) by attaching object-oriented functionalities for drawing, updating, and deleting FVG-related graphical elements. The primary goal is to encapsulate complex drawing logic, making the main indicator script cleaner and more focused on FVG detection and state management.
█ CONCEPTS
This library is built around the idea of treating each Fair Value Gap as an "object" with its own visual lifecycle on the chart. This is achieved by defining methods that operate directly on instances of the `fvgObject` UDT.
Object-Oriented Approach for FVGs
Pine Script™ v6 introduced the ability to define methods for User-Defined Types (UDTs). This library leverages this feature by attaching specific drawing and state management functions (methods) directly to the `fvgObject` type. This means that instead of calling global functions with an FVG object as a parameter, you call methods *on* the FVG object itself (e.g., `myFvg.updateDrawings(...)`). This approach promotes better code organization and a more intuitive way to interact with FVG data.
FVG Visual Lifecycle Management
The core purpose of this library is to manage the complete visual journey of an FVG on the chart. This lifecycle includes:
Initial Drawing: Creating the first visual representation of a newly detected FVG, including its main box and optionally its midline and labels.
State Updates & Partial Fills: Modifying the FVG's appearance as it gets partially filled by price. This involves drawing a "mitigated" portion of the box and adjusting the `currentTop` or `currentBottom` of the remaining FVG.
Full Mitigation & Tested State: Handling how an FVG is displayed once fully mitigated. Depending on user settings, it might be hidden, or its box might change color/style to indicate it has been "tested." Mitigation lines can also be managed (kept or deleted).
Midline Interaction: Visually tracking if the price has touched the FVG's 50% equilibrium level (midline).
Visibility Control: Dynamically showing or hiding FVG drawings based on various criteria, such as user settings (e.g., hide mitigated FVGs, timeframe-specific visibility) or external filters (e.g., proximity to current price).
Deletion: Cleaning up all drawing objects associated with an FVG when it's no longer needed or when settings dictate its removal.
Centralized Drawing Logic
By encapsulating all drawing-related operations within the methods of this library, the main indicator script is significantly simplified. The main script can focus on detecting FVGs and managing their state (e.g., in arrays), while delegating the complex task of rendering and updating them on the chart to the methods herein.
Interaction with `fvgObject` and `drawSettings` UDTs
All methods within this library operate on an instance of the `fvgObject` UDT. This `fvgObject` holds not only the FVG's price/time data and state (like `isMitigated`, `currentTop`) but also the IDs of its associated drawing elements (e.g., `boxId`, `midLineId`).
The appearance of these drawings (colors, styles, visibility, etc.) is dictated by a `drawSettings` UDT instance, which is passed as a parameter to most drawing-related methods. This `drawSettings` object is typically populated from user inputs in the main script, allowing for extensive customization.
Stateful Drawing Object Management
The library's methods manage Pine Script™ drawing objects (boxes, lines, labels) by storing their IDs within the `fvgObject` itself (e.g., `fvgObject.boxId`, `fvgObject.mitigatedBoxId`, etc.). Methods like `draw()` create these objects and store their IDs, while methods like `updateDrawings()` modify them, and `deleteDrawings()` removes them using these stored IDs.
Drawing Optimization
The `updateDrawings()` method, which is the most comprehensive drawing management function, incorporates optimization logic. It uses `prev_*` fields within the `fvgObject` (e.g., `prevIsMitigated`, `prevCurrentTop`) to store the FVG's state from the previous bar. By comparing the current state with the previous state, and also considering changes in visibility or relevant drawing settings, it can avoid redundant and performance-intensive drawing operations if nothing visually significant has changed for that FVG.
█ METHOD USAGE AND WORKFLOW
The methods in this library are designed to be called in a logical sequence as an FVG progresses through its lifecycle. A crucial prerequisite for all visual methods in this library is a properly populated `drawSettings` UDT instance, which dictates every aspect of an FVG's appearance, from colors and styles to visibility and labels. This `settings` object must be carefully prepared in the main indicator script, typically based on user inputs, before being passed to these methods.
Here’s a typical workflow within a main indicator script:
1. FVG Instance Creation (External to this library)
An `fvgObject` instance is typically created by functions in another library (e.g., `FvgCalculations`) when a new FVG pattern is identified. This object will have its core properties (top, bottom, startTime, isBullish, tfType) initialized.
2. Initial Drawing (`draw` method)
Once a new `fvgObject` is created and its initial visibility is determined:
Call the `myFvg.draw(settings)` method on the new FVG object.
`settings` is an instance of the `drawSettings` UDT, containing all relevant visual configurations.
This method draws the primary FVG box, its midline (if enabled in `settings`), and any initial labels. It also initializes the `currentTop` and `currentBottom` fields of the `fvgObject` if they are `na`, and stores the IDs of the created drawing objects within the `fvgObject`.
3. Per-Bar State Updates & Interaction Checks
On each subsequent bar, for every active `fvgObject`:
Interaction Check (External Logic): It's common to first use logic (e.g., from `FvgCalculations`' `fvgInteractionCheck` function) to determine if the current bar's price interacts with the FVG.
State Field Updates (External Logic): Before calling the `FvgObjectLib` methods below, ensure that your `fvgObject`'s state fields (such as `isMitigated`, `currentTop`, `currentBottom`, `isMidlineTouched`) are updated using the current bar's price data and relevant functions from other libraries (e.g., `FvgCalculations`' `checkMitigation`, `checkPartialMitigation`, etc.). This library's methods render the FVG based on these pre-updated state fields.
If interaction occurs and the FVG is not yet fully mitigated:
Full Mitigation Update (`updateMitigation` method): Call `myFvg.updateMitigation(high, low)`. This method updates `myFvg.isMitigated` and `myFvg.mitigationTime` if full mitigation occurs, based on the interaction determined by external logic.
Partial Fill Update (`updatePartialFill` method): If not fully mitigated, call `myFvg.updatePartialFill(high, low, settings)`. This method updates `myFvg.currentTop` or `myFvg.currentBottom` and adjusts drawings to show the filled portion, again based on prior interaction checks and fill level calculations.
Midline Touch Check (`checkMidlineTouch` method): Call `myFvg.checkMidlineTouch(high, low)`. This method updates `myFvg.isMidlineTouched` if the price touches the FVG's 50% level.
4. Comprehensive Visual Update (`updateDrawings` method)
After the FVG's state fields have been potentially updated by external logic and the methods in step 3:
Call `myFvg.updateDrawings(isVisibleNow, settings)` on each FVG object.
`isVisibleNow` is a boolean indicating if the FVG should currently be visible.
`settings` is the `drawSettings` UDT instance.
This method synchronizes the FVG's visual appearance with its current state and settings, managing all drawing elements (boxes, lines, labels), their styles, and visibility. It efficiently skips redundant drawing operations if the FVG's state or visibility has not changed, thanks to its internal optimization using `prev_*` fields, which are also updated by this method.
5. Deleting Drawings (`deleteDrawings` method)
When an FVG object is no longer tracked:
Call `myFvg.deleteDrawings(deleteTestedToo)`.
This method removes all drawing objects associated with that `fvgObject`.
This workflow ensures that FVG visuals are accurately maintained throughout their existence on the chart.
█ NOTES
Dependencies: This library relies on `FvgTypes` for `fvgObject` and `drawSettings` definitions, and its methods (`updateMitigation`, `updatePartialFill`) internally call functions from `FvgCalculations`.
Drawing Object Management: Be mindful of TradingView's limits on drawing objects per script. The main script should manage the number of active FVG objects.
Performance and `updateDrawings()`: The `updateDrawings()` method is comprehensive. Its internal optimization (checking `hasStateChanged` based on `prev_*` fields) is crucial for performance. Call it judiciously.
Role of `settings.currentTime`: The `currentTime` field in `drawSettings` is key for positioning time-dependent elements like labels and the right edge of non-extended drawings.
Mutability of `fvgObject` Instances: Methods in this library directly modify the `fvgObject` instance they are called upon (e.g., its state fields and drawing IDs).
Drawing ID Checks: Methods generally check if drawing IDs are `na` before acting on them, preventing runtime errors.
█ EXPORTED FUNCTIONS
method draw(this, settings)
Draws the initial visual representation of the FVG object on the chart. This includes the main FVG box, its midline (if enabled), and a label
(if enabled for the specific timeframe). This method is typically invoked
immediately after an FVG is first detected and its initial properties are set. It uses drawing settings to customize the appearance based on the FVG's timeframe type.
Namespace types: types.fvgObject
Parameters:
this (fvgObject type from no1x/FvgTypes/1) : The FVG object instance to be drawn. Core properties (top, bottom,
startTime, isBullish, tfType) should be pre-initialized. This method will
initialize boxId, midLineId, boxLabelId (if applicable), and
currentTop/currentBottom (if currently na) on this object.
settings (drawSettings type from no1x/FvgTypes/1) : A drawSettings object providing all visual parameters. Reads display settings (colors, styles, visibility for boxes, midlines, labels,
box extension) relevant to this.tfType. settings.currentTime is used for
positioning labels and the right boundary of non-extended boxes.
method updateMitigation(this, highVal, lowVal)
Checks if the FVG has been fully mitigated by the current bar's price action.
Namespace types: types.fvgObject
Parameters:
this (fvgObject type from no1x/FvgTypes/1) : The FVG object instance. Reads this.isMitigated, this.isVisible,
this.isBullish, this.top, this.bottom. Updates this.isMitigated and
this.mitigationTime if full mitigation occurs.
highVal (float) : The high price of the current bar, used for mitigation check.
lowVal (float) : The low price of the current bar, used for mitigation check.
method updatePartialFill(this, highVal, lowVal, settings)
Checks for and processes partial fills of the FVG.
Namespace types: types.fvgObject
Parameters:
this (fvgObject type from no1x/FvgTypes/1) : The FVG object instance. Reads this.isMitigated, this.isVisible,
this.isBullish, this.currentTop, this.currentBottom, original this.top/this.bottom,
this.startTime, this.tfType, this.isLV. Updates this.currentTop or
this.currentBottom, creates/updates this.mitigatedBoxId, and may update this.boxId's
top/bottom to reflect the filled portion.
highVal (float) : The high price of the current bar, used for partial fill check.
lowVal (float) : The low price of the current bar, used for partial fill check.
settings (drawSettings type from no1x/FvgTypes/1) : The drawing settings. Reads timeframe-specific colors for mitigated
boxes (e.g., settings.mitigatedBullBoxColor, settings.mitigatedLvBullColor),
box extension settings (settings.shouldExtendBoxes, settings.shouldExtendMtfBoxes, etc.),
and settings.currentTime to style and position the mitigatedBoxId and potentially adjust the main boxId.
method checkMidlineTouch(this, highVal, lowVal)
Checks if the FVG's midline (50% level or Equilibrium) has been touched.
Namespace types: types.fvgObject
Parameters:
this (fvgObject type from no1x/FvgTypes/1) : The FVG object instance. Reads this.midLineId, this.isMidlineTouched,
this.top, this.bottom. Updates this.isMidlineTouched if a touch occurs.
highVal (float) : The high price of the current bar, used for midline touch check.
lowVal (float) : The low price of the current bar, used for midline touch check.
method deleteDrawings(this, deleteTestedToo)
Deletes all visual drawing objects associated with this FVG object.
Namespace types: types.fvgObject
Parameters:
this (fvgObject type from no1x/FvgTypes/1) : The FVG object instance. Deletes drawings referenced by boxId,
mitigatedBoxId, midLineId, mitLineId, boxLabelId, mitLineLabelId,
and potentially testedBoxId, keptMitLineId. Sets these ID fields to na.
deleteTestedToo (simple bool) : If true, also deletes drawings for "tested" FVGs
(i.e., testedBoxId and keptMitLineId).
method updateDrawings(this, isVisibleNow, settings)
Manages the comprehensive update of all visual elements of an FVG object
based on its current state (e.g., active, mitigated, partially filled) and visibility. It handles the drawing, updating, or deletion of FVG boxes (main and mitigated part),
midlines, mitigation lines, and their associated labels. Visibility is determined by the isVisibleNow parameter and relevant settings
(like settings.shouldHideMitigated or timeframe-specific show flags). This method is central to the FVG's visual lifecycle and includes optimization
to avoid redundant drawing operations if the FVG's relevant state or appearance
settings have not changed since the last bar. It also updates the FVG object's internal prev_* state fields for future optimization checks.
Namespace types: types.fvgObject
Parameters:
this (fvgObject type from no1x/FvgTypes/1) : The FVG object instance to update. Reads most state fields (e.g.,
isMitigated, currentTop, tfType, etc.) and updates all drawing ID fields
(boxId, midLineId, etc.), this.isVisible, and all this.prev_* state fields.
isVisibleNow (bool) : A flag indicating whether the FVG should be currently visible. Typically determined by external logic (e.g., visual range filter). Affects
whether active FVG drawings are created/updated or deleted by this method.
settings (drawSettings type from no1x/FvgTypes/1) : A fully populated drawSettings object. This method extensively
reads its fields (colors, styles, visibility toggles, timeframe strings, etc.)
to render FVG components according to this.tfType and current state. settings.currentTime is critical for positioning elements like labels and extending drawings.

HexworksSharedUtilitiesLibrary "HexworksSharedUtilities"
Shared global utilities that can be used for
- creating bounded queues from primitives
- checking visibility of objects having Bounds on both (x, y) axes
- checking if a line is too long
method offer(history, value)
Namespace types: FloatHistory
Parameters:
history (FloatHistory)
value (simple float)
method offer(history, value)
Namespace types: IntHistory
Parameters:
history (IntHistory)
value (simple int)
method offer(history, value)
Namespace types: StringHistory
Parameters:
history (StringHistory)
value (simple string)
method offer(history, value)
Namespace types: BoolHistory
Parameters:
history (BoolHistory)
value (simple bool)
method toString(point)
Namespace types: chart.point
Parameters:
point (chart.point)
method toString(num)
Namespace types: simple float, input float, const float
Parameters:
num (simple float)
method toString(num)
Namespace types: simple int, input int, const int
Parameters:
num (simple int)
method toString(value)
Namespace types: simple bool, input bool, const bool
Parameters:
value (simple bool)
method toString(l)
Namespace types: series line
Parameters:
l (line)
method isLineTooLong(fromPoint, toPoint)
Namespace types: chart.point
Parameters:
fromPoint (chart.point)
toPoint (chart.point)
method isTooLong(l)
Namespace types: series line
Parameters:
l (line)
createVisibilityChecker()
method update(v)
Namespace types: VisibilityChecker
Parameters:
v (VisibilityChecker)
method canDraw(v)
Namespace types: VisibilityChecker
Parameters:
v (VisibilityChecker)
method isVisible(v, b)
Namespace types: VisibilityChecker
Parameters:
v (VisibilityChecker)
b (Bounds)
FloatHistory
Fields:
history (array)
maxLength (series int)
IntHistory
Fields:
history (array)
maxLength (series int)
StringHistory
Fields:
history (array)
maxLength (series int)
BoolHistory
Fields:
history (array)
maxLength (series int)
Bounds
Fields:
startIdx (series int)
endIdx (series int)
highValue (series float)
lowValue (series float)
VisibilityChecker
Fields:
leftVisibleBarIdx (series int)
rightVisibleBarIdx (series int)
maxDrawDistance (series int)
updatedAt (series int)
visibleHighest (series float)
visibleLowest (series float)

reversalchartpatternsLibrary "reversalchartpatterns"
User Defined Types and Methods for reversal chart patterns - Double Top, Double Bottom, Triple Top, Triple Bottom, Cup and Handle, Inverted Cup and Handle, Head and Shoulders, Inverse Head and Shoulders
method delete(this)
Deletes the drawing components of ReversalChartPatternDrawing object
Namespace types: ReversalChartPatternDrawing
Parameters:
this (ReversalChartPatternDrawing) : ReversalChartPatternDrawing object
Returns: current ReversalChartPatternDrawing object
method delete(this)
Deletes the drawing components of ReversalChartPattern object. In turn calls the delete of ReversalChartPatternDrawing
Namespace types: ReversalChartPattern
Parameters:
this (ReversalChartPattern) : ReversalChartPattern object
Returns: current ReversalChartPattern object
method lpush(this, obj, limit, deleteOld)
Array push with limited number of items in the array. Old items are deleted when new one comes and exceeds the limit
Namespace types: array
Parameters:
this (array) : array object
obj (ReversalChartPattern) : ReversalChartPattern object which need to be pushed to the array
limit (int) : max items on the array. Default is 10
deleteOld (bool) : If set to true, also deletes the drawing objects. If not, the drawing objects are kept but the pattern object is removed from array. Default is false.
Returns: current ReversalChartPattern object
method draw(this)
Draws the components of ReversalChartPatternDrawing
Namespace types: ReversalChartPatternDrawing
Parameters:
this (ReversalChartPatternDrawing) : ReversalChartPatternDrawing object
Returns: current ReversalChartPatternDrawing object
method draw(this)
Draws the components of ReversalChartPatternDrawing within the ReversalChartPattern object.
Namespace types: ReversalChartPattern
Parameters:
this (ReversalChartPattern) : ReversalChartPattern object
Returns: current ReversalChartPattern object
method scan(zigzag, patterns, errorPercent, shoulderStart, shoulderEnd, allowedPatterns, offset)
Scans zigzag for ReversalChartPattern occurences
Namespace types: zg.Zigzag
Parameters:
zigzag (Zigzag type from Trendoscope/Zigzag/11) : ZigzagTypes.Zigzag object having array of zigzag pivots and other information on each pivots
patterns (array) : Existing patterns array. Used for validating duplicates
errorPercent (float) : Error threshold for considering ratios. Default is 13
shoulderStart (float) : Starting range of shoulder ratio. Used for identifying shoulders, handles and necklines
shoulderEnd (float) : Ending range of shoulder ratio. Used for identifying shoulders, handles and necklines
allowedPatterns (array) : array of int containing allowed pattern types
offset (int) : Offset of zigzag to consider only confirmed pivots
Returns: int pattern type
method createPattern(zigzag, patternType, patternColor, properties, offset)
Create Pattern from ZigzagTypes.Zigzag object
Namespace types: zg.Zigzag
Parameters:
zigzag (Zigzag type from Trendoscope/Zigzag/11) : ZigzagTypes.Zigzag object having array of zigzag pivots and other information on each pivots
patternType (int) : Type of pattern being created. 1 - Double Tap, 2 - Triple Tap, 3 - Cup and Handle, 4 - Head and Shoulders
patternColor (color) : Color in which the patterns are drawn
properties (ReversalChartTradeProperties)
offset (int)
Returns: ReversalChartPattern object created
method getName(this)
get pattern name of ReversalChartPattern object
Namespace types: ReversalChartPattern
Parameters:
this (ReversalChartPattern) : ReversalChartPattern object
Returns: string name of the pattern
method getDescription(this)
get consolidated description of ReversalChartPattern object
Namespace types: ReversalChartPattern
Parameters:
this (ReversalChartPattern) : ReversalChartPattern object
Returns: string consolidated description
method init(this)
initializes the ReversalChartPattern object and creates sub object types
Namespace types: ReversalChartPattern
Parameters:
this (ReversalChartPattern) : ReversalChartPattern object
Returns: ReversalChartPattern current object
ReversalChartPatternDrawing
Type which holds the drawing objects for Reversal Chart Pattern Types
Fields:
patternLines (array type from Trendoscope/Drawing/2) : array of Line objects representing pattern
entry (Line type from Trendoscope/Drawing/2) : Entry price Line
targets (array type from Trendoscope/Drawing/2)
stop (Line type from Trendoscope/Drawing/2) : Stop price Line
patternLabel (Label type from Trendoscope/Drawing/2)
ReversalChartTradeProperties
Trade properties of ReversalChartPattern
Fields:
riskAdjustment (series float) : Risk Adjustment for calculation of stop
useFixedTarget (series bool) : Boolean flag saying use fixed target type wherever possible. If fixed target type is not possible, then risk reward/fib ratios are used for calculation of targets
variableTargetType (series int) : Integer value which defines whether to use fib based targets or risk reward based targets. 1 - Risk Reward, 2 - Fib Ratios
variableTargetRatios (array) : Risk reward or Fib Ratios to be used for calculation of targets when fixed target is not possible or not enabled
entryPivotForWm (series int) : which Pivot should be considered as entry point for WM patterns. 0 refers to the latest breakout pivot where as 5 refers to initial pivot of the pattern
ReversalChartPattern
Reversal Chart Pattern master type which holds the pattern components, drawings and trade details
Fields:
pivots (array type from Trendoscope/Zigzag/11) : Array of Zigzag Pivots forming the pattern
patternType (series int) : Defines the main type of pattern 1 - Double Tap, 1 - Triple Tap, 3 - Cup and Handle, 4 - Head and Shoulders, 5- W/M Patterns, 6 - Full Trend, 7 - Half Trend
patternColor (series color) : Color in which the pattern will be drawn on chart
properties (ReversalChartTradeProperties)
drawing (ReversalChartPatternDrawing) : ReversalChartPatternDrawing object which holds the drawing components
trade (Trade type from Trendoscope/TradeTracker/1) : TradeTracker.Trade object holding trade components

projectiontrackingLibrary "projectiontracking"
Library contains few data structures and methods for tracking harmonic patterns and projections via pinescript.
method erase(this)
erase Harmonic Projection Drawing
Namespace types: HarmonicProjectionDrawing
Parameters:
this (HarmonicProjectionDrawing) : HarmonicProjectionDrawing object
Returns: void
method erase(this)
erase HarmonicProjection
Namespace types: HarmonicProjection
Parameters:
this (HarmonicProjection) : HarmonicProjection object
Returns: void
method draw(this)
draw HarmonicProjection
Namespace types: HarmonicProjection
Parameters:
this (HarmonicProjection) : HarmonicProjection object
Returns: HarmonicProjection object
method getRanges(projectionPrzRanges, dir)
Convert PRZRange to Projection ranges
Namespace types: array
Parameters:
projectionPrzRanges (array type from Trendoscope/HarmonicMapLib/1) : array of PrzRange objects
dir (int) : Projection direction
Returns: array
ProjectionRange
Harmonic Projection Range
Fields:
patterns (array) : array of pattern names
start (series float) : Start Range
end (series float) : End Range
status (series int) : Projection Status
ProjectionProperties
Harmonic Projection Properties
Fields:
fillMajorTriangles (series bool) : Use linefill for major triangles
fillMinorTriangles (series bool) : Use linefill for minor triangles
majorFillTransparency (series int) : transparency of major triangles
minorFillTransparency (series int) : transparency of minor triangles
showXABC (series bool) : Show XABC labels
lblSizePivots (series string) : Pivot labels size
showRatios (series bool) : Show ratio labels
useLogScaleForScan (series bool) : Log scale is used for scanning projections
activateOnB (series bool) : Activate projections on reaching B
activationRatio (series float) : Use activation ratio for activation
confirmationRatio (series float) : Confirmation ratio of projection before removal
HarmonicProjectionDrawing
Harmonic Projection Projection drawing objects
Fields:
xa (series line) : line xa
ab (series line) : line ab
bc (series line) : line bc
xb (series line) : line xb
ac (series line) : line ac
x (series label) : Pivot label x
a (series label) : Pivot label a
b (series label) : Pivot label b
c (series label) : Pivot label c
xabRatio (series label) : Label XAB Ratio
abcRatio (series label) : Label ABC Ratio
HarmonicProjection
Harmonic Projection Projection object
Fields:
patternId (series int) : id of the pattern
dir (series int) : projection direction
x (chart.point) : Pivot X
a (chart.point) : Pivot A
b (chart.point) : Pivot B
c (chart.point) : Pivot C
patternColor (series color) : Color in which pattern is displayed
przRange (PrzRange type from Trendoscope/HarmonicMapLib/1) : PRZ Range
activationPrice (series float) : Projection activation price
reversalPrice (series float) : Projection reversal price
status (series int) : Projection status
properties (ProjectionProperties) : Projection properties
projectionRanges (array) : array of Projection Ranges
initialD (series float) : Initial D pivot
d (chart.point) : Pivot D
drawing (HarmonicProjectionDrawing) : HarmonicProjectionDrawing Object

HarmonicMapLibLibrary "HarmonicMapLib"
Harmonic Pattern Library implementation utilising maps
method tostring(this)
convert Range value to string
Namespace types: Range
Parameters:
this (Range) : Range value
Returns: converted string representation
method tostring(this)
convert array of Range value to string
Namespace types: array
Parameters:
this (array) : array object
Returns: converted string representation
method tostring(this)
convert map of string to Range value to string
Namespace types: map
Parameters:
this (map) : map object
Returns: converted string representation
method tostring(this)
convert RatioMap to string
Namespace types: RatioMap
Parameters:
this (RatioMap) : RatioMap object
Returns: converted string representation
method tostring(this)
convert array of RatioMap to string
Namespace types: array
Parameters:
this (array) : array object
Returns: converted string representation
method tostring(this)
convert map of string to RatioMap to string
Namespace types: map
Parameters:
this (map) : map object
Returns: converted string representation
method tostring(this)
convert map of string to bool to string
Namespace types: map
Parameters:
this (map) : map object
Returns: converted string representation
method tostring(this)
convert PrzRange to string
Namespace types: PrzRange
Parameters:
this (PrzRange) : PrzRange object
Returns: converted string representation
method tostring(this)
convert array of PrzRange to string
Namespace types: array
Parameters:
this (array) : array object
Returns: converted string representation
getHarmonicMap()
Creates the RatioMap for harmonic patterns
Returns: map haronic ratio rules for all patterns
method evaluate(patternsMap, pattern, ratioRange, properties, ratioValue)
evaluates harmonic ratio range
Namespace types: map
Parameters:
patternsMap (map) : parameter containing valid pattern names
pattern (string) : Pattern type to be evaluated
ratioRange (Range) : ratio range to be checked
properties (ScanProperties) : Scan Properties
ratioValue (float)
Returns: void
method evaluate(przRange, pattern, ratioRange, priceRange, properties)
Evaluate PRZ ranges
Namespace types: map
Parameters:
przRange (map)
pattern (string) : Pattern name
ratioRange (Range) : Range of ratio for the pattern
priceRange (Range) : Price range based on ratio
properties (ScanProperties) : ScanProperties object
Returns: void
method scanRatio(currentPatterns, rules, properties, ratioName, ratioValue)
Scan for particular named ratio of harmonic pattern to filter valid patterns
Namespace types: map
Parameters:
currentPatterns (map) : Current valid patterns map
rules (map) : map Harmonic ratio rules
properties (ScanProperties) : ScanProperties object
ratioName (string) : Specific ratio name
ratioValue (float) : ratio value to be checked
Returns: updated currentPatterns object
method scanPatterns(patterns, x, a, b, c, d, properties)
Scan for patterns based on X, A, B, C, D values
Namespace types: map
Parameters:
patterns (map) : List of allowed patterns
x (float) : X coordinate
a (float) : A coordinate
b (float) : B coordinate
c (float) : C coordinate
d (float) : D coordinate
properties (ScanProperties) : ScanProperties object. If na, default values are initialised
Returns: updated valid patterns map
method scanProjections(patterns, x, a, b, c, properties)
Scan for projections based on X, A, B, C values
Namespace types: map
Parameters:
patterns (map) : List of allowed patterns
x (float) : X coordinate
a (float) : A coordinate
b (float) : B coordinate
c (float) : C coordinate
properties (ScanProperties) : ScanProperties object. If na, default values are initialised
Returns: updated valid projections map
method merge(this, other)
merge two ranges into one
Namespace types: Range
Parameters:
this (Range) : first range
other (Range) : second range
Returns: combined range
method union(this, other)
union of two ranges into one
Namespace types: Range
Parameters:
this (Range) : first range
other (Range) : second range
Returns: union range
method overlaps(this, other)
checks if two ranges intersect
Namespace types: Range
Parameters:
this (Range) : first range
other (Range) : second range
Returns: true if intersects, false otherwise
method consolidate(this)
Consolidate ranges into PRZ
Namespace types: map
Parameters:
this (map) : map of Ranges
Returns: consolidated PRZ
method consolidateMany(this)
Consolidate ranges into multiple PRZ ranges
Namespace types: map
Parameters:
this (map) : map of Ranges
Returns: consolidated array of PRZ ranges
method getRange(currentPatterns, x, a, b, c, properties)
Get D range based on X, A, B, C coordinates for the current patterns
Namespace types: map
Parameters:
currentPatterns (map) : List of valid patterns
x (float) : X coordinate
a (float) : A coordinate
b (float) : B coordinate
c (float) : C coordinate
properties (ScanProperties) : ScanProperties object. If na, default values are initialised
Returns: map of D ranges
method getPrzRange(currentPatterns, x, a, b, c, properties)
Get PRZ range based on X, A, B, C coordinates for the current patterns
Namespace types: map
Parameters:
currentPatterns (map) : List of valid patterns
x (float) : X coordinate
a (float) : A coordinate
b (float) : B coordinate
c (float) : C coordinate
properties (ScanProperties) : ScanProperties object. If na, default values are initialised
Returns: PRZRange for the pattern
method getProjectionRanges(currentPatterns, x, a, b, c, properties)
Get projection range based on X, A, B, C coordinates for the current patterns
Namespace types: map
Parameters:
currentPatterns (map) : List of valid patterns
x (float) : X coordinate
a (float) : A coordinate
b (float) : B coordinate
c (float) : C coordinate
properties (ScanProperties) : ScanProperties object. If na, default values are initialised
Returns: array of projection ranges
Range
Collection of range values
Fields:
values (array) : array of float values
RatioMap
ratio map for pattern
Fields:
ratioMap (map) : map of string to Range (array of float)
ScanProperties
Pattern Scanning properties
Fields:
strictMode (series bool) : strict scanning mode will check for overflows
logScale (series bool) : scan ratios in log scale
errorMin (series float) : min error threshold
errorMax (series float)
mintick (series float) : minimum tick value of price
PrzRange
Potential reversal zone range
Fields:
patterns (array) : array of pattern names for the given XABCD combination
prz (Range) : PRZ range
drawingutilsLibrary "drawingutils"
methods used in my scripts for some basic and customized drawings and arrays.
method line(this, p1, p2, lineColor, style, width, xloc, extend)
Draws line and adds to the array
Namespace types: array
Parameters:
this (array) : array to which the created line needs to be added
p1 (chart.point) : point1 of the line
p2 (chart.point) : point2 of the line
lineColor (color) : line color
style (string) : line style
width (int) : line width
xloc (string) : xloc.bar_index or xloc.bar_time
extend (string) : default is extend.none
Returns: line created
method label(this, p, txt, tooltip, xloc, yloc, color, style, textcolor, size, textalign)
Draws label and adds to the array
Namespace types: array
Parameters:
this (array) : array to which the created label needs to be added
p (chart.point) : point at which the label needs to be drawn
txt (string) : label text
tooltip (string) : tooltip text
xloc (string) : xloc value - xloc.bar_index or xloc.bar_time
yloc (string) : y location of the label
color (color) : label color
style (string) : label style
textcolor (color) : label text color
size (string) : Size of the label
textalign (string) : text alignment
Returns: label created
method linefill(this, ln1, ln2, fillColor, transparency)
Draws linefill and adds to array
Namespace types: array
Parameters:
this (array) : array to which the created linefill needs to be added
ln1 (line) : line1 of the fill
ln2 (line) : line2 of the fill
fillColor (color) : fill Color
transparency (int) : fill transparency
Returns: linefill created
draw_labelled_line(target, lblText, linecolor, labelcolor, index, highlight, linesArray, labelsArray, highlightSize, tinySize, yloc, textalign)
Draws labelled line
Parameters:
target (float) : target price
lblText (string) : label text
linecolor (color) : line color
labelcolor (color) : label color
index (int) : index to calculate the distance offset
highlight (bool) : highlight true/false
linesArray (array) : array of lines where the created line is added
labelsArray (array) : array of labels where the created label is added
highlightSize (string) : Size of highlighted text
tinySize (string) : size of non highlighted text
yloc (string) : y location
textalign (string) : text alignment
Returns: void
draw_labelled_box(y1, y2, labelColor, labelText, index, boxArray, labelArray, borderColor, borderStyle, borderWidth, textAlign, highlight, highLightLabel)
Draws custom labelled box
Parameters:
y1 (float) : price 1 of the box
y2 (float) : price 2 of the box
labelColor (color) : label color
labelText (string) : label text
index (int) : index to calculate the offset distance
boxArray (array) : box array to which the box needs to be added
labelArray (array) : label array to which the label needs to be added
borderColor (color) : border color
borderStyle (string) : border style
borderWidth (int) : border width
textAlign (string) : text align of the label
highlight (bool) : highlight label text
highLightLabel (bool) : highlight label size
Returns: void

TrendLibrary "Trend"
calculateSlopeTrend(source, length, thresholdMultiplier)
Parameters:
source (float)
length (int)
thresholdMultiplier (float)
Purpose:
The primary goal of this function is to determine the short-term trend direction of a given data series (like closing prices). It does this by calculating the slope of the data over a specified period and then comparing that slope against a dynamic threshold based on the data's recent volatility. It classifies the trend into one of three states: Upward, Downward, or Flat.
Parameters:
`source` (Type: `series float`): This is the input data series you want to analyze. It expects a series of floating-point numbers, typically price data like `close`, `open`, `hl2` (high+low)/2, etc.
`length` (Type: `int`): This integer defines the lookback period. The function will analyze the `source` data over the last `length` bars to calculate the slope and standard deviation.
`thresholdMultiplier` (Type: `float`, Default: `0.1`): This is a sensitivity factor. It's multiplied by the standard deviation to determine how steep the slope needs to be before it's considered a true upward or downward trend. A smaller value makes it more sensitive (detects trends earlier, potentially more false signals), while a larger value makes it less sensitive (requires a stronger move to confirm a trend).
Calculation Steps:
Linear Regression: It first calculates the value of a linear regression line fitted to the `source` data over the specified `length` (`ta.linreg(source, length, 0)`). Linear regression finds the "best fit" straight line through the data points.
Slope Calculation: It then determines the slope of this linear regression line. Since `ta.linreg` gives the *value* of the line on the current bar, the slope is calculated as the difference between the current bar's linear regression value (`linRegValue`) and the previous bar's value (`linRegValue `). A positive difference means an upward slope, negative means downward.
Volatility Measurement: It calculates the standard deviation (`ta.stdev(source, length)`) of the `source` data over the same `length`. Standard deviation is a measure of how spread out the data is, essentially quantifying its recent volatility.
Adaptive Threshold: An adaptive threshold (`threshold`) is calculated by multiplying the standard deviation (`stdDev`) by the `thresholdMultiplier`. This is crucial because it means the definition of a "flat" trend adapts to the market's volatility. In volatile times, the threshold will be wider, requiring a larger slope to signal a trend. In quiet times, the threshold will be narrower.
Trend Determination: Finally, it compares the calculated `slope` to the adaptive `threshold`:
If the `slope` is greater than the positive `threshold`, the trend is considered **Upward**, and the function returns `1`.
If the `slope` is less than the negative `threshold` (`-threshold`), the trend is considered **Downward**, and the function returns `-1`.
If the `slope` falls between `-threshold` and `+threshold` (inclusive of 0), the trend is considered **Flat**, and the function returns `0`.
Return Value:
The function returns an integer representing the determined trend direction:
`1`: Upward trend
`-1`: Downward trend
`0`: Flat trend
In essence, this library function provides a way to gauge trend direction using linear regression, but with a smart filter (the adaptive threshold) to avoid classifying minor noise or low-volatility periods as significant trends.
ChartPatternSetupsLibrary "ChartPatternSetups"
detectSymmetricalTriangle(lookback)
Detects a Symmetrical Triangle (Bullish or Bearish) and provides trade levels.
Parameters:
lookback (int) : Number of bars to look back for pivots.
Returns: Tuple of (isBullish, isBearish, entry, sl, tp).
detectAscendingTriangle(lookback)
Detects an Ascending Triangle (Bullish) and provides trade levels.
Parameters:
lookback (int) : Number of bars to look back for pivots.
Returns: Tuple of (isDetected, entry, sl, tp).
detectDescendingTriangle(lookback)
Detects a Descending Triangle (Bearish) and provides trade levels.
Parameters:
lookback (int) : Number of bars to look back for pivots.
Returns: Tuple of (isDetected, entry, sl, tp).
detectFallingWedge(lookback)
Detects a Falling Wedge (Bullish) and provides trade levels.
Parameters:
lookback (int) : Number of bars to look back for pivots.
Returns: Tuple of (isDetected, entry, sl, tp).
detectRisingWedge(lookback)
Detects a Rising Wedge (Bearish) and provides trade levels.
Parameters:
lookback (int) : Number of bars to look back for pivots.
Returns: Tuple of (isDetected, entry, sl, tp).

Fibonacci 3-D🟩 The Fibonacci 3-D indicator is a visual tool that introduces a three-dimensional approach to Fibonacci projections, leveraging market geometry. Unlike traditional Fibonacci tools that rely on two points and project horizontal levels, this indicator leverages slopes derived from three points to introduce a dynamic element into the calculations. The Fibonacci 3-D indicator uses three user-defined points to form a triangular structure, enabling multi-dimensional projections based on the relationships between the triangle’s sides.
This triangular framework forms the foundation for the indicator’s calculations, with each slope (⌳AB, ⌳AC, and ⌳BC) representing the rate of price change between its respective points. By incorporating these slopes into Fibonacci projections, the indicator provides an alternate approach to identifying potential support and resistance levels. The Fibonacci 3-D expands on traditional methods by integrating both historical price trends and recent momentum, offering deeper insights into market dynamics and aligning with broader market geometry.
The indicator operates across three modes, each defined by the triangular framework formed by three user-selected points (A, B, and C):
1-Dimensional (1-D): Fibonacci levels are based on a single side of the triangle, such as AB, AC, or BC. The slope of the selected side determines the angle of the projection, allowing users to analyze linear trends or directional price movements.
2-Dimensional (2-D): Combines two slopes derived from the sides of the triangle, such as AB and BC or AC and BC. This mode adds depth to the projections, accounting for both historical price swings and recent market momentum.
3-Dimensional (3-D): Integrates all three slopes into a unified projection. This mode captures the full geometric relationship between the points, revealing a comprehensive view of geometric market structure.
🌀 THEORY & CONCEPT 🌀
The Fibonacci 3-D indicator builds on the foundational principles of traditional Fibonacci analysis while expanding its scope to capture more intricate market structures. At its core, the indicator operates based on three user-selected points (A, B, and C), forming the vertices of a triangle that provides the structural basis for all calculations. This triangle determines the slopes, projections, and Fibonacci levels, aligning with the unique geometric relationships between the chosen points. By introducing multiple dimensions and leveraging this triangular framework, the indicator enables a deeper examination of price movements.
1️⃣ First Dimension (1-D)
In technical analysis, traditional Fibonacci retracement and extension tools operate as one-dimensional instruments. They rely on two price points, often a swing high and a swing low, to calculate and project horizontal levels at predefined Fibonacci ratios. These levels identify potential support and resistance zones based solely on the price difference between the selected points.
A one-dimensional Fibonacci showing levels derived from two price points (B and C).
The Fibonacci 3-D indicator extends this one-dimensional concept by introducing Ascending and Descending projection options. These options calculate the levels to align with the directional movement of price, creating sloped projections instead of purely horizontal levels.
1-D mode with an ascending projection along the ⌳BC slope aligned to the market's slope. Potential support is observed at 0.236 and 0.382, while resistance appears at 1.0 and 0.5.
2️⃣ Second Dimension (2-D)
The second dimension incorporates a second side of the triangle, introducing relationships between two slopes (e.g., ⌳AB and ⌳BC) to form a more dynamic three-point structure (A, B, and C) on the chart. This structure enables the indicator to move beyond the single-axis (price) calculations of traditional Fibonacci tools. The sides of the triangle (AB, AC, BC) represent slopes calculated as the rate of price change over time, capturing distinct components of market movement, such as trend direction and momentum.
2-D mode of the Fibonacci 3-D indicator using the ⌳AC slope with a descending projection. The Fibonacci projections align closely with observed market behavior, providing support at 0.236 and resistance at 0.618. Unlike traditional zigzag setups, this configuration uses two swing highs (A and B) and a swing low (C). The alignment along the descending slope highlights the geometric relationships between selected points in identifying potential support and resistance levels.
3️⃣ Third Dimension (3-D)
The third dimension expands the analysis by integrating all three slopes into a unified calculation, encompassing the entire triangle structure formed by points A, B, and C. Unlike the second dimension, which analyzes pairwise slope relationships, the 3-D mode reflects the combined geometry of the triangle. Each slope contributes a distinct perspective: AB and AC provide historical context, while BC emphasizes the most recent price movement and is given greater weight in the calculations to ensure projections remain responsive to current dynamics.
Using this integrated framework, the 3-D mode dynamically adjusts Fibonacci projections to balance long-term patterns and short-term momentum. The projections extend outward in alignment with the triangle’s geometry, offering a comprehensive framework for identifying potential support and resistance zones and capturing market structures beyond the scope of simpler 1-D or 2-D modes.
Three-dimensional Fibonacci projection using the ⌳AC slope, aligning closely with the market's directional movement. The projection highlights key levels: resistance at 0.0 and 0.618, and support at 1.0, 0.786, and 0.382.
By leveraging all three slopes simultaneously, the 3-D mode introduces a level of complexity particularly suited for volatile or non-linear markets. The weighted slope calculations ensure no single price movement dominates the analysis, allowing the projections to adapt dynamically to the broader market structure while remaining sensitive to recent momentum.
Three-dimensional ascending projection. In 3D mode, the indicator integrates all three slopes to calculate the angle of projection for the Fibonacci levels. The resulting projections adapt dynamically to the overall geometry of the ABC structure, aligning with the market’s current direction.
🔂 Interactions: Dimensions. Slope Source, Projections, and Orientation
The Dimensions , Projections , and Orientation settings work together to define Fibonacci projections within the triangular framework. Each setting plays a specific role in the geometric analysis of price movements.
♾️ Dimension determines which of the three modes (1-D, 2-D, or 3-D) is used for Fibonacci projections. In 1-D mode, the projections are based on a single side of the triangle, such as AB, AC, or BC. In 2-D mode, two sides are combined, producing levels based on their geometric relationship. The 3-D mode integrates all three sides of the triangle, calculating projections using weighted averages that emphasize the BC side for its relevance to recent price movement while maintaining historical context from the AB and AC sides.
A one-dimensional Fibonacci projection using the ⌳AB slope with a neutral projection. Important levels of interaction are highlighted: repeated resistance at Level 1.0 and repeated support at Levels 0.5 and 0.618. The projection aligns horizontally, reflecting the relationship between points A, B, and C while identifying recurring zones of market structure.
🧮 Slope Source determines which side of the triangle (AB, AC, or BC) serves as the foundation for Fibonacci projections. This selection directly impacts the calculations by specifying the slope that anchors the geometric relationships within the chosen Dimension mode (1-D, 2-D, or 3-D).
In 1-D mode, the selected Source defines the single side used for the projection. In 2-D and 3-D modes, the Source works in conjunction with other settings to refine projections by integrating the selected slope into the multi-dimensional framework.
One-dimensional Fibonacci projection using the ⌳AC Slope Source and Ascending projection. The projection continues on the AC slope line.
🎯 Projection controls the direction and alignment of Fibonacci levels. Neutral projections produce horizontal levels, similar to traditional Fibonacci tools. Ascending and Descending projections adjust the levels along the calculated slope to reflect market trends. These options allow the indicator’s outputs to align with different market behaviors.
An ascending projection along the ⌳BC slope aligns with resistance levels at 1.0, 0.618, and 0.236. The geometric relationship between points A, B, and C illustrates how the projection adapts to market structure, identifying resistance zones that may not be captured by traditional Fibonacci tools.
🧭 Orientation modifies the alignment of the setup area defined by points A, B, and C, which influences Fibonacci projections in 2-D and 3-D modes. In Default mode, the triangle aligns naturally based on the relative positions of points B and C. In Inverted mode, the geometric orientation of the setup area is reversed, altering the slope calculations while preserving the projection direction specified in the Projection setting. In 1-D mode, Orientation has no effect since only one side is used for the projection.
Adjusting the Orientation setting provides alternative views of how Fibonacci levels align with the market's structure. By recalibrating the triangle’s setup, the inverted orientation can highlight different relationships between the sides, providing additional perspectives on support and resistance zones.
2-D inverted. The ⌳AC slope defines the projection, and the inverted orientation adjusts the alignment of the setup area, altering the angles used in level calculations. Key levels are highlighted: resistance at 0.786, strong support at 0.5 and 0.236, and a resistance-turned-support interaction at 0.618.
🛠️ CONFIGURATION AND SETTINGS 🛠️
The Fibonacci 3-D indicator includes configurable settings to adjust its functionality and visual representation. These options include customization of the dimensions (1-D, 2-D, or 3-D), slope calculations, orientations, projections, Fibonacci levels, and visual elements.
When adding the indicator to a new chart, select three reference points (A, B, and C). These are usually set to recent swing points. All three points can be easily changed at any time by clicking on the reference point and dragging it to a new location.
By default, all settings are set to Auto . The indicator uses an internal algorithm to estimate the projections based on the orientation and relative positions of the reference points. However, all values can be overridden to reflect the user's interpretation of the current market geometry.
⚙️ Core Settings
Dimensions : Defines how many sides of the triangle formed by points A, B, and C are incorporated into the calculations for Fibonacci projections. This setting determines the level of complexity and detail in the analysis. 1-D : Projects levels along the angle of a single user-selected side of the triangle.
2-D : Projects levels based on a composite slope derived from the angles of two sides of the triangle.
3-D : Projects levels based on a composite slope derived from all three sides of the triangle (A-B, A-C, and B-C), providing a multi-dimensional projection that adapts to both historical and recent market movements.
Slope Source : Determines which side of the triangle is used as the basis for slope calculations. A–B: The slope between points A and B. In 1-D mode, this determines the projection. In 2-D and 3-D modes, it contributes to the composite slope calculation.
A–C: The slope between points A and C. In 1-D mode, this determines the projection. In 2-D and 3-D modes, it contributes to the composite slope calculation.
B--C: The slope between points B and C. In 1-D mode, this determines the projection. In 2-D and 3-D modes, it contributes to the composite slope calculation.
Orientation : Defines the triangle's orientation formed by points A, B, and C, influencing slope calculations. Auto : Automatically determines orientation based on the relative positions of points B and C. If point C is to the right of point B, the orientation is "normal." If point C is to the left, the orientation is inverted.
Inverted : Reverses the orientation set in "Auto" mode. This flips the triangle, reversing slope calculations ⌳AB becomes ⌳BA).
Projection : Determines the direction of Fibonacci projections: Auto : Automatically determines projection direction based on the triangle formed by A, B, and C.
Ascending : Projects the levels upward.
Neutral : Projects the levels horizontally, similar to traditional Fibonacci retracements.
Descending : Projects the levels downward.
⚙️ Fibonacci Level Settings Show or hide specific levels.
Level Value : Adjust Fibonacci ratios for each level. The 0.0 and 1.0 levels are fixed.
Color : Set level colors.
⚙️ Visibility Settings Show Setup : Toggle the display of the setup area, which includes the projected lines used in calculations.
Show Triangle : Toggle the display of the triangle formed by points A, B, and C.
Triangle Color : Set triangle line colors.
Show Point Labels : Toggle the display of labels for points A, B, and C.
Show Left/Right Labels : Toggle price labels on the left and right sides of the chart.
Fill % : Adjust the fill intensity between Fibonacci levels (0% for no fill, 100% for full fill).
Info : Set the location or hide the Slope Source and Dimension. If Orientation is Inverted , the Slope Source will display with an asterisk (*).
⚙️ Time-Price Points : Set the time and price for points A, B, and C, which define the Fibonacci projections.
A, B, and C Points : User-defined time and price coordinates that form the foundation of the indicator's calculations.
Interactive Adjustments : Changes made to points on the chart automatically synchronize with the settings panel and update projections in real time.
Notes
Unlike traditional Fibonacci tools that include extensions beyond 1.0 (e.g., 1.618 or 2.618), the Fibonacci 3-D indicator restricts Fibonacci levels to the range between 0.0 and 1.0. This is because the projections are tied directly to the proportional relationships along the sides of the triangle formed by points A, B, and C, rather than extending beyond its defined structure.
The indicator's calculations dynamically sort the user-defined A, B, and C points by time, ensuring point A is always the earliest, point C the latest, and point B the middle. This automatic sorting allows users to freely adjust the points directly on the chart without concern for their sequence, maintaining consistency in the triangular structure.
🖼️ ADDITIONAL CHART EXAMPLES 🖼️
Three-dimensional ⌳AC slope is used with an ascending projection, even as the broader market trend moves downward. Despite the apparent contradiction, the projected Fibonacci levels align closely with price action, identifying zones of support and resistance. These levels highlight smaller countertrend movements, such as pullbacks to 0.382 and 0.236, followed by continuations at resistance levels like 0.618 and 0.786.
In 2-D mode, an ascending projection based on the BC slope highlights the market's geometric structure. A setup triangle, defined by a swing high (A), a swing low (B), and another swing high (C), reveals Fibonacci projections aligning with support at 0.236, 0.382, and 0.5, and resistance at 0.618, 0.786, and 1.0, as shown by the green and red arrows. This demonstrates the ability to uncover dynamic support and resistance levels not calculated in traditional Fibonacci tools.
In 2-D mode with an ascending projection from the ⌳AB slope, price movement is contained within the 0.5 and 0.786 levels. The 0.5 level serves as support, while the 0.786 level acts as resistance, with price action consistently interacting with these boundaries.
An AC (2-D) ascending projection is derived from two swing highs (A and B) and a swing low (C), reflecting a non-linear market structure that deviates from traditional zigzag patterns. The ascending projection aligns closely with the market's upward trajectory, forming a channel between the 0.0 and 0.5 Fibonacci levels. Note how price action interacts with the projected levels, showing support at 0.236 and 0.382, with the 0.5 level acting as a mid-channel equilibrium.
Two-dimensional ascending Fibonacci projection using the ⌳AC slope. Arrows highlight resistance at 0.786 and support at 0.0 and 0.236. The projection follows the ⌳AC slope, reflecting the geometric relationship between points A, B, and C to identify these levels.
Three-dimensional Fibonacci projection using the ⌳AC slope, aligned with the actual market's directional trend. By removing additional Fibonacci levels, the image emphasizes key areas: resistance at Level 0.0 and support at Levels 1.0 and 0.5. The projection dynamically follows the ⌳AC slope, adapting to the market's structure as defined by points A, B, and C.
A three-dimensional configuration uses the ⌳AB slope as the baseline for projections while incorporating the geometric influence of point C. Only the 0.0 and 0.618 levels are enabled, emphasizing the relationship between support at 0.0 and resistance at 0.618. Unlike traditional Fibonacci tools, which operate in a single plane, this setup reveals levels that rely on the triangular relationship between points A, B, and C. The third dimension allows for projections that align more closely with the market’s structure and reflect its multi-dimensional geometry.
The Fibonacci 3-D indicator can adapt to non-traditional point selection. Point A serves as a swing low, while points B and C are swing highs, forming an unconventional configuration. ⌳The BC slope is used in 2-D mode with an inverted orientation, flipping the projection direction and revealing resistance at Level 0.786 and support at Levels 0.618 and 0.5.
⚠️ DISCLAIMER ⚠️
The Fibonacci 3-D indicator is a visual analysis tool designed to illustrate Fibonacci relationships. While the indicator employs precise mathematical and geometric formulas, no guarantee is made that its calculations will align with other Fibonacci tools or proprietary methods. Like all technical and visual indicators, the Fibonacci projections generated by this tool may appear to visually align with key price zones in hindsight. However, these projections are not intended as standalone signals for trading decisions. This indicator is intended for educational and analytical purposes, complementing other tools and methods of market analysis.
🧠 BEYOND THE CODE 🧠
The Fibonacci 3-D indicator, like other xxattaxx indicators , is designed to encourage both education and community engagement. Your feedback and insights are invaluable to refining and enhancing the Fibonacci 3-D indicator. We look forward to the creative applications, adaptations, and observations this tool inspires within the trading community.

Geo. Geo.
This library provides a comprehensive set of geometric functions based on 2 simple types for point and line manipulation, point array calculations, some vector operations (Borrowed from @ricardosantos ), angle calculations, and basic polygon analysis. It offers tools for creating, transforming, and analyzing geometric shapes and their relationships.
View the source code for detailed documentation on each function and type.
═════════════════════════════════════════════════════════════════════════
█ OVERVIEW
This library enhances TradingView's Pine Script with robust geometric capabilities. It introduces the Point and Line types, along with a suite of functions for various geometric operations. These functionalities empower you to perform advanced calculations, manipulations, and analyses involving points, lines, vectors, angles, and polygons directly within your Pine scripts. The example is at the bottom of the script. ( Commented out )
█ CONCEPTS
This library revolves around two fundamental types:
• Point: Represents a point in 2D space with x and y coordinates, along with optional 'a' (angle) and 'v' (value) fields for versatile use. Crucially, for plotting, utilize the `.to_chart_point()` method to convert Points into plottable chart.point objects.
• Line: Defined by a starting Point and a slope , enabling calculations like getting y for a given x, or finding intersection points.
█ FEATURES
• Point Manipulation: Perform operations like addition, subtraction, scaling, rotation, normalization, calculating distances, dot products, cross products, midpoints, and more with Point objects.
• Line Operations: Create lines, determine their slope, calculate y from x (and vice versa), and find the intersection points of two lines.
• Vector Operations: Perform vector addition, subtraction, multiplication, division, negation, perpendicular vector calculation, floor, fractional part, sine, absolute value, modulus, sign, round, scaling, rescaling, rotation, and ceiling operations.
• Angle Calculations: Compute angles between points in degrees or radians, including signed, unsigned, and 360-degree angles.
• Polygon Analysis: Calculate the area, perimeter, and centroid of polygons. Check if a point is inside a given polygon and determine the convex hull perimeter.
• Chart Plotting: Conveniently convert Point objects to chart.point objects for plotting lines and points on the chart. The library also includes functions for plotting lines between individual and series of points.
• Utility Functions: Includes helper functions such as square root, square, cosine, sine, tangent, arc cosine, arc sine, arc tangent, atan2, absolute distance, golden ratio tolerance check, fractional part, and safe index/check for chart plotting boundaries.
█ HOW TO USE
1 — Include the library in your script using:
import kaigouthro/geo/1
2 — Create Point and Line objects:
p1 = geo.Point(bar_index, close)
p2 = geo.Point(bar_index , open)
myLine = geo.Line(p1, geo.slope(p1, p2))
// maybe use that line to detect a crossing for an alert ... hmmm
3 — Utilize the provided functions:
distance = geo.distance(p1, p2)
intersection = geo.intersection(line1, line2)
4 — For plotting labels, lines, convert Point to chart.point :
label.new(p1.to_chart_point(), " Hi ")
line.new(p1.to_chart_point(),p2.to_chart_point())
█ NOTES
This description provides a concise overview. Consult the library's source code for in-depth documentation, including detailed descriptions, parameter types, and return values for each function and method. The source code is structured with comprehensive comments using the `//@` format for seamless integration with TradingView's auto-documentation features.
█ Possibilities..
Library "geo"
This library provides a comprehensive set of geometric functions and types, including point and line manipulation, vector operations, angle calculations, and polygon analysis. It offers tools for creating, transforming, and analyzing geometric shapes and their relationships.
sqrt(value)
Square root function
Parameters:
value (float) : (float) - The number to take the square root of
Returns: (float) - The square root of the input value
sqr(x)
Square function
Parameters:
x (float) : (float) - The number to square
Returns: (float) - The square of the input value
cos(v)
Cosine function
Parameters:
v (float) : (series float) - The value to find the cosine of
Returns: (series float) - The cosine of the input value
sin(v)
Sine function
Parameters:
v (float) : (series float) - The value to find the sine of
Returns: (series float) - The sine of the input value
tan(v)
Tangent function
Parameters:
v (float) : (series float) - The value to find the tangent of
Returns: (series float) - The tangent of the input value
acos(v)
Arc cosine function
Parameters:
v (float) : (series float) - The value to find the arc cosine of
Returns: (series float) - The arc cosine of the input value
asin(v)
Arc sine function
Parameters:
v (float) : (series float) - The value to find the arc sine of
Returns: (series float) - The arc sine of the input value
atan(v)
Arc tangent function
Parameters:
v (float) : (series float) - The value to find the arc tangent of
Returns: (series float) - The arc tangent of the input value
atan2(dy, dx)
atan2 function
Parameters:
dy (float) : (float) - The y-coordinate
dx (float) : (float) - The x-coordinate
Returns: (float) - The angle in radians
gap(_value1, __value2)
Absolute distance between any two float values
Parameters:
_value1 (float) : First value
__value2 (float)
Returns: Absolute Positive Distance
phi_tol(a, b, tolerance)
Check if the ratio is within the tolerance of the golden ratio
Parameters:
a (float) : (float) The first number
b (float) : (float) The second number
tolerance (float) : (float) The tolerance percennt as 1 = 1 percent
Returns: (bool) True if the ratio is within the tolerance, false otherwise
frac(x)
frad Fractional
Parameters:
x (float) : (float) - The number to convert to fractional
Returns: (float) - The number converted to fractional
safeindex(x, limit)
limiting int to hold the value within the chart range
Parameters:
x (float) : (float) - The number to limit
limit (int)
Returns: (int) - The number limited to the chart range
safecheck(x, limit)
limiting int check if within the chartplottable range
Parameters:
x (float) : (float) - The number to limit
limit (int)
Returns: (int) - The number limited to the chart range
interpolate(a, b, t)
interpolate between two values
Parameters:
a (float) : (float) - The first value
b (float) : (float) - The second value
t (float) : (float) - The interpolation factor (0 to 1)
Returns: (float) - The interpolated value
gcd(_numerator, _denominator)
Greatest common divisor of two integers
Parameters:
_numerator (int)
_denominator (int)
Returns: (int) The greatest common divisor
method set_x(self, value)
Set the x value of the point, and pass point for chaining
Namespace types: Point
Parameters:
self (Point) : (Point) The point to modify
value (float) : (float) The new x-coordinate
method set_y(self, value)
Set the y value of the point, and pass point for chaining
Namespace types: Point
Parameters:
self (Point) : (Point) The point to modify
value (float) : (float) The new y-coordinate
method get_x(self)
Get the x value of the point
Namespace types: Point
Parameters:
self (Point) : (Point) The point to get the x-coordinate from
Returns: (float) The x-coordinate
method get_y(self)
Get the y value of the point
Namespace types: Point
Parameters:
self (Point) : (Point) The point to get the y-coordinate from
Returns: (float) The y-coordinate
method vmin(self)
Lowest element of the point
Namespace types: Point
Parameters:
self (Point) : (Point) The point
Returns: (float) The lowest value between x and y
method vmax(self)
Highest element of the point
Namespace types: Point
Parameters:
self (Point) : (Point) The point
Returns: (float) The highest value between x and y
method add(p1, p2)
Addition
Namespace types: Point
Parameters:
p1 (Point) : (Point) - The first point
p2 (Point) : (Point) - The second point
Returns: (Point) - the add of the two points
method sub(p1, p2)
Subtraction
Namespace types: Point
Parameters:
p1 (Point) : (Point) - The first point
p2 (Point) : (Point) - The second point
Returns: (Point) - the sub of the two points
method mul(p, scalar)
Multiplication by scalar
Namespace types: Point
Parameters:
p (Point) : (Point) - The point
scalar (float) : (float) - The scalar to multiply by
Returns: (Point) - the multiplied point of the point and the scalar
method div(p, scalar)
Division by scalar
Namespace types: Point
Parameters:
p (Point) : (Point) - The point
scalar (float) : (float) - The scalar to divide by
Returns: (Point) - the divided point of the point and the scalar
method rotate(p, angle)
Rotate a point around the origin by an angle (in degrees)
Namespace types: Point
Parameters:
p (Point) : (Point) - The point to rotate
angle (float) : (float) - The angle to rotate by in degrees
Returns: (Point) - the rotated point
method length(p)
Length of the vector from origin to the point
Namespace types: Point
Parameters:
p (Point) : (Point) - The point
Returns: (float) - the length of the point
method length_squared(p)
Length squared of the vector
Namespace types: Point
Parameters:
p (Point) : (Point) The point
Returns: (float) The squared length of the point
method normalize(p)
Normalize the point to a unit vector
Namespace types: Point
Parameters:
p (Point) : (Point) - The point to normalize
Returns: (Point) - the normalized point
method dot(p1, p2)
Dot product
Namespace types: Point
Parameters:
p1 (Point) : (Point) - The first point
p2 (Point) : (Point) - The second point
Returns: (float) - the dot of the two points
method cross(p1, p2)
Cross product result (in 2D, this is a scalar)
Namespace types: Point
Parameters:
p1 (Point) : (Point) - The first point
p2 (Point) : (Point) - The second point
Returns: (float) - the cross of the two points
method distance(p1, p2)
Distance between two points
Namespace types: Point
Parameters:
p1 (Point) : (Point) - The first point
p2 (Point) : (Point) - The second point
Returns: (float) - the distance of the two points
method Point(x, y, a, v)
Point Create Convenience
Namespace types: series float, simple float, input float, const float
Parameters:
x (float)
y (float)
a (float)
v (float)
Returns: (Point) new point
method angle(p1, p2)
Angle between two points in degrees
Namespace types: Point
Parameters:
p1 (Point) : (Point) - The first point
p2 (Point) : (Point) - The second point
Returns: (float) - the angle of the first point and the second point
method angle_between(p, pivot, other)
Angle between two points in degrees from a pivot point
Namespace types: Point
Parameters:
p (Point) : (Point) - The point to calculate the angle from
pivot (Point) : (Point) - The pivot point
other (Point) : (Point) - The other point
Returns: (float) - the angle between the two points
method translate(p, from_origin, to_origin)
Translate a point from one origin to another
Namespace types: Point
Parameters:
p (Point) : (Point) - The point to translate
from_origin (Point) : (Point) - The origin to translate from
to_origin (Point) : (Point) - The origin to translate to
Returns: (Point) - the translated point
method midpoint(p1, p2)
Midpoint of two points
Namespace types: Point
Parameters:
p1 (Point) : (Point) - The first point
p2 (Point) : (Point) - The second point
Returns: (Point) - The midpoint of the two points
method rotate_around(p, angle, pivot)
Rotate a point around a pivot point by an angle (in degrees)
Namespace types: Point
Parameters:
p (Point) : (Point) - The point to rotate
angle (float) : (float) - The angle to rotate by in degrees
pivot (Point) : (Point) - The pivot point to rotate around
Returns: (Point) - the rotated point
method multiply(_a, _b)
Multiply vector _a with _b
Namespace types: Point
Parameters:
_a (Point) : (Point) The first point
_b (Point) : (Point) The second point
Returns: (Point) The result of the multiplication
method divide(_a, _b)
Divide vector _a by _b
Namespace types: Point
Parameters:
_a (Point) : (Point) The first point
_b (Point) : (Point) The second point
Returns: (Point) The result of the division
method negate(_a)
Negative of vector _a
Namespace types: Point
Parameters:
_a (Point) : (Point) The point to negate
Returns: (Point) The negated point
method perp(_a)
Perpendicular Vector of _a
Namespace types: Point
Parameters:
_a (Point) : (Point) The point
Returns: (Point) The perpendicular point
method vfloor(_a)
Compute the floor of argument vector _a
Namespace types: Point
Parameters:
_a (Point) : (Point) The point
Returns: (Point) The floor of the point
method fractional(_a)
Compute the fractional part of the elements from vector _a
Namespace types: Point
Parameters:
_a (Point) : (Point) The point
Returns: (Point) The fractional part of the point
method vsin(_a)
Compute the sine of argument vector _a
Namespace types: Point
Parameters:
_a (Point) : (Point) The point
Returns: (Point) The sine of the point
lcm(a, b)
Least common multiple of two integers
Parameters:
a (int) : (int) The first integer
b (int) : (int) The second integer
Returns: (int) The least common multiple
method vabs(_a)
Compute the absolute of argument vector _a
Namespace types: Point
Parameters:
_a (Point) : (Point) The point
Returns: (Point) The absolute of the point
method vmod(_a, _b)
Compute the mod of argument vector _a
Namespace types: Point
Parameters:
_a (Point) : (Point) The point
_b (float) : (float) The mod
Returns: (Point) The mod of the point
method vsign(_a)
Compute the sign of argument vector _a
Namespace types: Point
Parameters:
_a (Point) : (Point) The point
Returns: (Point) The sign of the point
method vround(_a)
Compute the round of argument vector _a
Namespace types: Point
Parameters:
_a (Point) : (Point) The point
Returns: (Point) The round of the point
method normalize_y(p, height)
normalizes the y value of a point to an input height
Namespace types: Point
Parameters:
p (Point) : (Point) - The point to normalize
height (float) : (float) - The height to normalize to
Returns: (Point) - the normalized point
centroid(points)
Calculate the centroid of multiple points
Parameters:
points (array) : (array) The array of points
Returns: (Point) The centroid point
random_point(_height, _width, _origin, _centered)
Random Point in a given height and width
Parameters:
_height (float) : (float) The height of the area to generate the point in
_width (float) : (float) The width of the area to generate the point in
_origin (Point) : (Point) The origin of the area to generate the point in (default: na, will create a Point(0, 0))
_centered (bool) : (bool) Center the origin point in the area, otherwise, positive h/w (default: false)
Returns: (Point) The random point in the given area
random_point_array(_origin, _height, _width, _centered, _count)
Random Point Array in a given height and width
Parameters:
_origin (Point) : (Point) The origin of the area to generate the array (default: na, will create a Point(0, 0))
_height (float) : (float) The height of the area to generate the array
_width (float) : (float) The width of the area to generate the array
_centered (bool) : (bool) Center the origin point in the area, otherwise, positive h/w (default: false)
_count (int) : (int) The number of points to generate (default: 50)
Returns: (array) The random point array in the given area
method sort_points(points, by_x)
Sorts an array of points by x or y coordinate
Namespace types: array
Parameters:
points (array) : (array) The array of points to sort
by_x (bool) : (bool) Whether to sort by x-coordinate (true) or y-coordinate (false)
Returns: (array) The sorted array of points
method equals(_a, _b)
Compares two points for equality
Namespace types: Point
Parameters:
_a (Point) : (Point) The first point
_b (Point) : (Point) The second point
Returns: (bool) True if the points are equal, false otherwise
method max(origin, _a, _b)
Maximum of two points from origin, using dot product
Namespace types: Point
Parameters:
origin (Point)
_a (Point) : (Point) The first point
_b (Point) : (Point) The second point
Returns: (Point) The maximum point
method min(origin, _a, _b)
Minimum of two points from origin, using dot product
Namespace types: Point
Parameters:
origin (Point)
_a (Point) : (Point) The first point
_b (Point) : (Point) The second point
Returns: (Point) The minimum point
method avg_x(points)
Average x of point array
Namespace types: array
Parameters:
points (array) : (array) The array of points
Returns: (float) The average x-coordinate
method avg_y(points)
Average y of point array
Namespace types: array
Parameters:
points (array) : (array) The array of points
Returns: (float) The average y-coordinate
method range_x(points)
Range of x values in point array
Namespace types: array
Parameters:
points (array) : (array) The array of points
Returns: (float) The range of x-coordinates
method range_y(points)
Range of y values in point array
Namespace types: array
Parameters:
points (array) : (array) The array of points
Returns: (float) The range of y-coordinates
method max_x(points)
max of x values in point array
Namespace types: array
Parameters:
points (array) : (array) The array of points
Returns: (float) The max of x-coordinates
method min_y(points)
min of x values in point array
Namespace types: array
Parameters:
points (array) : (array) The array of points
Returns: (float) The min of x-coordinates
method scale(_a, _scalar)
Scale a point by a scalar
Namespace types: Point
Parameters:
_a (Point) : (Point) The point to scale
_scalar (float) : (float) The scalar value
Returns: (Point) The scaled point
method rescale(_a, _length)
Rescale a point to a new magnitude
Namespace types: Point
Parameters:
_a (Point) : (Point) The point to rescale
_length (float) : (float) The new magnitude
Returns: (Point) The rescaled point
method rotate_rad(_a, _radians)
Rotate a point by an angle in radians
Namespace types: Point
Parameters:
_a (Point) : (Point) The point to rotate
_radians (float) : (float) The angle in radians
Returns: (Point) The rotated point
method rotate_degree(_a, _degree)
Rotate a point by an angle in degrees
Namespace types: Point
Parameters:
_a (Point) : (Point) The point to rotate
_degree (float) : (float) The angle in degrees
Returns: (Point) The rotated point
method vceil(_a, _digits)
Ceil a point to a certain number of digits
Namespace types: Point
Parameters:
_a (Point) : (Point) The point to ceil
_digits (int) : (int) The number of digits to ceil to
Returns: (Point) The ceiled point
method vpow(_a, _exponent)
Raise both point elements to a power
Namespace types: Point
Parameters:
_a (Point) : (Point) The point
_exponent (float) : (float) The exponent
Returns: (Point) The point with elements raised to the power
method perpendicular_distance(_a, _b, _c)
Distance from point _a to line between _b and _c
Namespace types: Point
Parameters:
_a (Point) : (Point) The point
_b (Point) : (Point) The start point of the line
_c (Point) : (Point) The end point of the line
Returns: (float) The perpendicular distance
method project(_a, _axis)
Project a point onto another
Namespace types: Point
Parameters:
_a (Point) : (Point) The point to project
_axis (Point) : (Point) The point to project onto
Returns: (Point) The projected point
method projectN(_a, _axis)
Project a point onto a point of unit length
Namespace types: Point
Parameters:
_a (Point) : (Point) The point to project
_axis (Point) : (Point) The unit length point to project onto
Returns: (Point) The projected point
method reflect(_a, _axis)
Reflect a point on another
Namespace types: Point
Parameters:
_a (Point) : (Point) The point to reflect
_axis (Point) : (Point) The point to reflect on
Returns: (Point) The reflected point
method reflectN(_a, _axis)
Reflect a point to an arbitrary axis
Namespace types: Point
Parameters:
_a (Point) : (Point) The point to reflect
_axis (Point) : (Point) The axis to reflect to
Returns: (Point) The reflected point
method angle_rad(_a)
Angle in radians of a point
Namespace types: Point
Parameters:
_a (Point) : (Point) The point
Returns: (float) The angle in radians
method angle_unsigned(_a, _b)
Unsigned degree angle between 0 and +180 by given two points
Namespace types: Point
Parameters:
_a (Point) : (Point) The first point
_b (Point) : (Point) The second point
Returns: (float) The unsigned angle in degrees
method angle_signed(_a, _b)
Signed degree angle between -180 and +180 by given two points
Namespace types: Point
Parameters:
_a (Point) : (Point) The first point
_b (Point) : (Point) The second point
Returns: (float) The signed angle in degrees
method angle_360(_a, _b)
Degree angle between 0 and 360 by given two points
Namespace types: Point
Parameters:
_a (Point) : (Point) The first point
_b (Point) : (Point) The second point
Returns: (float) The angle in degrees (0-360)
method clamp(_a, _vmin, _vmax)
Restricts a point between a min and max value
Namespace types: Point
Parameters:
_a (Point) : (Point) The point to restrict
_vmin (Point) : (Point) The minimum point
_vmax (Point) : (Point) The maximum point
Returns: (Point) The restricted point
method lerp(_a, _b, _rate_of_move)
Linearly interpolates between points a and b by _rate_of_move
Namespace types: Point
Parameters:
_a (Point) : (Point) The starting point
_b (Point) : (Point) The ending point
_rate_of_move (float) : (float) The rate of movement (0-1)
Returns: (Point) The interpolated point
method slope(p1, p2)
Slope of a line between two points
Namespace types: Point
Parameters:
p1 (Point) : (Point) - The first point
p2 (Point) : (Point) - The second point
Returns: (float) - The slope of the line
method gety(self, x)
Get y-coordinate of a point on the line given its x-coordinate
Namespace types: Line
Parameters:
self (Line) : (Line) - The line
x (float) : (float) - The x-coordinate
Returns: (float) - The y-coordinate
method getx(self, y)
Get x-coordinate of a point on the line given its y-coordinate
Namespace types: Line
Parameters:
self (Line) : (Line) - The line
y (float) : (float) - The y-coordinate
Returns: (float) - The x-coordinate
method intersection(self, other)
Intersection point of two lines
Namespace types: Line
Parameters:
self (Line) : (Line) - The first line
other (Line) : (Line) - The second line
Returns: (Point) - The intersection point
method calculate_arc_point(self, b, p3)
Calculate a point on the arc defined by three points
Namespace types: Point
Parameters:
self (Point) : (Point) The starting point of the arc
b (Point) : (Point) The middle point of the arc
p3 (Point) : (Point) The end point of the arc
Returns: (Point) A point on the arc
approximate_center(point1, point2, point3)
Approximate the center of a spiral using three points
Parameters:
point1 (Point) : (Point) The first point
point2 (Point) : (Point) The second point
point3 (Point) : (Point) The third point
Returns: (Point) The approximate center point
createEdge(center, radius, angle)
Get coordinate from center by radius and angle
Parameters:
center (Point) : (Point) - The center point
radius (float) : (float) - The radius of the circle
angle (float) : (float) - The angle in degrees
Returns: (Point) - The coordinate on the circle
getGrowthFactor(p1, p2, p3)
Get growth factor of spiral point
Parameters:
p1 (Point) : (Point) - The first point
p2 (Point) : (Point) - The second point
p3 (Point) : (Point) - The third point
Returns: (float) - The growth factor
method to_chart_point(point)
Convert Point to chart.point using chart.point.from_index(safeindex(point.x), point.y)
Namespace types: Point
Parameters:
point (Point) : (Point) - The point to convert
Returns: (chart.point) - The chart.point representation of the input point
method plotline(p1, p2, col, width)
Draw a line from p1 to p2
Namespace types: Point
Parameters:
p1 (Point) : (Point) First point
p2 (Point) : (Point) Second point
col (color)
width (int)
Returns: (line) Line object
method drawlines(points, col, ignore_boundary)
Draw lines between points in an array
Namespace types: array
Parameters:
points (array) : (array) The array of points
col (color) : (color) The color of the lines
ignore_boundary (bool) : (bool) The color of the lines
method to_chart_points(points)
Draw an array of points as chart points on the chart with line.new(chartpoint1, chartpoint2, color=linecolor)
Namespace types: array
Parameters:
points (array) : (array) - The points to draw
Returns: (array) The array of chart points
polygon_area(points)
Calculate the area of a polygon defined by an array of points
Parameters:
points (array) : (array) The array of points representing the polygon vertices
Returns: (float) The area of the polygon
polygon_perimeter(points)
Calculate the perimeter of a polygon
Parameters:
points (array) : (array) Array of points defining the polygon
Returns: (float) Perimeter of the polygon
is_point_in_polygon(point, _polygon)
Check if a point is inside a polygon
Parameters:
point (Point) : (Point) The point to check
_polygon (array)
Returns: (bool) True if the point is inside the polygon, false otherwise
method perimeter(points)
Calculates the convex hull perimeter of a set of points
Namespace types: array
Parameters:
points (array) : (array) The array of points
Returns: (array) The array of points forming the convex hull perimeter
Point
A Point, can be used for vector, floating calcs, etc. Use the cp method for plots
Fields:
x (series float) : (float) The x-coordinate
y (series float) : (float) The y-coordinate
a (series float) : (float) An Angle storage spot
v (series float) : (float) A Value
Line
Line
Fields:
point (Point) : (Point) The starting point of the line
slope (series float) : (float) The slope of the line
GOMTRY.

KwakPineHelperLibrary "KwakPineHelper"
TODO: add library description here
fun(x)
TODO: add function description here
Parameters:
x (float) : TODO: add parameter x description here
Returns: TODO: add what function returns
all_opentrades_size()
get all opentrades size
Returns: (float) size
recent_opentrade_profit()
get recent opentrade profit
Returns: (float) profit
all_opentrades_profit()
get all opentrades profit
Returns: (float) profit
recent_closedtrade_profit()
get recent closedtrade profit
Returns: (float) profit
recent_opentrade_max_runup()
get recent opentrade max runup
Returns: (float) runup
recent_closedtrade_max_runup()
get recent closedtrade max runup
Returns: (float) runup
recent_opentrade_max_drawdown()
get recent opentrade maxdrawdown
Returns: (float) mdd
recent_closedtrade_max_drawdown()
get recent closedtrade maxdrawdown
Returns: (float) mdd
max_open_trades_drawdown()
get max open trades drawdown
Returns: (float) mdd
recent_opentrade_commission()
get recent opentrade commission
Returns: (float) commission
recent_closedtrade_commission()
get recent closedtrade commission
Returns: (float) commission
qty_by_percent_of_equity(percent)
get qty by percent of equtiy
Parameters:
percent (float) : (series float) percent that you want to set
Returns: (float) quantity
qty_by_percent_of_position_size(percent)
get size by percent of position size
Parameters:
percent (float) : (series float) percent that you want to set
Returns: (float) size
is_day_change()
get bool change of day
Returns: (bool) day is change or not
is_in_trade(numberOfBars)
get bool using number of bars
Parameters:
numberOfBars (int)
Returns: (bool) allowedToTrade
api_msg_system(chat_id, message)
Parameters:
chat_id (string)
message (string)
is_first_day()
Check if today is the first day
Returns: (bool) true if today is the first day, false otherwise
is_last_day()
Check if today is the last day
Returns: (bool) true if today is the last day, false otherwise
is_entry()
Check if trade is open
Returns: (bool) true if trade is open, false otherwise
is_close()
Check if trade is closed
Returns: (bool) true if trade is closed, false otherwise
is_win()
Check if trade is win
Returns: (bool) true if trade is win, false otherwise
is_loss()
Check if trade is loss
Returns: (bool) true if trade is loss, false otherwise
FibRatiosLibrary "FibRatios"
Library with calculation logic for fib retracement, extension and ratios
retracement(a, b, ratio, logScale, precision)
Calculates the retracement for points a, b with given ratio and scale
Parameters:
a (float) : Starting point a
b (float) : Second point b
ratio (float) : Ratio for which we need to calculate retracement c
logScale (bool) : Flag to get calculations in log scale. Default is false
precision (int) : rounding precision. If set to netagive number, round_to_mintick is applied. Default is -1
Returns: retracement point c for points a,b with given ratio and scale
retracementRatio(a, b, c, logScale, precision)
Calculates the retracement ratio for points a, b, c with given scale
Parameters:
a (float) : Starting point a
b (float) : Second point b
c (float) : Retracement point. c should be placed between a and b
logScale (bool) : Flag to get calculations in log scale. Default is false
precision (int) : rounding precision. If set to netagive number, round_to_mintick is applied. Default is 3
Returns: retracement ratio for points a,b,c on given scale
extension(a, b, c, ratio, logScale, precision)
Calculates the extensions for points a, b, c with given ratio and scale
Parameters:
a (float) : Starting point a
b (float) : Second point b
c (float) : Retracement point. c should be placed between a and b
ratio (float) : Ratio for which we need to calculate extension d
logScale (bool) : Flag to get calculations in log scale. Default is false
precision (int) : rounding precision. If set to netagive number, round_to_mintick is applied. Default is -1
Returns: extensoin point d for points a,b,c with given ratio and scale
extensionRatio(a, b, c, d, logScale, precision)
Calculates the extension ratio for points a, b, c, d with given scale
Parameters:
a (float) : Starting point a
b (float) : Second point b
c (float) : Retracement point. c should be placed between a and b
d (float) : Extension point. d should be placed beyond a, c. But, can be with b,c or beyond b
logScale (bool) : Flag to get calculations in log scale. Default is false
precision (int) : rounding precision. If set to netagive number, round_to_mintick is applied. Default is 3
Returns: extension ratio for points a,b,c,d on given scale

lib_setLibrary "lib_set"
This is a convenience lib that bundles different setter functions allowing to update all coordinates and of line/box in one call, and coordinates and text for label.
method set_xy_text(this, x, y, txt, tooltip)
Updates a label object with new data (equals redrawing it)
Namespace types: series label
Parameters:
this (label)
x (int) : reassigns the x coordinate, optional param, no effect if x = na (same as draw(extend_only = true) for Line objects). Avoiding to reassign x can prevent errors for invalid params passed to set_x***
y (float) : reassigns the y coordinate
txt (string) : reassigns the label text
tooltip (string) : reassigns the label tooltip
method set_xy1_xy2(this, x1, y1, x2, y2)
Updates a line object with new data (equals redrawing it)
Namespace types: series line
Parameters:
this (line)
x1 (int) : reassigns the x1 coordinate, optional param, no effect if x1 = na (same as draw(extend_only = true) for Line objects). Avoiding to reassign x1 can prevent errors for invalid params passed to set_x***
y1 (float) : reassigns the y1 coordinate
x2 (int) : reassigns the x2 coordinate
y2 (float) : reassigns the y2 coordinate
method set_left_top_right_bottom(this, left, top, right, bottom)
Updates a box object with new data (equals redrawing it)
Namespace types: series box
Parameters:
this (box)
left (int) : reassigns the left coordinate, optional param, no effect if left = na (same as draw(extend_only = true) for Box objects). Avoiding to reassign 'left' can prevent errors for invalid params passed to set_x***
top (float) : reassigns the top coordinate
right (int) : reassigns the right coordinate
bottom (float) : reassigns the bottom coordinate
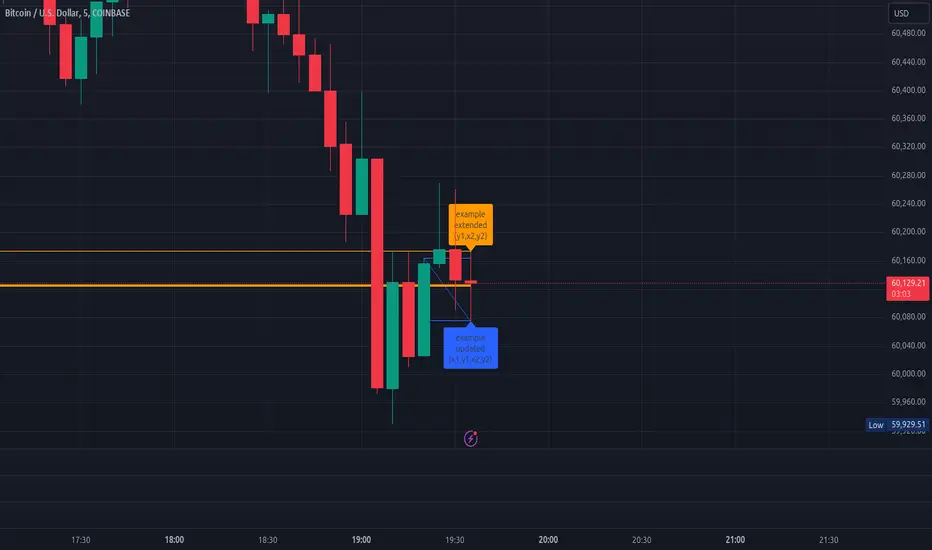
WavesLibrary "Waves"
Methods for elliot wave detection
method delete(this)
deletes the subwave drawing
Namespace types: Subwave
Parameters:
this (Subwave) : Subwave object to be deleted
Returns: deleted subwave object
method delete(this)
deletes the wave drawing and the corresponding subwaves
Namespace types: Wave
Parameters:
this (Wave) : Wave object to be deleted
Returns: deleted wave object
method createWave(pivot, lineColor, waves, limit)
Create wave object
Namespace types: zg.Pivot
Parameters:
pivot (Pivot type from Trendoscope/Zigzag/7) : pivot object where the wave needs to be created
lineColor (color) : color of the wave to be drawn
waves (array) : array of existing waves
limit (int) : max number of waves to be shown in the chart
Returns: wave object created
method createSubWaves(wave, subwavePivots)
Create sub waves for the wave
Namespace types: Wave
Parameters:
wave (Wave)
subwavePivots (array) : array of sub wave pivots
Returns: wave object created
method draw(subWave)
Draw subwave
Namespace types: Subwave
Parameters:
subWave (Subwave)
Returns: subwsubWave object
method draw(wave, limitSubwaves)
Draw Wave
Namespace types: Wave
Parameters:
wave (Wave) : Wave object to be drawn
limitSubwaves (bool) : limit the number of subwave combinations within the wave
Returns: wave object
method checkMotiveWave(prices)
based on the price array, check if there is motive wave and identify the type
Namespace types: array
Parameters:
prices (array) : float array of prices
Returns: WaveType representing the identified wave type. na otherwise
method scanMotiveWave(pivot, lastPivot, existingWaves, allowedTypes)
Scan for motive wave
Namespace types: zg.Pivot
Parameters:
pivot (Pivot type from Trendoscope/Zigzag/7) : Zigzag pivot that will be checked for motive wave
lastPivot (Pivot type from Trendoscope/Zigzag/7) : previous Zigzag pivot
existingWaves (array) : array of existing waves
allowedTypes (array) : allowed Wave types to filter them
Returns: array of subwave pivots
SubwavePivots
SubwavePivots represents the sub pivots of the main wave
Fields:
waveType (series WaveType) : Type of the Wave
indices (array) : Bar index values of sub waves
subPivots (array type from Trendoscope/Zigzag/7) : sub pivot objects of the wave
Subwave
Subwave represents the drawing of sub waves
Fields:
waves (array type from Trendoscope/Drawing/1) : array of sub wave lines
points (array type from Trendoscope/Drawing/1) : Array of subwave pivot labels
subwavePivots (SubwavePivots) : array of subwave pivots being drawn
Wave
Wave object type
Fields:
pivot (Pivot type from Trendoscope/Zigzag/7) : starting point of the wave
wave (Line type from Trendoscope/Drawing/1) : Line representing the wave
waveLabel (Label type from Trendoscope/Drawing/1) : label containing wave details
subWaves (array) : array of sub waves