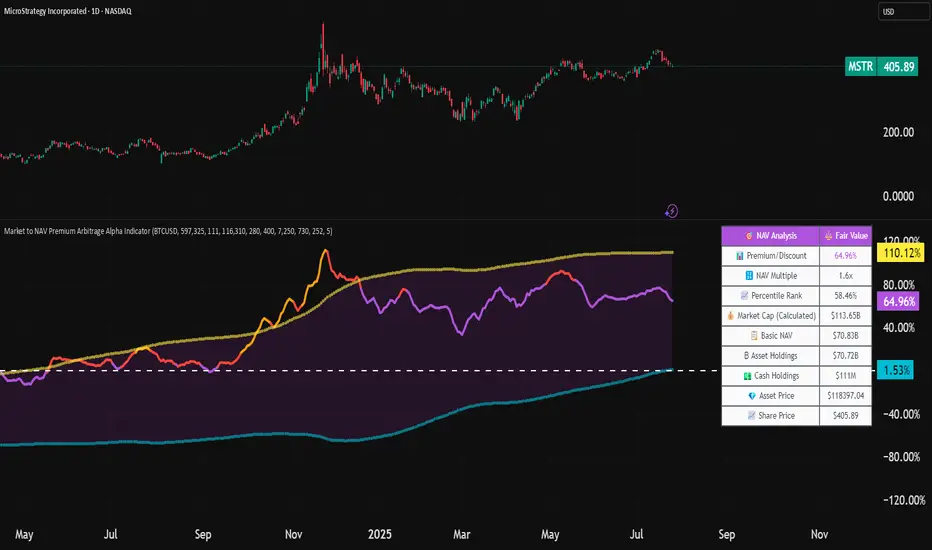
Market to NAV Premium Arbitrage Alpha IndicatorBitcoin treasury companies such as Microstrategy are known for trading at significant premiums. but how big exactly is the premium? And how can we measure it in real time?
I developed this quantitative tool to identify statistical mispricings between market capitalization and net asset value (NAV), specifically designed for arbitrage strategies and alpha generation in Bitcoin-holding companies, such as MicroStrategy or Sharplink Gaming, or SPACs used primarily to hold cryptocurrencies, Bitcoin ETFs, and other NAV-based instruments. It can probably also be used in certain spin-offs.
KEY FEATURES:
✅ Real-time Premium/Discount Calculation
• Automatically retrieves market cap data from TradingView
• Calculates precise NAV based on underlying asset holdings (for example Bitcoin)
• Formula: (Market Cap - NAV) / NAV × 100
✅ Statistical Analysis
• Historical percentile rankings (customizable lookback period)
• Standard deviation bands (2σ) for extreme value detection (close to these values might be seen as interesting points to short or go long)
• Smoothing period to reduce noise
✅ Multi-Source Market Cap Detection
• You can add the ticker of the NAV asset, but if necessary, you can also put it manually. Priority system: TradingView data → Calculated → Manual override
✅ Advanced NAV Modeling
• Basic NAV: Asset holdings + cash.
• Adjusted NAV: Includes software business value, debt, preferred shares. If the company has a lot of this kind of intrinsic value, put it in the "cash" field
• Support for any underlying asset (BTC, ETH, etc.)
TRADING APPLICATIONS:
🎯 Pairs Trading Signals
• Long/Short opportunities when premium reaches statistical extremes
• Mean reversion strategies based on historical ranges
• Risk-adjusted position sizing using percentile ranks
🎯 Arbitrage Detection
• Identifies when market pricing significantly deviates from fair value
• Quantifies the magnitude of mispricing for profit potential
• Historical context for timing entry/exit points
CONFIGURATION OPTIONS:
• Underlying Asset: Any symbol (default: COINBASE:BTCUSD) NEEDS MANUAL INPUT
• Asset Quantity: Precise holdings amount (for example, how much BTC does the company currently hold). NEEDS MANUAL INPUT
• Cash Holdings: Additional liquid assets. NEEDS MANUAL INPUT
• Market Cap Mode: Auto-detect, calculated, or manual
• Advanced Adjustments: Business value, debt, preferred shares
• Display Settings: Lookback period, smoothing, custom colors
IT CAN BE USED BY:
• Quantitative traders focused on statistical arbitrage
• Institutional investors monitoring NAV-based instruments
• Bitcoin ETF and MSTR traders seeking alpha generation
• Risk managers tracking premium/discount exposures
• Academic researchers studying market efficiency (as you can see, markets are not efficient 😉)
Microstrategy
Moving Liquidation PreferenceVersion 0.1
The indicator provides an indication of the "Moving Liquidation Preference" for Strategy's ( NASDAQ:MSTR ) preferred equities ( NASDAQ:STRK , NASDAQ:STRF , NASDAQ:STRF ). The author attempts to accurately recreate the values based on information available in SEC disclosures and using public stock trading data. Since these are open to interpretation and the data may not be the golden truth for determining the liquidation preference, the author explicitly indicates that the information provided by this indicator is non-indicative and not meant to supersede information provided by Strategy directly. It is meant for entertainment purposes only, not for use in financial decision making.
The author has made every attempt to be as accurate as possible, but mistakes invariably occur and should be reported to the author if discovered.
The script will be updated as new preferred stock is issued via ATM or other sales for as long as the author is willing and able to do so.
Why is the script private?
This script includes data on the issuance of Strategy preferred equity ( NASDAQ:STRK , NASDAQ:STRF , NASDAQ:STRF ) that was manually determined by the author after going through countless hours of SEC disclosures. Since there is no publicly available repository for this information and the author would like to retain the right to make this available at a later date, the script is kept private. In addition, the data may be faulty and should not be relied upon for financial decision making. This indicator is not financial advise, nor does it purport to replace professional guidance. Use at your own risk!

MSTR mNAV IndicatorStrategy mNAV Indicator
Script contains hard-coded historic share counts and BTC holdings of Strategy Inc. ( NASDAQ:MSTR ). Using these, we derived the Bitcoin mNAV multiple for the company. The formula used in this script looks like the following:
mNAV = (Fully Diluted Shares Outstanding * NASDAQ:MSTR ) / (BTC holdings * BITSTAMP:BTCUSD )
This value appears in the Blue tag at the right hand side of the chart on the latest bar. In addition, the script displays mNAV layers below and above the normal ticker chart. These are computed by taking fixing a value for the mNAV (e.g. mNAV=3) and solving the equation above for the NASDAQ:MSTR price that would equate to having that mNAV.
The user is able to configure the number of said mNAV lines to draw but is limited from mNAV = 1 up to mNAV = 20.
Why is the script private?
This script includes data on the relative count of fully diluted shares for Strategy ( NASDAQ:MSTR ) that was manually determined by the author after going through countless hours of SEC disclosures. Since there is no publicly available repository for this information and the author would like to retain the right to make this available at a later date, the script is kept private.

Dollar Cost Averaging (DCA) | FractalystWhat's the purpose of this strategy?
The purpose of dollar cost averaging (DCA) is to grow investments over time using a disciplined, methodical approach used by many top institutions like MicroStrategy and other institutions.
Here's how it functions:
Dollar Cost Averaging (DCA): This technique involves investing a set amount of money regularly, regardless of market conditions. It helps to mitigate the risk of investing a large sum at a peak price by spreading out your investment, thus potentially lowering your average cost per share over time.
Regular Contributions: By adding money to your investments on a pre-determined frequency and dollar amount defined by the user, you take advantage of compounding. The script will remind you to contribute based on your chosen schedule, which can be weekly, bi-weekly, monthly, quarterly, or yearly. This systematic approach ensures that your returns can earn their own returns, much like interest on savings but potentially at a higher rate.
Technical Analysis: The strategy employs a market trend ratio to gauge market sentiment. It calculates the ratio of bullish vs bearish breakouts across various timeframes, assigning this ratio a percentage-based score to determine the directional bias. Once this score exceeds a user-selected percentage, the strategy looks to take buy entries, signaling a favorable time for investment based on current market trends.
Fundamental Analysis: This aspect looks at the health of the economy and companies within it to determine bullish market conditions. Specifically, we consider:
Specifically, it considers:
Interest Rate: High interest rates can affect borrowing costs, potentially slowing down economic growth or making stocks less attractive compared to fixed income.
Inflation Rate: Inflation erodes purchasing power, but moderate inflation can be a sign of a healthy economy. We look for investments that might benefit from or withstand inflation.
GDP Rate: GDP growth indicates the overall health of the economy; we aim to invest in sectors poised to grow with the economy.
Unemployment Rate: Lower unemployment typically signals consumer confidence and spending power, which can boost certain sectors.
By integrating these elements, the strategy aims to:
Reduce Investment Volatility: By spreading out your investments, you're less impacted by short-term market swings.
Enhance Growth Potential: Using both technical and fundamental filters helps in choosing investments that are more likely to appreciate over time.
Manage Risk: The strategy aims to balance the risk of market timing by investing consistently and choosing assets wisely based on both economic data and market conditions.
----
What are Regular Contributions in this strategy?
Regular Contributions involve adding money to your investments on a pre-determined frequency and dollar amount defined by the user. The script will remind you to contribute based on your chosen schedule, which can be weekly, bi-weekly, monthly, quarterly, or yearly. This systematic approach ensures that your returns can earn their own returns, much like interest on savings but potentially at a higher rate.
----
How do regular contributions enhance compounding and reduce timing risk?
Enhances Compounding: Regular contributions leverage the power of compounding, where returns on investments can generate their own returns, potentially leading to exponential growth over time.
Reduces Timing Risk: By investing regularly, the strategy minimizes the risk associated with trying to time the market, spreading out the investment cost over time and potentially reducing the impact of volatility.
Automated Reminders: The script reminds users to make contributions based on their chosen schedule, ensuring consistency and discipline in investment practices, which is crucial for long-term success.
----
How does the strategy integrate technical and fundamental analysis for investors?
A: The strategy combines technical and fundamental analysis in the following manner:
Technical Analysis: It uses a market trend ratio to determine the directional bias by calculating the ratio of bullish vs bearish breakouts. Once this ratio exceeds a user-selected percentage threshold, the strategy signals to take buy entries, optimizing the timing within the given timeframe(s).
Fundamental Analysis: This aspect assesses the broader economic environment to identify sectors or assets that are likely to benefit from current economic conditions. By understanding these fundamentals, the strategy ensures investments are made in assets with strong growth potential.
This integration allows the strategy to select investments that are both technically favorable for entry and fundamentally sound, providing a comprehensive approach to investment decisions in the crypto, stock, and commodities markets.
----
How does the strategy identify market structure? What are the underlying calculations?
Q: How does the strategy identify market structure?
A: The strategy identifies market structure by utilizing an efficient logic with for loops to pinpoint the first swing candle that features a pivot of 2. This marks the beginning of the break of structure, where the market's previous trend or pattern is considered invalidated or changed.
What are the underlying calculations for identifying market structure?
A: The underlying calculations involve:
Identifying Swing Points: The strategy looks for swing highs (marked with blue Xs) and swing lows (marked with red Xs). A swing high is identified when a candle's high is higher than the highs of the candles before and after it. Conversely, a swing low is when a candle's low is lower than the lows of the candles before and after it.
Break of Structure (BOS):
Bullish BOS: This occurs when the price breaks above the swing high level of the previous structure, indicating a potential shift to a bullish trend.
Bearish BOS: This happens when the price breaks below the swing low level of the previous structure, signaling a potential shift to a bearish trend.
Structural Liquidity and Invalidation:
Structural Liquidity: After a break of structure, liquidity levels are updated to the first swing high in a bullish BOS or the first swing low in a bearish BOS.
Structural Invalidation: If the price moves back to the level of the first swing low before the bullish BOS or the first swing high before the bearish BOS, it invalidates the break of structure, suggesting a potential reversal or continuation of the previous trend.
This method provides users with a technical approach to filter market regimes, offering an advantage by minimizing the risk of overfitting to historical data, which is often a concern with traditional indicators like moving averages.
By focusing on identifying pivotal swing points and the subsequent breaks of structure, the strategy maintains a balance between sensitivity to market changes and robustness against historical data anomalies, ensuring a more adaptable and potentially more reliable market analysis tool.
What entry criteria are used in this script?
The script uses two entry models for trading decisions: BreakOut and Fractal.
Underlying Calculations:
Breakout: The script records the most recent swing high by storing it in a variable. When the price closes above this recorded level, and all other predefined conditions are satisfied, the script triggers a breakout entry. This approach is considered conservative because it waits for the price to confirm a breakout above the previous high before entering a trade. As shown in the image, as soon as the price closes above the new candle (first tick), the long entry gets taken. The stop-loss is initially set and then moved to break-even once the price moves in favor of the trade.
Fractal: This method involves identifying a swing low with a period of 2, which means it looks for a low point where the price is lower than the two candles before and after it. Once this pattern is detected, the script executes the trade. This is an aggressive approach since it doesn't wait for further price confirmation. In the image, this is represented by the 'Fractal 2' label where the script identifies and acts on the swing low pattern.
----
How does the script calculate trend score? What are the underlying calculations?
Market Trend Ratio: The script calculates the ratio of bullish to bearish breakouts. This involves:
Counting Bullish Breakouts: A bullish breakout is counted when the price breaks above a recent swing high (as identified in the strategy's market structure analysis).
Counting Bearish Breakouts: A bearish breakout is counted when the price breaks below a recent swing low.
Percentage-Based Score: This ratio is then converted into a percentage-based score:
For example, if there are 10 bullish breakouts and 5 bearish breakouts in a given timeframe, the ratio would be 10:5 or 2:1. This could be translated into a score where 66.67% (10/(10+5) * 100) represents the bullish trend strength.
The score might be calculated as (Number of Bullish Breakouts / Total Breakouts) * 100.
User-Defined Threshold: The strategy uses this score to determine when to take buy entries. If the trend score exceeds a user-defined percentage threshold, it indicates a strong enough bullish trend to justify a buy entry. For instance, if the user sets the threshold at 60%, the script would look for a buy entry when the trend score is above this level.
Timeframe Consideration: The calculations are performed across the timeframes specified by the user, ensuring the trend score reflects the market's behavior over different periods, which could be daily, weekly, or any other relevant timeframe.
This method provides a quantitative measure of market trend strength, helping to make informed decisions based on the balance between bullish and bearish market movements.
What type of stop-loss identification method are used in this strategy?
This strategy employs two types of stop-loss methods: Initial Stop-loss and Trailing Stop-Loss.
Underlying Calculations:
Initial Stop-loss:
ATR Based: The strategy uses the Average True Range (ATR) to set an initial stop-loss, which helps in accounting for market volatility without predicting price direction.
Calculation:
- First, the True Range (TR) is calculated for each period, which is the greatest of:
- Current Period High - Current Period Low
- Absolute Value of Current Period High - Previous Period Close
- Absolute Value of Current Period Low - Previous Period Close
- The ATR is then the moving average of these TR values over a specified period, typically 14 periods by default. This ATR value can be used to set the stop-loss at a distance from the entry price that reflects the current market volatility.
Swing Low Based:
For this method, the stop-loss is set based on the most recent swing low identified in the market structure analysis. This approach uses the lowest point of the recent price action as a reference for setting the stop-loss.
Trailing Stop-Loss:
The strategy uses structural liquidity and structural invalidation levels across multiple timeframes to adjust the stop-loss once the trade is profitable. This method involves:
Detecting Structural Liquidity: After a break of structure, the liquidity levels are updated to the first swing high in a bullish scenario or the first swing low in a bearish scenario. These levels serve as potential areas where the price might find support or resistance, allowing the stop-loss to trail the price movement.
Detecting Structural Invalidation: If the price returns to the level of the first swing low before a bullish break of structure or the first swing high before a bearish break of structure, it suggests the trend might be reversing or invalidating, prompting the adjustment of the stop-loss to lock in profits or minimize losses.
By using these methods, the strategy dynamically adjusts the initial stop-loss based on market volatility, helping to protect against adverse price movements while allowing for enough room for trades to develop. The ATR-based stop-loss adapts to the current market conditions by considering the volatility, ensuring that the stop-loss is not too tight during volatile periods, which could lead to premature exits, nor too loose during calm markets, which might result in larger losses. Similarly, the swing low based stop-loss provides a logical exit point if the market structure changes unfavorably.
Each market behaves differently across various timeframes, and it is essential to test different parameters and optimizations to find out which trailing stop-loss method gives you the desired results and performance. This involves backtesting the strategy with different settings for the ATR period, the distance from the swing low, and how the trailing stop-loss reacts to structural liquidity and invalidation levels.
Through this process, you can tailor the strategy to perform optimally in different market environments, ensuring that the stop-loss mechanism supports the trade's longevity while safeguarding against significant drawdowns.
What type of break-even and take profit identification methods are used in this strategy? What are the underlying calculations?
For Break-Even:
Percentage (%) Based:
Moves the initial stop-loss to the entry price when the price reaches a certain percentage above the entry.
Calculation:
Break-even level = Entry Price * (1 + Percentage / 100)
Example:
If the entry price is $100 and the break-even percentage is 5%, the break-even level is $100 * 1.05 = $105.
Risk-to-Reward (RR) Based:
Moves the initial stop-loss to the entry price when the price reaches a certain RR ratio.
Calculation:
Break-even level = Entry Price + (Initial Risk * RR Ratio)
For TP
- You can choose to set a take profit level at which your position gets fully closed.
- Similar to break-even, you can select either a percentage (%) or risk-to-reward (RR) based take profit level, allowing you to set your TP1 level as a percentage amount above the entry price or based on RR.
What's the day filter Filter, what does it do?
The day filter allows users to customize the session time and choose the specific days they want to include in the strategy session. This helps traders tailor their strategies to particular trading sessions or days of the week when they believe the market conditions are more favorable for their trading style.
Customize Session Time:
Users can define the start and end times for the trading session.
This allows the strategy to only consider trades within the specified time window, focusing on periods of higher market activity or preferred trading hours.
Select Days:
Users can select which days of the week to include in the strategy.
This feature is useful for excluding days with historically lower volatility or unfavorable trading conditions (e.g., Mondays or Fridays).
Benefits:
Focus on Optimal Trading Periods:
By customizing session times and days, traders can focus on periods when the market is more likely to present profitable opportunities.
Avoid Unfavorable Conditions:
Excluding specific days or times can help avoid trading during periods of low liquidity or high unpredictability, such as major news events or holidays.
What tables are available in this script?
- Summary: Provides a general overview, displaying key performance parameters such as Net Profit, Profit Factor, Max Drawdown, Average Trade, Closed Trades and more.
Total Commission: Displays the cumulative commissions incurred from all trades executed within the selected backtesting window. This value is derived by summing the commission fees for each trade on your chart.
Average Commission: Represents the average commission per trade, calculated by dividing the Total Commission by the total number of closed trades. This metric is crucial for assessing the impact of trading costs on overall profitability.
Avg Trade: The sum of money gained or lost by the average trade generated by a strategy. Calculated by dividing the Net Profit by the overall number of closed trades. An important value since it must be large enough to cover the commission and slippage costs of trading the strategy and still bring a profit.
MaxDD: Displays the largest drawdown of losses, i.e., the maximum possible loss that the strategy could have incurred among all of the trades it has made. This value is calculated separately for every bar that the strategy spends with an open position.
Profit Factor: The amount of money a trading strategy made for every unit of money it lost (in the selected currency). This value is calculated by dividing gross profits by gross losses.
Avg RR: This is calculated by dividing the average winning trade by the average losing trade. This field is not a very meaningful value by itself because it does not take into account the ratio of the number of winning vs losing trades, and strategies can have different approaches to profitability. A strategy may trade at every possibility in order to capture many small profits, yet have an average losing trade greater than the average winning trade. The higher this value is, the better, but it should be considered together with the percentage of winning trades and the net profit.
Winrate: The percentage of winning trades generated by a strategy. Calculated by dividing the number of winning trades by the total number of closed trades generated by a strategy. Percent profitable is not a very reliable measure by itself. A strategy could have many small winning trades, making the percent profitable high with a small average winning trade, or a few big winning trades accounting for a low percent profitable and a big average winning trade. Most mean-reversion successful strategies have a percent profitability of 40-80% but are profitable due to risk management control.
BE Trades: Number of break-even trades, excluding commission/slippage.
Losing Trades: The total number of losing trades generated by the strategy.
Winning Trades: The total number of winning trades generated by the strategy.
Total Trades: Total number of taken traders visible your charts.
Net Profit: The overall profit or loss (in the selected currency) achieved by the trading strategy in the test period. The value is the sum of all values from the Profit column (on the List of Trades tab), taking into account the sign.
- Monthly: Displays performance data on a month-by-month basis, allowing users to analyze performance trends over each month and year.
- Weekly: Displays performance data on a week-by-week basis, helping users to understand weekly performance variations.
- UI Table: A user-friendly table that allows users to view and save the selected strategy parameters from user inputs. This table enables easy access to key settings and configurations, providing a straightforward solution for saving strategy parameters by simply taking a screenshot with Alt + S or ⌥ + S.
User-input styles and customizations:
Please note that all background colors in the style are disabled by default to enhance visualization.
How to Use This Strategy to Create a Profitable Edge and Systems?
Choose Your Strategy mode:
- Decide whether you are creating an investing strategy or a trading strategy.
Select a Market:
- Choose a one-sided market such as stocks, indices, or cryptocurrencies.
Historical Data:
- Ensure the historical data covers at least 10 years of price action for robust backtesting.
Timeframe Selection:
- Choose the timeframe you are comfortable trading with. It is strongly recommended to use a timeframe above 15 minutes to minimize the impact of commissions/slippage on your profits.
Set Commission and Slippage:
- Properly set the commission and slippage in the strategy properties according to your broker/prop firm specifications.
Parameter Optimization:
- Use trial and error to test different parameters until you find the performance results you are looking for in the summary table or, preferably, through deep backtesting using the strategy tester.
Trade Count:
- Ensure the number of trades is 200 or more; the higher, the better for statistical significance.
Positive Average Trade:
- Make sure the average trade is above zero.
(An important value since it must be large enough to cover the commission and slippage costs of trading the strategy and still bring a profit.)
Performance Metrics:
- Look for a high profit factor, and net profit with minimum drawdown.
- Ideally, aim for a drawdown under 20-30%, depending on your risk tolerance.
Refinement and Optimization:
- Try out different markets and timeframes.
- Continue working on refining your edge using the available filters and components to further optimize your strategy.
What makes this strategy original?
Incorporation of Fundamental Analysis:
This strategy integrates fundamental analysis by considering key economic indicators such as interest rates, inflation, GDP growth, and unemployment rates. These fundamentals help in assessing the broader economic health, which in turn influences sector performance and market trends. By understanding these economic conditions, the strategy can identify sectors or assets that are likely to thrive, ensuring investments are made in environments conducive to growth. This approach allows for a more informed investment decision, aligning technical entries with fundamentally strong market conditions, thus potentially enhancing the strategy's effectiveness over time.
Technical Analysis Without Classical Methods:
The strategy's technical analysis diverges from traditional methods like moving averages by focusing on market structure through a trend score system.
Instead of using lagging indicators, it employs a real-time analysis of market trends by calculating the ratio of bullish to bearish breakouts. This provides several benefits:
Immediate Market Sentiment: The trend score system reacts more dynamically to current market conditions, offering insights into the market's immediate sentiment rather than historical trends, which can often lag behind real-time changes.
Reduced Overfitting: By not relying on moving averages or similar classical indicators, the strategy avoids the common pitfall of overfitting to historical data, which can lead to poor performance in new market conditions. The trend score provides a fresh perspective on market direction, potentially leading to more robust trading signals.
Clear Entry Signals: With the trend score, entry decisions are based on a clear percentage threshold, making the strategy's decision-making process straightforward and less subjective than interpreting moving average crossovers or similar signals.
Regular Contributions and Reminders:
The strategy encourages regular investments through a system of predefined frequency and amount, which could be weekly, bi-weekly, monthly, quarterly, or yearly. This systematic approach:
Enhances Compounding: Regular contributions leverage the power of compounding, where returns on investments can generate their own returns, potentially leading to exponential growth over time.
Reduces Timing Risk: By investing regularly, the strategy minimizes the risk associated with trying to time the market, spreading out the investment cost over time and potentially reducing the impact of volatility.
Automated Reminders: The script reminds users to make contributions based on their chosen schedule, ensuring consistency and discipline in investment practices, which is crucial for long-term success.
Long-Term Wealth Building:
Focused on long-term wealth accumulation, this strategy:
Promotes Patience and Discipline: By emphasizing regular contributions and a disciplined approach to both entry and risk management, it aligns with the principles of long-term investing, discouraging impulsive decisions based on short-term market fluctuations.
Diversification Across Asset Classes: Operating across crypto, stocks, and commodities, the strategy provides diversification, which is a key component of long-term wealth building, reducing risk through varied exposure.
Growth Over Time: The strategy's design to work with the market's natural growth cycles, supported by fundamental analysis, aims for sustainable growth rather than quick profits, aligning with the goals of investors looking to build wealth over decades.
This comprehensive approach, combining fundamental insights, innovative technical analysis, disciplined investment habits, and a focus on long-term growth, offers a unique and potentially effective pathway for investors seeking to build wealth steadily over time.
Terms and Conditions | Disclaimer
Our charting tools are provided for informational and educational purposes only and should not be construed as financial, investment, or trading advice. They are not intended to forecast market movements or offer specific recommendations. Users should understand that past performance does not guarantee future results and should not base financial decisions solely on historical data.
Built-in components, features, and functionalities of our charting tools are the intellectual property of @Fractalyst Unauthorized use, reproduction, or distribution of these proprietary elements is prohibited.
- By continuing to use our charting tools, the user acknowledges and accepts the Terms and Conditions outlined in this legal disclaimer and agrees to respect our intellectual property rights and comply with all applicable laws and regulations.

MSTR-BTC PremiumThis custom indicator, “MSTR-BTC Premium with High, Average, and Low Levels,” helps you analyze the premium of MicroStrategy Incorporated’s (MSTR) stock price in relation to its Bitcoin holdings. By comparing the market capitalization of MSTR to the value of its Bitcoin holdings (using BTCUSD from Coinbase), this indicator calculates a premium that reflects how much the stock price deviates from its Bitcoin-related value.
Key Features:
• Premium Line: The primary feature is the “Premium,” which shows the ratio of MSTR’s market cap relative to its Bitcoin holdings and the BTCUSD price.
• High, Average, and Low Levels: The indicator calculates the highest, lowest, and average premium values over a user-defined period (default is 14 bars). These levels help identify overbought and oversold conditions relative to the stock’s Bitcoin valuation.
• Visual Shading: The area between the premium line and the average is shaded, making it easier to see when the premium is above or below its typical level. Optional shading is also available between the high and low levels to visualize the price range.
How to Use:
• Overbought/Undervalued Conditions: When the premium line rises significantly above the average, it may indicate that MSTR stock is overbought compared to its Bitcoin holdings. Conversely, when the premium falls below the average or approaches the low line, it might signal an undervalued opportunity.
• Trend and Mean Reversion: The high and low lines provide insight into extreme levels. Monitoring these alongside the average can assist in identifying potential mean reversion trades.
Customization:
• Calculation Period: The period for calculating the high, low, and average values can be adjusted to suit your trading strategy (default is 14).
• Shading Options: By default, the area between the premium and its average is shaded. You can enable or disable the shading between the high and low as needed.
This indicator is particularly useful for traders and investors following MicroStrategy (MSTR) and its Bitcoin strategy, providing a deeper understanding of the stock’s relationship to its underlying Bitcoin assets. It can assist in identifying key levels for decision-making based on deviations from historical norms.
How to Add the Indicator:
1. Adjust the calculation period (default is 14) to customize the analysis according to your preferred timeframe.
2. Watch for significant deviations of the premium line from its average to identify potential overbought/oversold conditions.
3. Use the high and low levels to help gauge extreme premium values and possible mean reversion opportunities.
Enjoy the analysis and make more informed decisions with the MSTR-BTC Premium Indicator!
This description should be clear and informative for anyone considering using your indicator. It highlights the functionality, purpose, and customization options in a straightforward way. Let me know if you’d like to tweak or adjust any part of it!

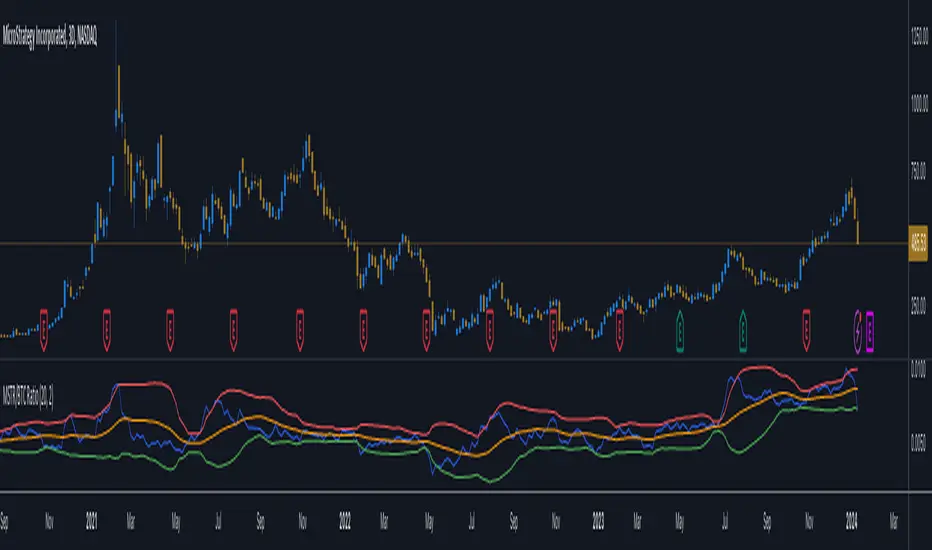
MicroStrategy / Bitcoin Market Cap RatioThis indicator offers a unique analytical perspective by comparing the market capitalization of MicroStrategy (MSTR) with that of Bitcoin (BTC) . Designed for investors and analysts interested in the correlation between MicroStrategy's financial performance and the Bitcoin market, the script calculates and visualizes the ratio of MSTR's market capitalization to Bitcoin's market capitalization.
Key Features:
Start Date: The script considers data starting from July 28, 2020, aligning with MicroStrategy's initial announcement to invest in Bitcoin.
Data Sources: It retrieves real-time data for MSTR's total shares outstanding, MSTR's stock price, and BTC's market capitalization.
Market Cap Calculations: The script calculates MicroStrategy's market cap by multiplying its stock price with the total shares outstanding. It then forms a ratio of MSTR's market cap to BTC's market cap.
Bollinger Bands: To add a layer of analysis, the script includes Bollinger Bands around the ratio, with customizable parameters for length and multiplier. These bands can help identify overbought or oversold conditions in the relationship between MSTR's and BTC's market values.
The indicator plots the MSTR/BTC market cap ratio and the Bollinger Bands, providing a clear visual representation of the relationship between these two market values over time.
This indicator is ideal for users who are tracking the impact of Bitcoin's market movements on MicroStrategy's valuation or vice versa. It provides a novel way to visualize and analyze the interconnectedness of a leading cryptocurrency asset and a major corporate investor in the space.
MicroStrategy MetricsA script showing all the key MSTR metrics. I will update the script every time degen Saylor sells some more office furniture to buy BTC.
All based around valuing MSTR, aside from its BTC holdings. I.e. the true market cap = enterprise value - BTC holdings. Hence, you're left with the value of the software business + any premium/discount decided by investors.
From this we can derive:
- BTC Holdings % of enterprise value
- Correlation to BTC (in this case we use CME futures...may change this)
- Equivalent Share Price (true market cap divided by shares outstanding)
- P/E Ratio (equivalent share price divided by quarterly EPS estimates x 4)
- Price to FCF Ratio (true market cap divided by FCF (ttm))
- Price to Revenue (^ but with total revenue (ttm))

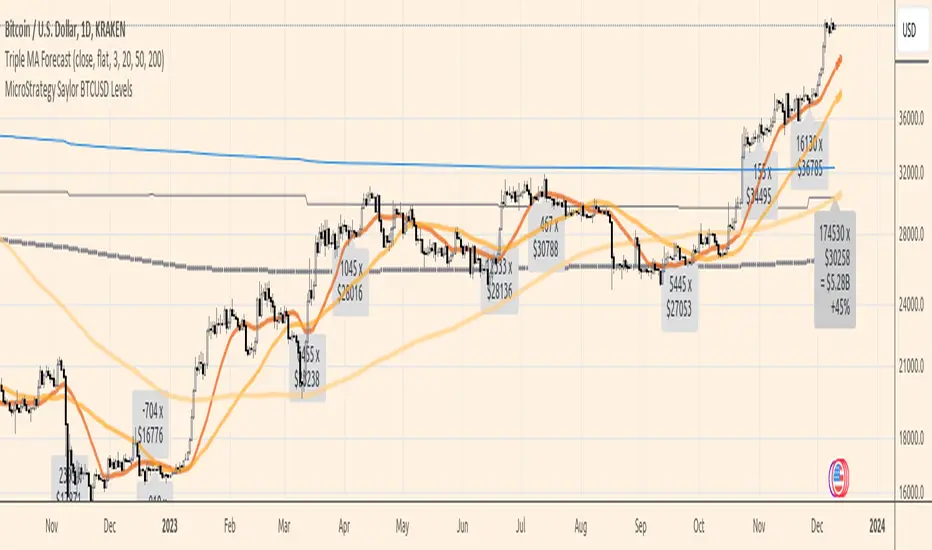
MicroStrategy Saylor BTCUSD LevelsDisplays the price levels of MicroStrategy's Bitcoin acquisitions according to their 8-K filings, total accumulated BTC, average USD price, and current gain.
MicroStrategy Software Business Share PriceSimilar to the MicroStrategy Premium script. This indicator derives MSTR's core software business value by calculating its Bitcoin holdings as a percentage of market cap. Thus you can do, (1 - Bitcoin holdings as a % of market cap) * current share price = Core business share price
