Moving
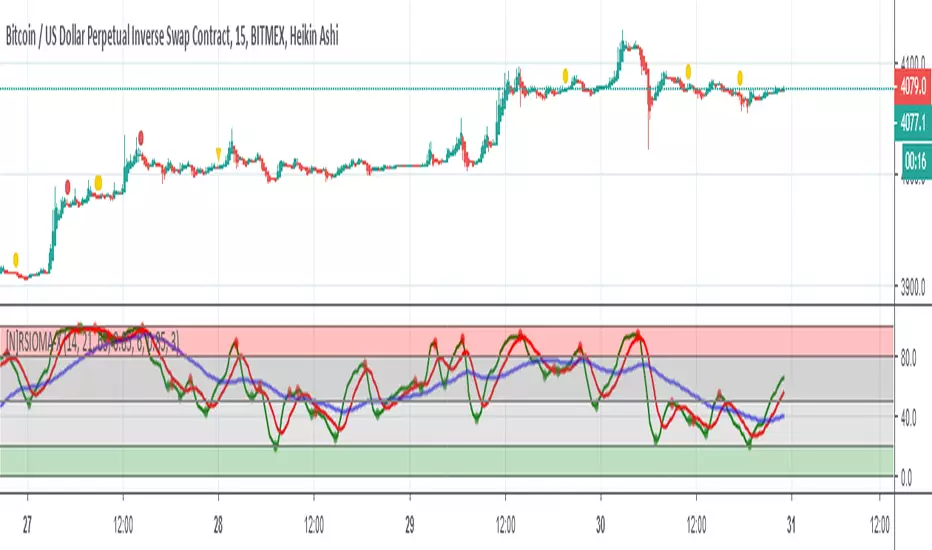
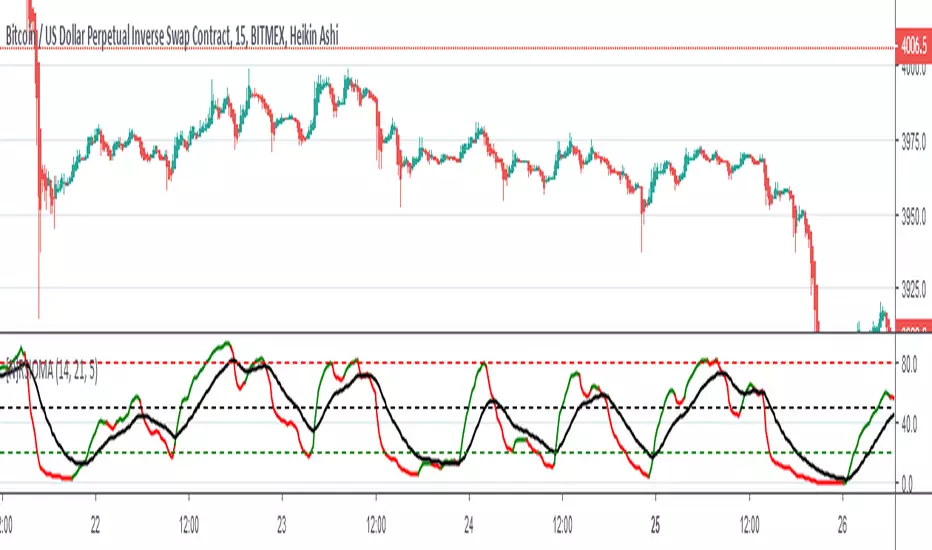
[N]RSIOMA - eXtremisRSIOMA Indicator
This indicator takes two moving averages, calculates their RSI (Relative Strength Index) and then also adds a moving average of the calculated RSI. These two lines now can accurately signal the trend changes.
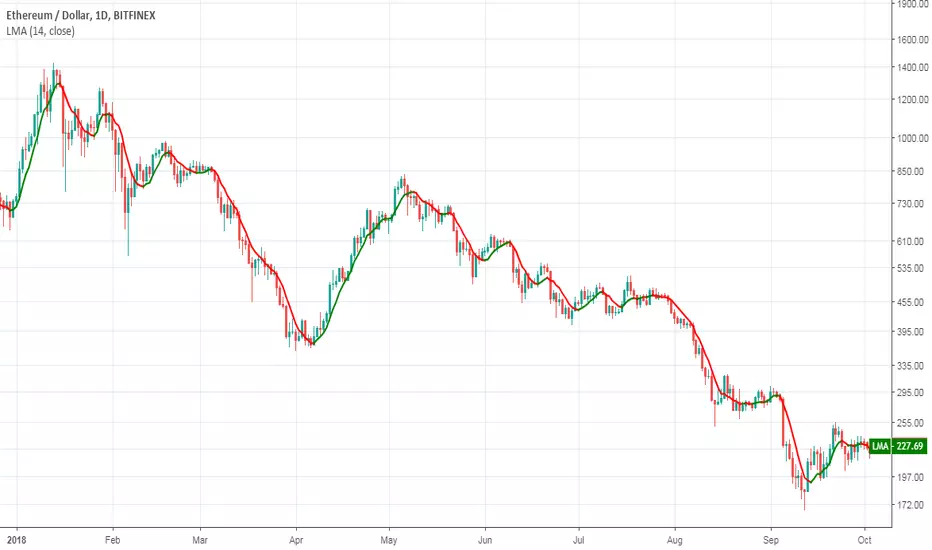
RSIOMA eXtremis is based on ALMA (Arnaud Legoux Moving Average)
- Why ALMA?
- The Arnaud Legoux moving average applies the moving average twice, once from left to right and the other from right from left with the process said to eliminate price lag or phase shift significantly ,
a problem that is common to the traditional moving averages.
About ALMA
Offset : The offset value is used to tweak the ALMA to be more inclined towards responsiveness or smoothness. The offset can be set in decimals between 0 and 1. A setting of 0.99 makes the ALMA extremely responsive, while a value of 0.01 makes it very smooth.
Sigma : The sigma setting is a parameter used for the filter. A setting of 6 makes the filter rather large while a smaller sigma setting makes it more focused.
About Market Base
It shows the overall direction of the market. The overall market has a tendency to do two things. It can turn slowly, or it can continue to go in the initial direction. This is because it’s too big and it can’t turn too quickly.
About Divergences
Regular Divergence - regular divergence is a sign of trend reversal.
Hidden Divergence - hidden divergence is a sign of trend continuation
RSIOMA eXtremis can detect all types.
HOW TO TRADE
- Look out for bounces. When RSI line bounces off from MA line it means the trend will likely continue;
- Look out for support / resistance of RSI LINE.
- Look out for Market Base Line, it can be used to determine the long-term trend.
- 20 - 80 levels are important
- Green > Red = Long
- Red > Green = Short
- Green > Red > Market Base = you can go long for a while
- Red > Green > Market Base = you can go short for a while
- Green & Red bounce from Market Base = initial trend will continue
- Look out for divergences
- Look out for retests after bounces
- Look out for those tiny dots!! Those can tell you a great story. ;)
Try different settings for your strategy
MAY THE % BE WITH YOU!
[N]RSIOMARSIOMA is the abbreviation for Relative Strength index (RSI) of moving averages (MA).
Rules:
RSI above MA and RSI above level 50 is a signal of a bullish trend. RSI below MA and RSI below level 50 is a signal of a bearish trend.
One can also buy when the RSI breaks level 20 from below and sell when RSI breaks level 80 from above
Tip 1: Look out for bounces. When RSI line bounces off from MA line it means the trend will likely continue;
Tip 2: Look out for support / resistance of RSI LINE.
Tip 3: USE as follow = higher timeframe to lower timeframe
(YEK) Combo(YEK) Combo is a combination of several indicators (listed below). You can use them together or one by one. Just click settings, and choose which of them to be shown.
Here are the indicators included in this script:
- Ichimoku Cloud
- Bollinger Bands
- Moving Average 1
- Moving Average 2 (In case of detecting golden crosses or death crosses)
- Exponential Moving Average
- T3 Tillson
- MavilimW
Enjoy!

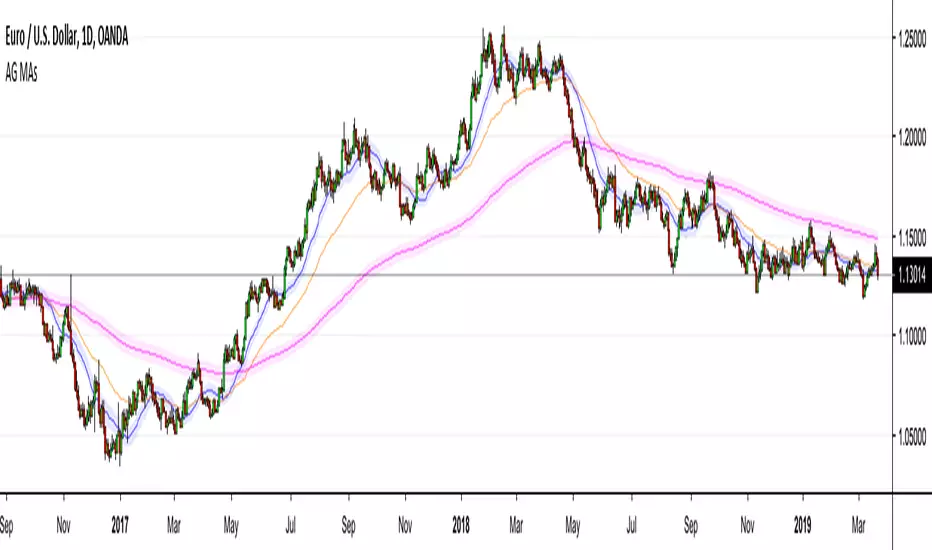
AG Moving Averages w/ BandsThis is an indicator that we built from a few simple ideas: display more than one Moving Average, display the Moving Average "Band" (more below) for each Moving Average, and allowing toggle between SMA/EMA - all in the one indicator.
The Moving Average "Band" is creating using Moving Averages (SMA/EMA) with High and Low as sources. The combination of the MA(Close), MA(High), MA(Low), creates a "Band" for each MA length - which we have found to be very helpful in our Moving Average studies.
The example in the chart above is EURUSD with 20SMA (with Bands), 55EMA (without Bands), 200EMA (with Bands). As you can see, the Bands do a better job than MAs alone for capturing price movement and acting as larger dynamic Support/Resistance zones.
Everything in this indicator is fully customizable, from which MAs to show, to those MA lengths, whether to use SMA/EMA for each individual MA, and whether to display the MA "Band" for each individual MA.
We hope you find it as useful as we have!
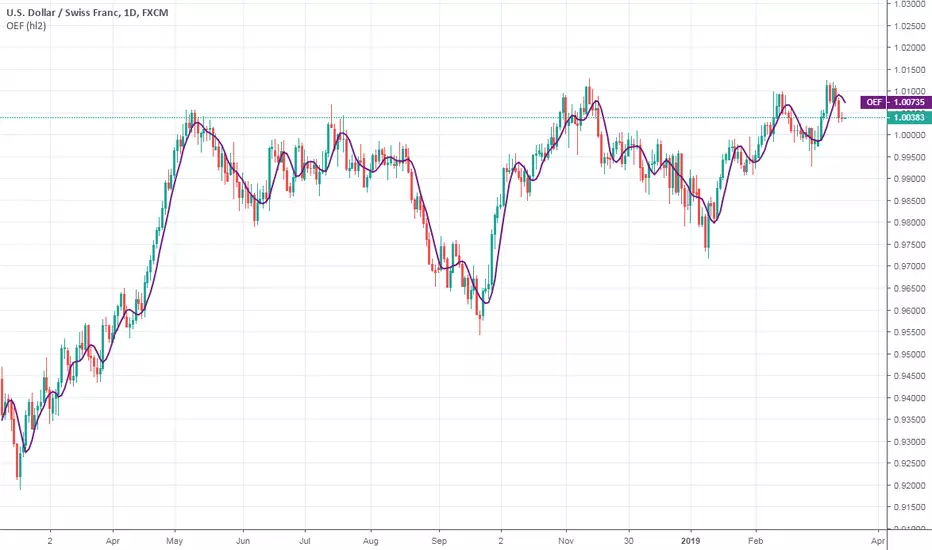
Ehlers Optimum Elliptic FilterThis indicator was originally developed by John F. Ehlers (Stocks & Commodities, V.18:7 (July, 2000): "Optimal Detrending").
Mr. Ehlers worked on the smoother that could have no more than a one-bar lag. An elliptic filter provides the maximum amount of smoothing under the constraint of a given lag.
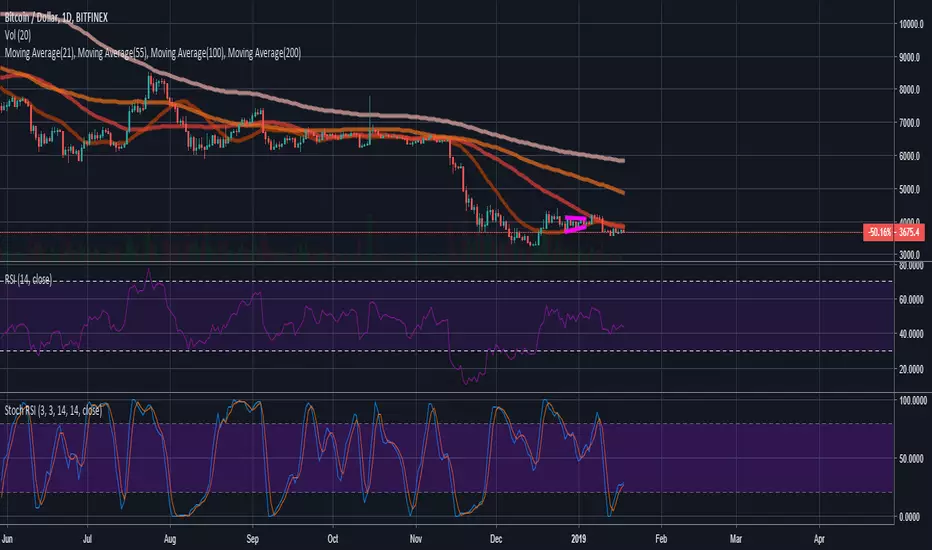
Kelleys Personal EntriesThis indicator uses moving averages along with Stock and RSI to find entries. Made for higher time frames, IE 12 hour or higher

Volume - Moving Sum (Quote Currency)This indicator shows a MOVING SUM of the QUOTE CURRENCY of the pair.
I made this because I wanted to be able to see how the 24HR volume looked on 1-Minute charts (which is why the default period is 1440, as there are 1440 minutes in a day.)

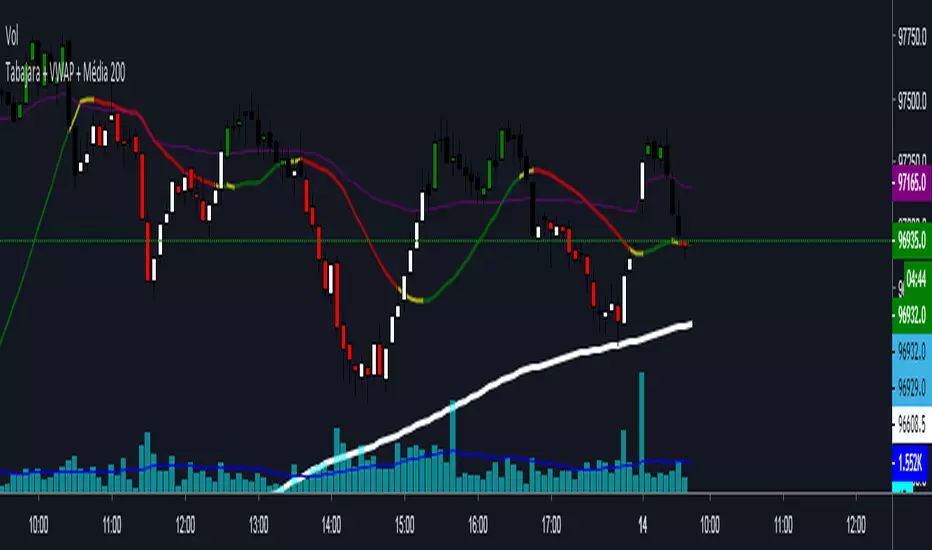
Tabajara + VWAP + Media 200Tabajara was created by André Machado, the Wall Street Ogre.
The Tabajara is accompanied by an average of 200 periods and the daily VWAP.
Suggestions will be very welcome!
Good profit and good trades!
Att
Felipe Kruger
Mash Moving AveragesThis tweaked Moving averages script allows you to edit your Moving Averages to whatever you like, plus you have the option of choosing EMA and SMA
Synchronicity 3 Displaced SMAsA simple, clean script that displays three simple moving averages and allows you to displace them forward by a number of bars. I have set the defaults to
Period, 3 Shift, 3
Period, 7 Shift, 5
Period, 25 Shift, 25
These are the defaults for use with Joe DiNapoli strategies.
Further changes to make them fore flexible, like switching each one on or off may come if required.
No donations sought, just a wee like if you like it.

Smoothed Heiken Ashi CandlesHeikin Ashi candle strategy. Catches trends. Works miracles over long periods of times on almost any asset.

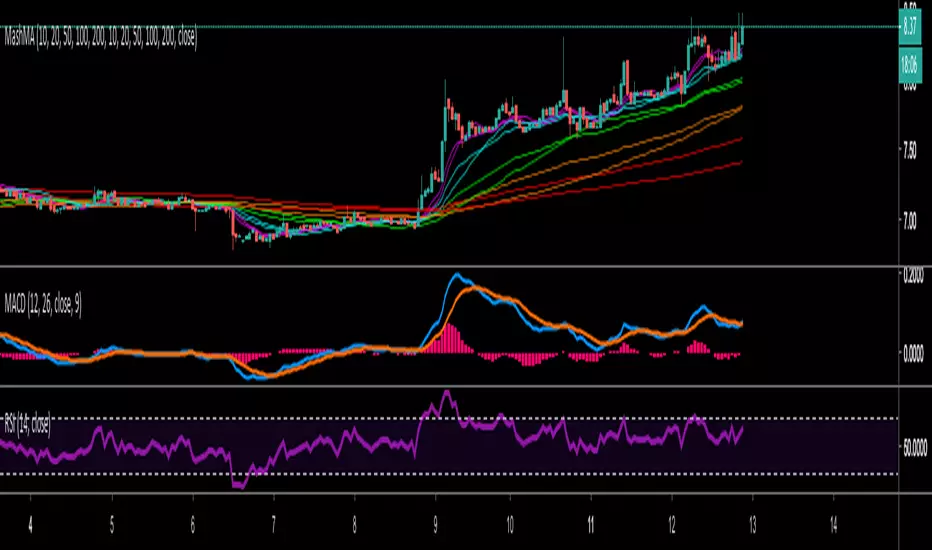
QEMA - Quadruple Moving Averages (50,100,200,300)The script combines the common moving averages 50,100 and 200 and adds an additional MA300 to the graph.
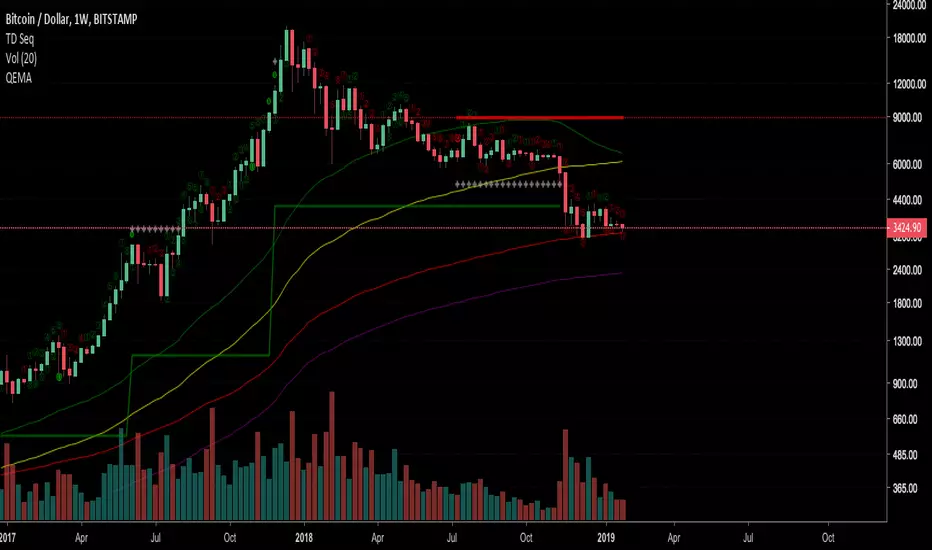
Bitstamp BTC Horizontal 200 Week SMAsmall change to my horizontal 200 week SMA script.
Plots the latest 200 week SMA value from Bitstamp BTCUSD on the chart. I use it for the Bitmex chart, as Bitmex doesn't have enough history for a 200 week moving average.

4SMA Fibonacci 55/89/223/610just noticed the correlation of SMAs and fibonacci on my charts.
maybe it will help you to.

Higher Timeframe EMAThis script plots a higher timeframe EMA to your chart.
You can specify the timeframe and the length of the EMA in the settings.
This chart demonstrates the 5-minute 50EMA (black) combined with the 1-hour 50EMA (colored) on the 1 minute timeframe.

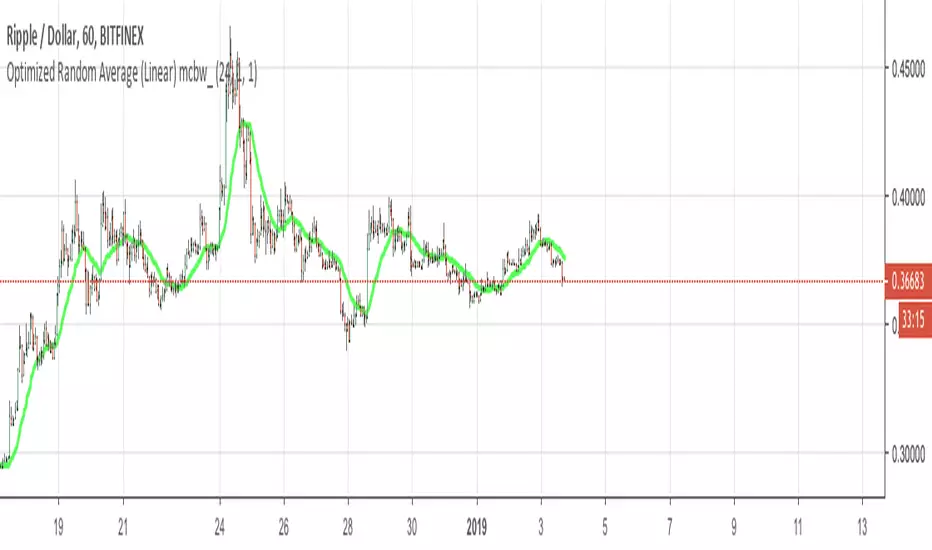
Optimized Random Average (Linear) mcbw_This is a moving average with a customizable random kernel. You can shape your kernel by selecting your parameters in the settings window. This is not something that is immediately ready to mess with by just applying it on the chart, it is very useful for people who are researching indicators and developing new tools. To see the shape of your kernel you can plug it into google or wolfram. This indicator and the related ones are rather technical in nature, so feel free to comment any questions you may have and to see if anyone has asked your question.
Read more here:
Happy studying and enjoy your life!
2019 will be absolutely insane!
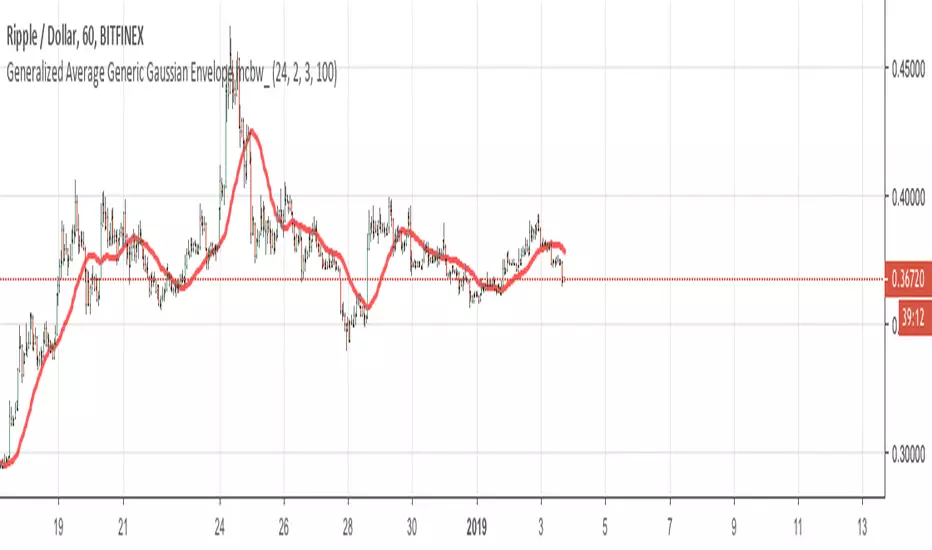
Generalized Average Generic Gaussian Envelope mcbw_This is a moving average with a customizable gaussian kernel. You can shape your kernel by selecting your parameters in the settings window. This is not something that is immediately ready to mess with by just applying it on the chart, it is very useful for people who are researching indicators and developing new tools. To see the shape of your kernel you can plug it into google or wolfram. This indicator and the related ones are rather technical in nature, so feel free to comment any questions you may have and to see if anyone has asked your question.
Read more here:
Happy studying and enjoy your life!
2019 will be absolutely insane!
Generalized Average Polynomial Envelope mcbw_This is a moving average with a customizable polynomial kernel. You can shape your kernel by selecting your parameters in the settings window. This is not something that is immediately ready to mess with by just applying it on the chart, it is very useful for people who are researching indicators and developing new tools. To see the shape of your kernel you can plug it into google or wolfram. This indicator and the related ones are rather technical in nature, so feel free to comment any questions you may have and to see if anyone has asked your question.
Read more here:
Happy studying and enjoy your life!
2019 will be absolutely insane!